-
-
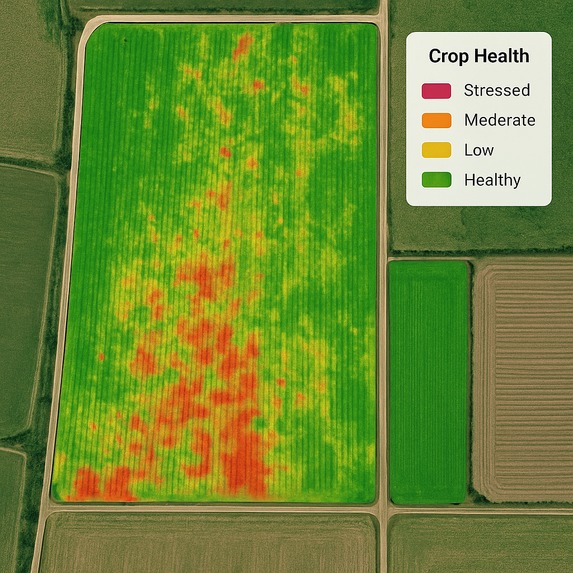
image3
-
image1
-
image2
- Project Story: My Journey in Building Agri-Sense AI My inspiration for this project came from a desire to build something that could have a tangible, positive impact on real-world challenges in India. The hackathon's "Crop identification using satellite data" track immediately caught my attention, as it connects directly to the livelihoods of millions of farmers. I realized that while satellite imagery is abundant, the tools to make it actionable for small-scale farmers are not. I wanted to bridge that gap and create a solution that could help them make better, data-driven decisions.
Over the past few days, I've dived deep into the world of geospatial data and deep learning. I started with a basic understanding of machine learning, but this project pushed me to learn about satellite image processing. I had to figure out how to work with different spectral bands, especially the Near-Infrared (NIR) and Red bands, which are invisible to the naked eye. This led me to understand the importance of vegetation indices like the Normalized Difference Vegetation Index (NDVI), which can be calculated using the following formula:
NDVI= (NIR+Red) (NIR−Red)
This index is a simple yet powerful way to measure plant health.
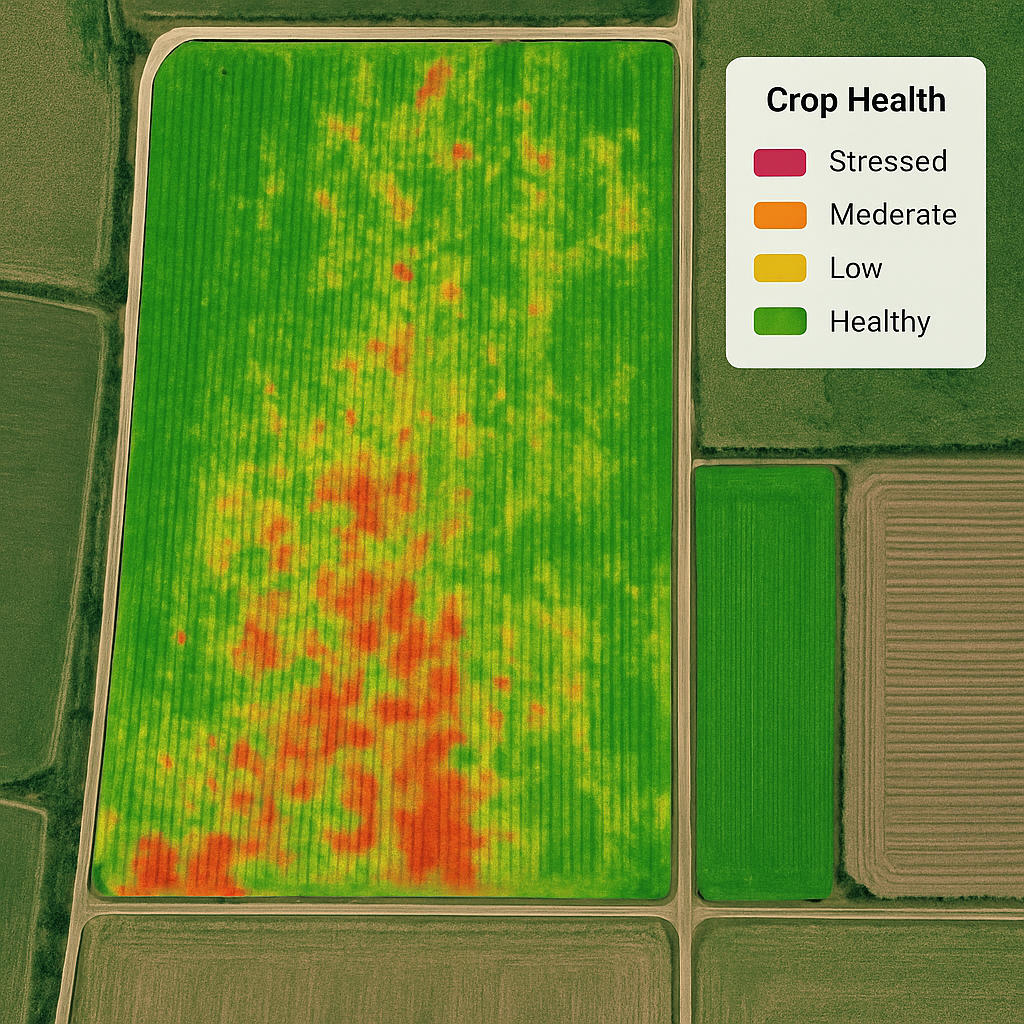
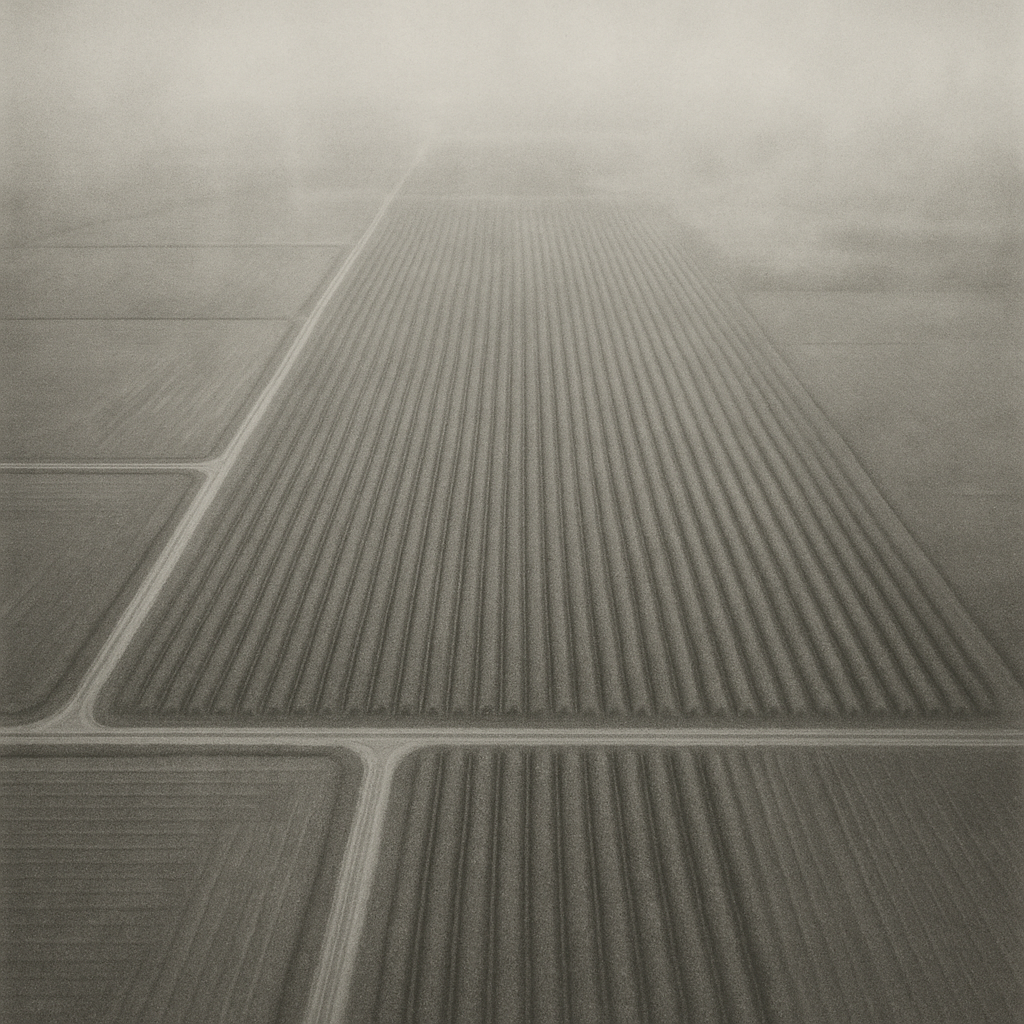
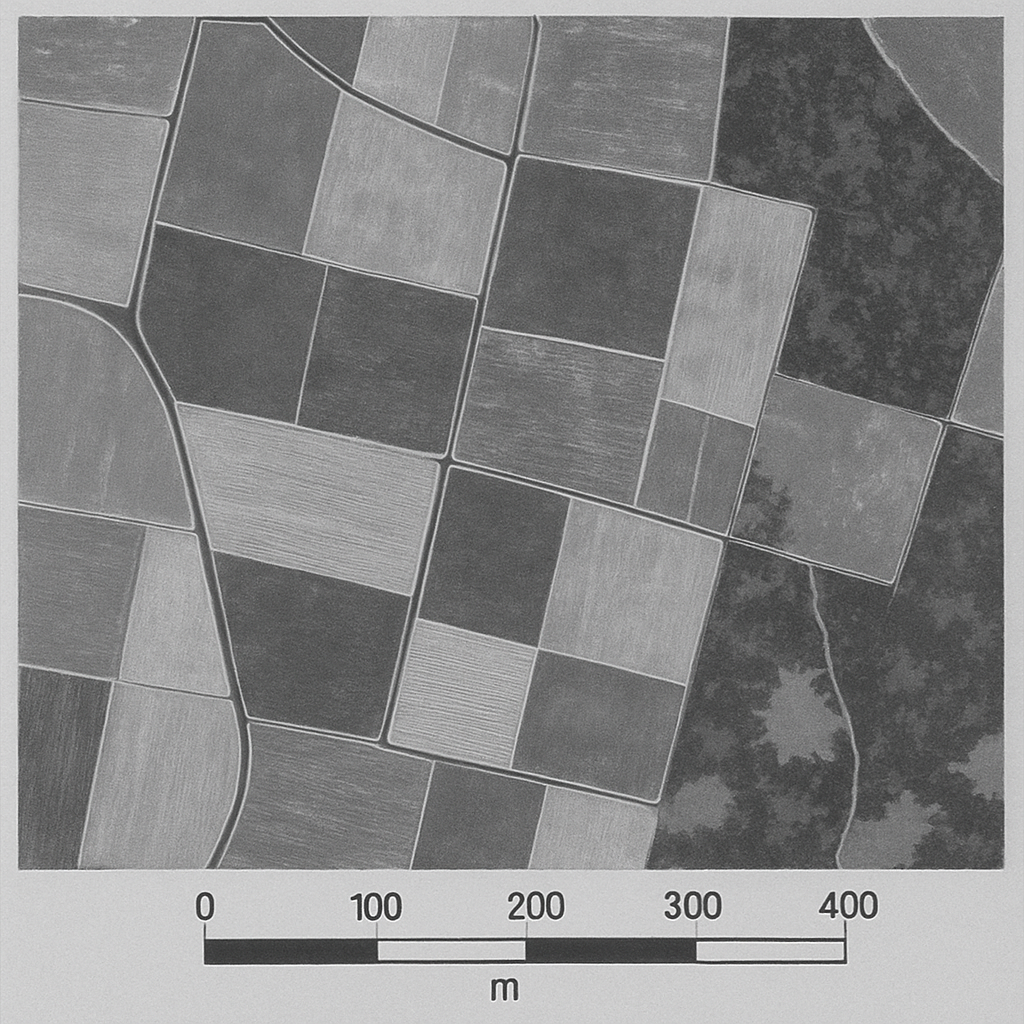
My project was built in three main phases. First, I focused on data acquisition and preprocessing. I downloaded Sentinel-2 satellite images for a specific agricultural area. The main challenge here was dealing with cloud cover, which often obscures the ground and can make the data unusable. I had to develop a simple method to filter out these images. Next, I built and trained a Convolutional Neural Network (CNN) using my processed images. My biggest challenge was making sure the model generalized well to unseen data, as the imagery could vary greatly depending on the season and weather. I iterated on the model architecture until it achieved reliable performance. Finally, I created the visualization layers, exporting my model's predictions to create a clear, color-coded health map. This was the most rewarding part, seeing the data transform from a complex array of numbers into a simple, actionable visual for a farmer.
Built With
- colab
- dataanalysis
- deeplearning
- git
- github
- jupyternotebook
- kagglehub
- machine-learning
- python
- sql
- visualisations
- vscode

Log in or sign up for Devpost to join the conversation.