-
-
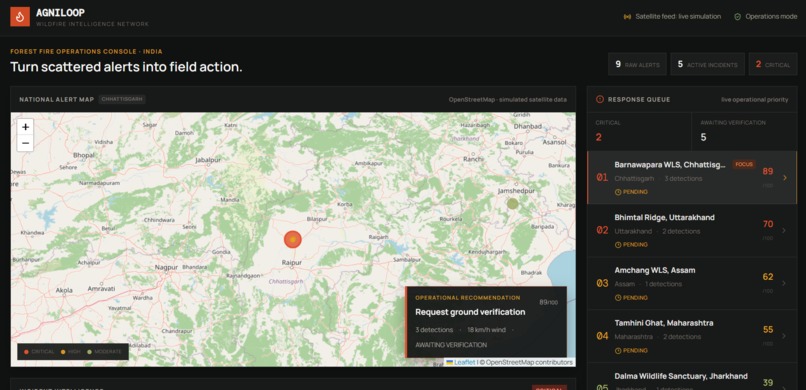
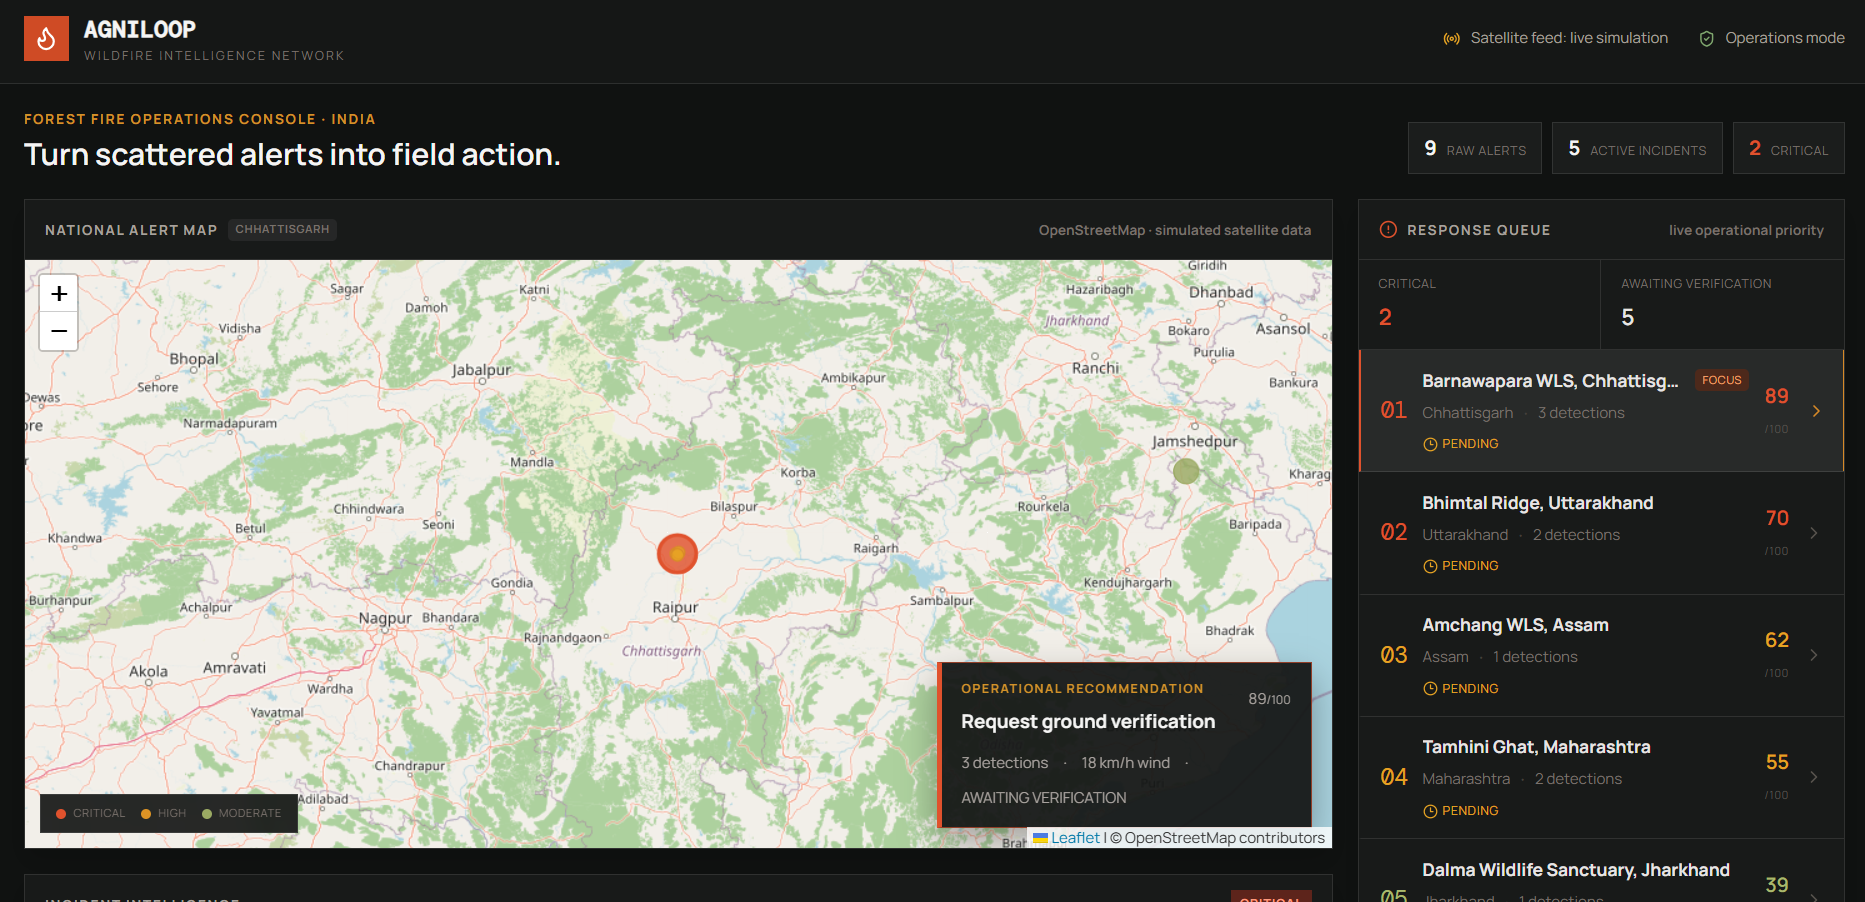
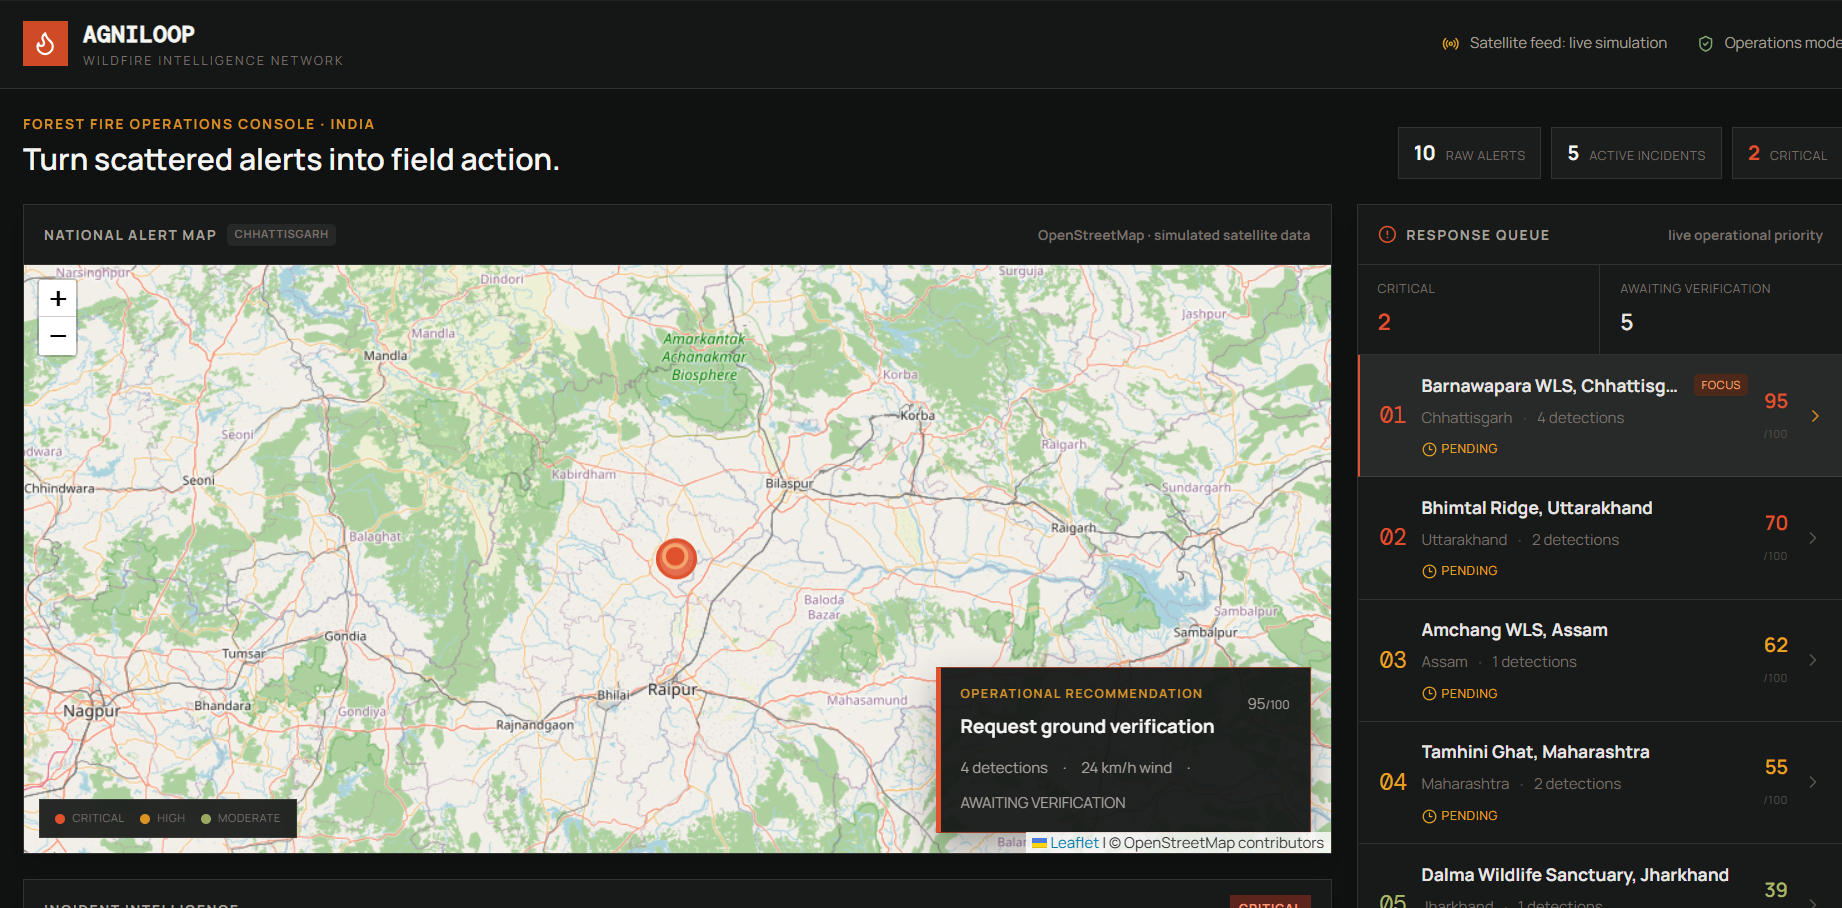
National incident map and response queue showing prioritized wildfire incidents.
-
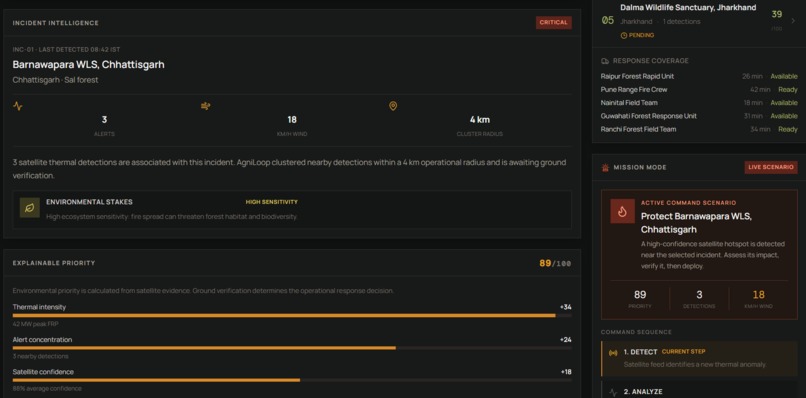
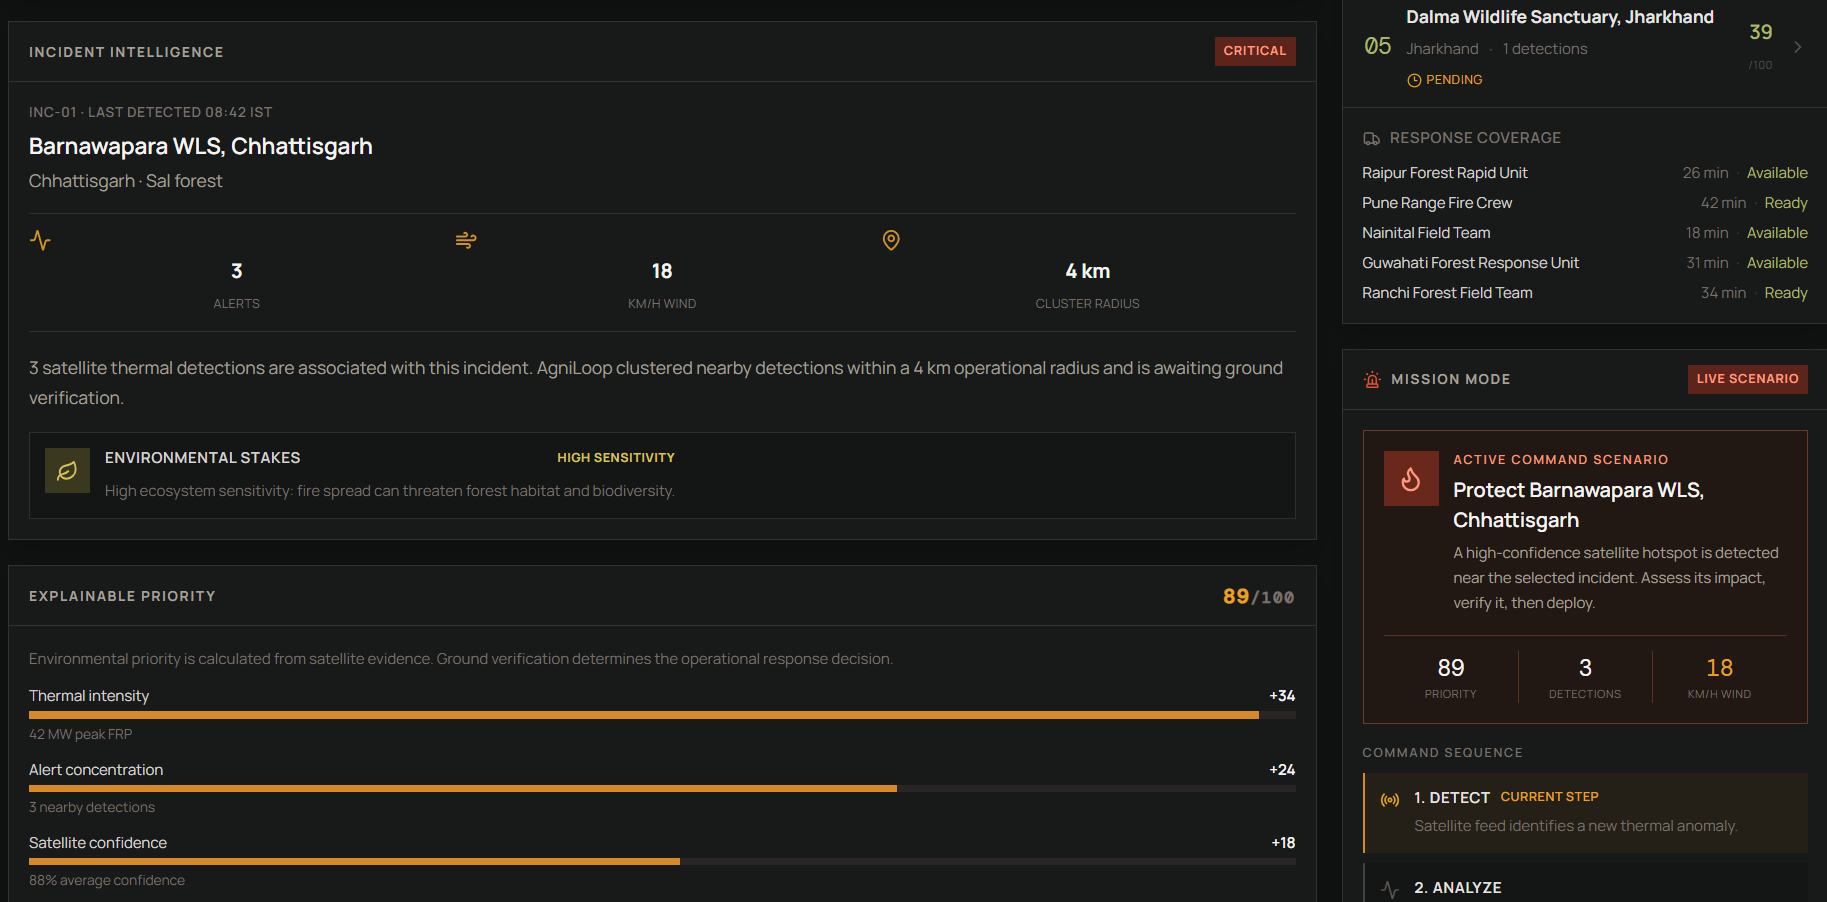
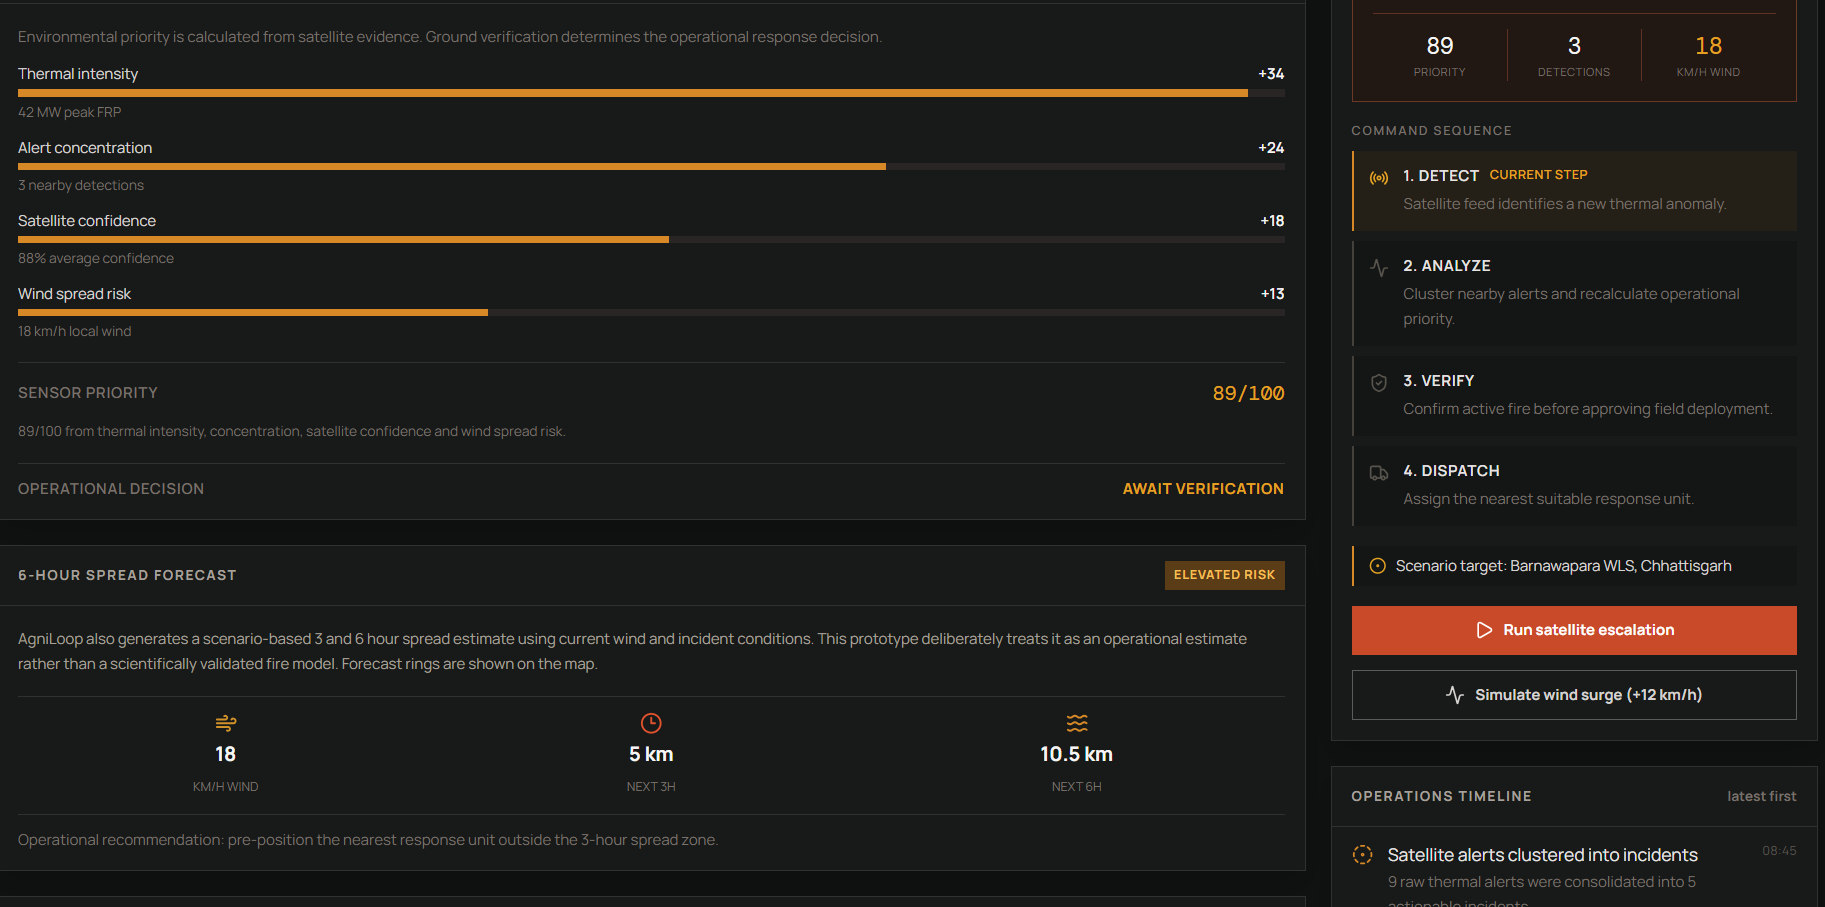
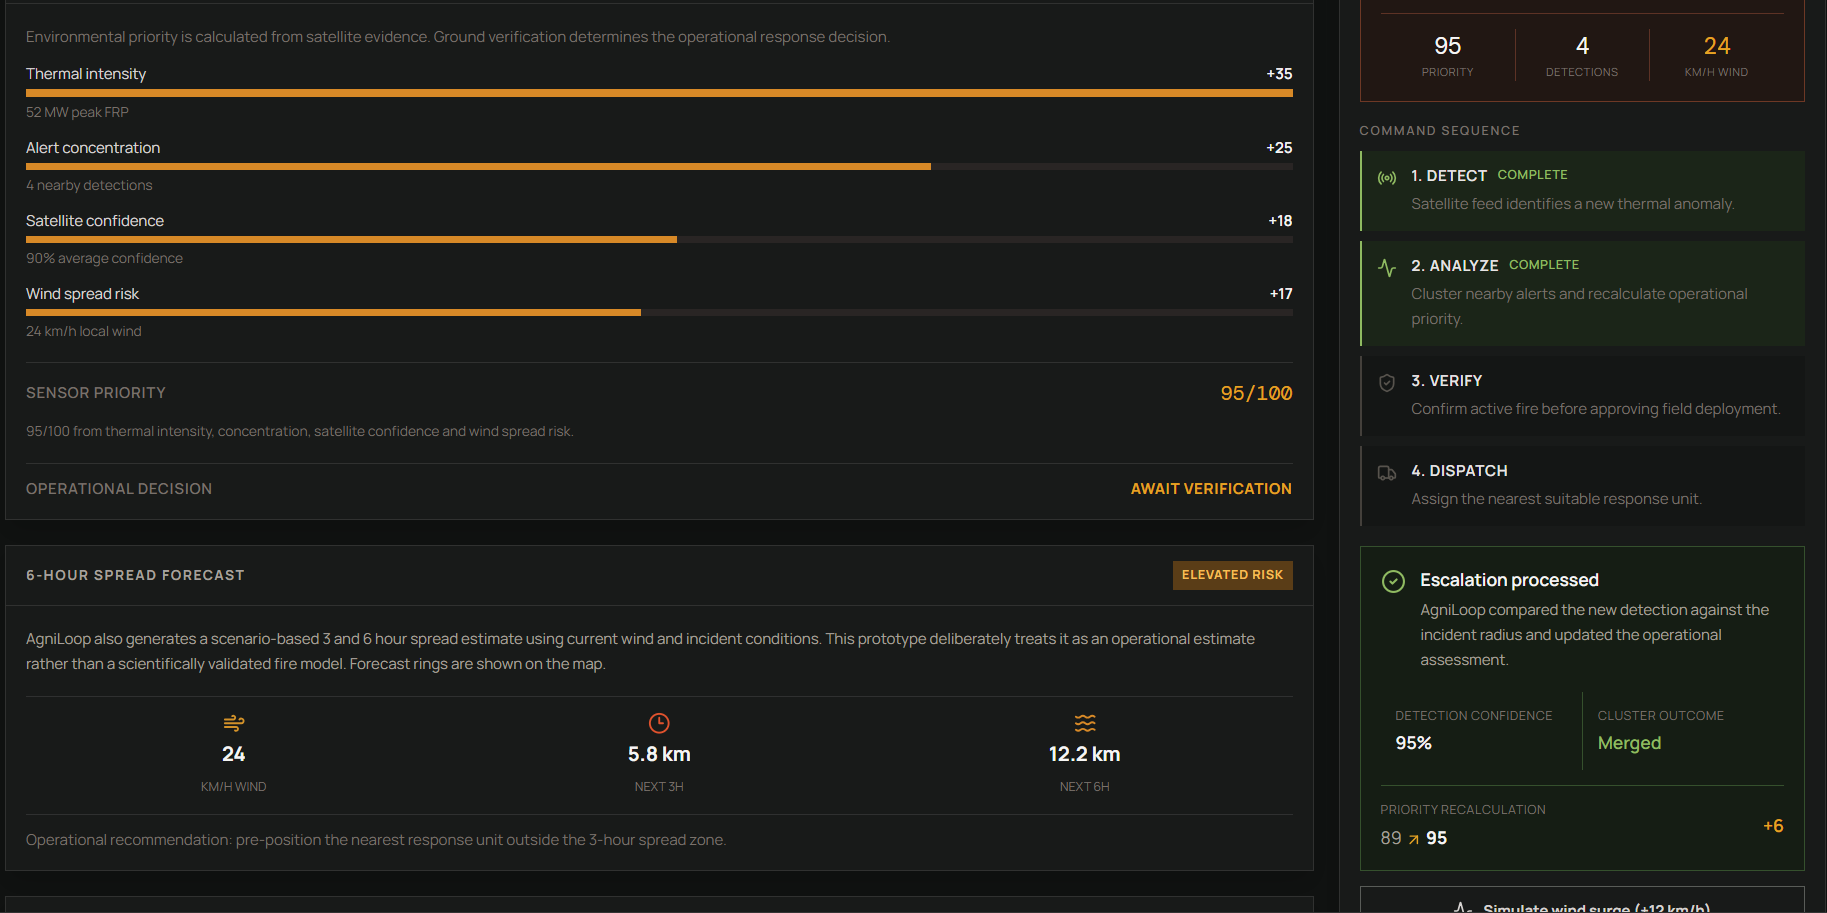
Explainable priority scoring based on thermal intensity, alert concentration, satellite confidence, and wind risk.
-
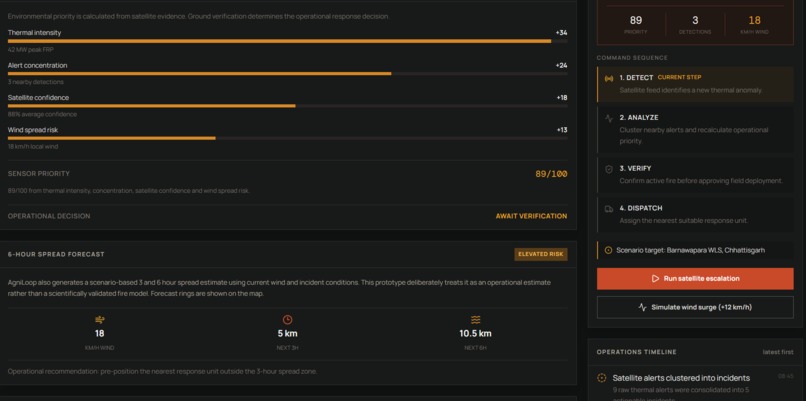
The operational workflow: Detect, Analyze, Verify, then Dispatch.
-
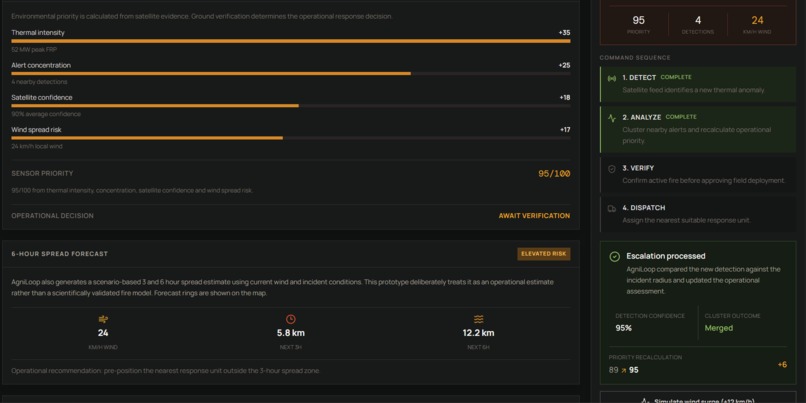
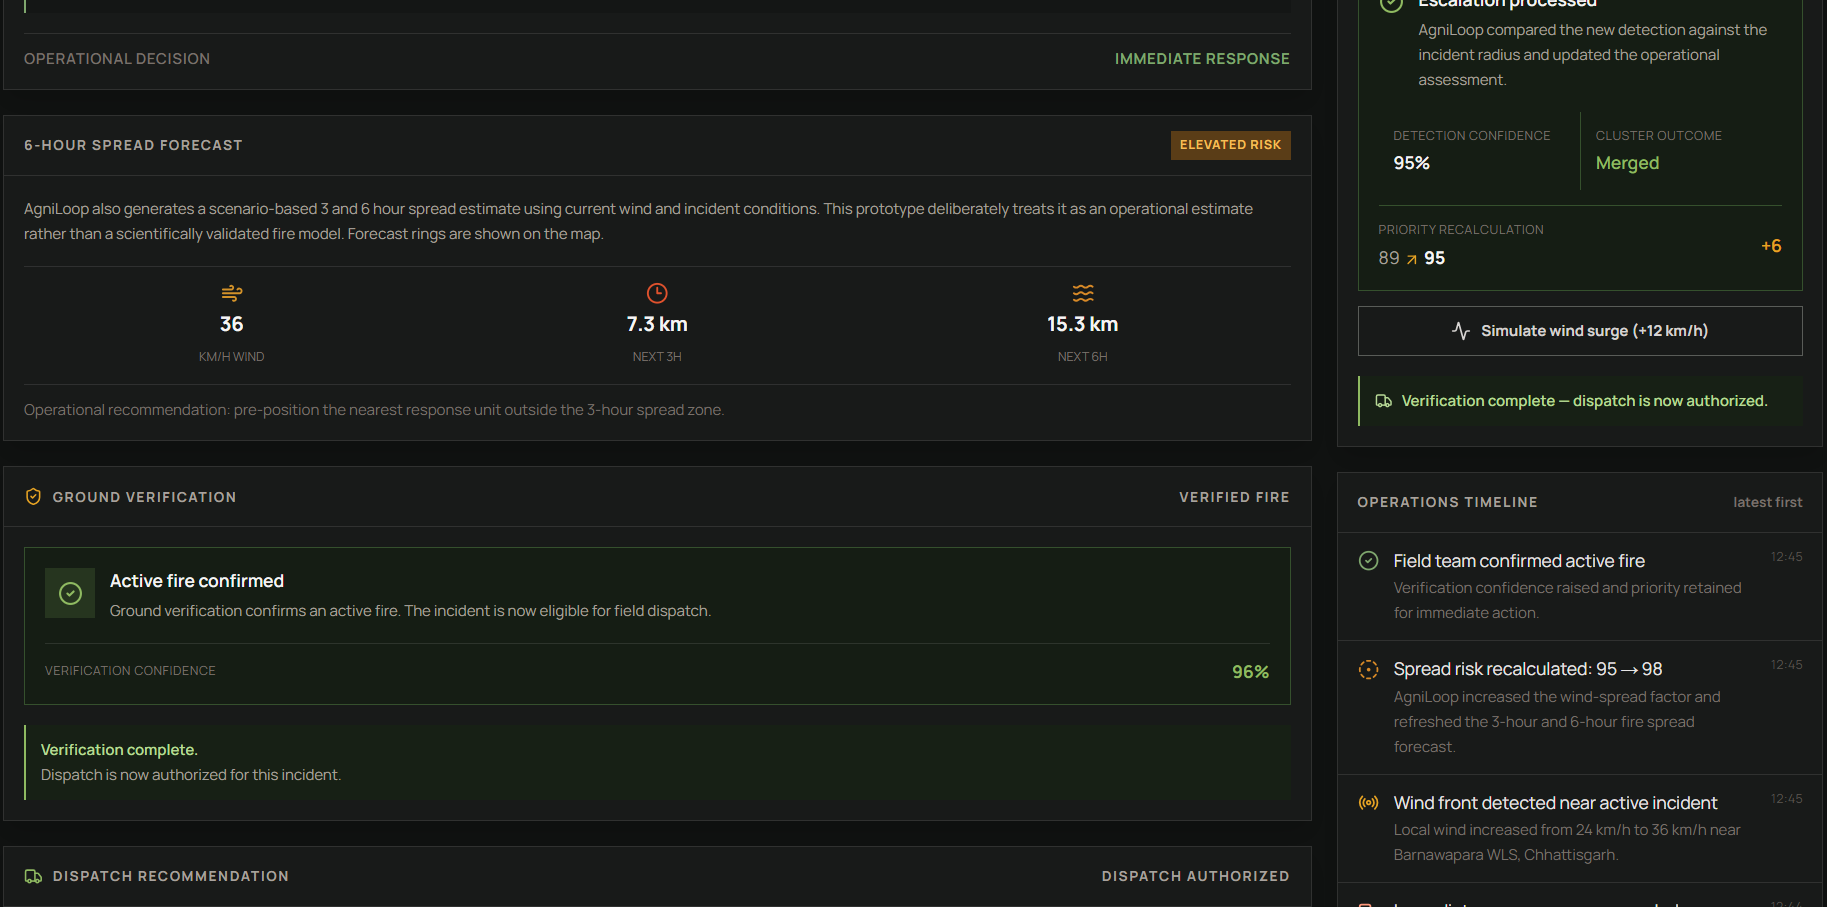
Ground verification confirms whether a high-priority satellite alert is an active fire.
-
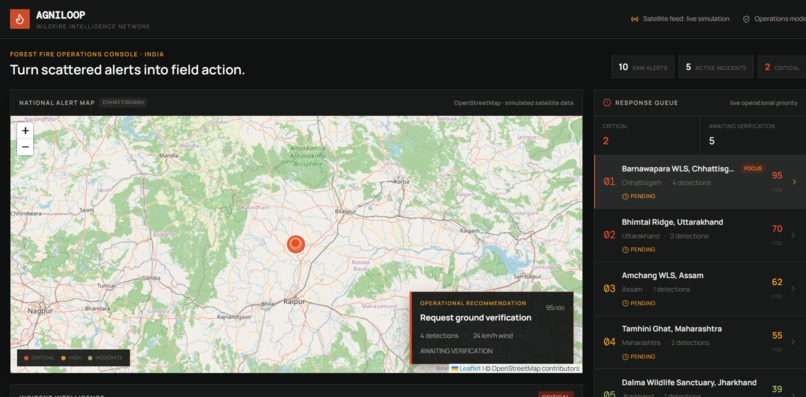
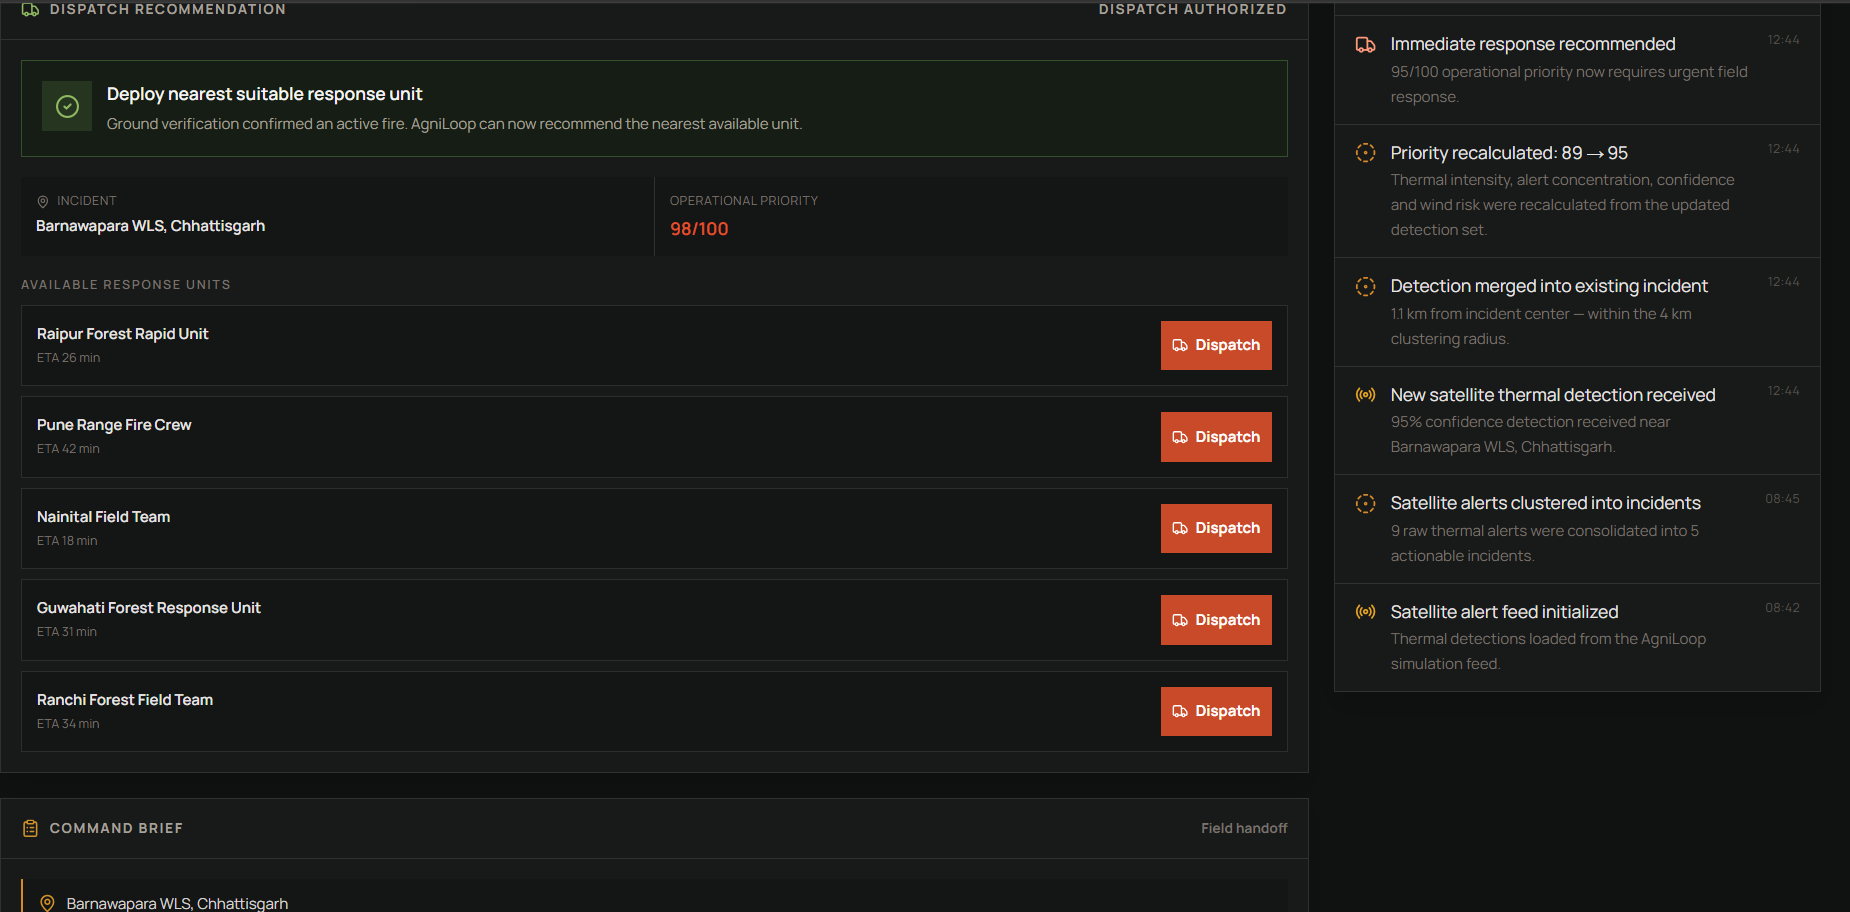
Verified incidents unlock response recommendations and available field units.
-
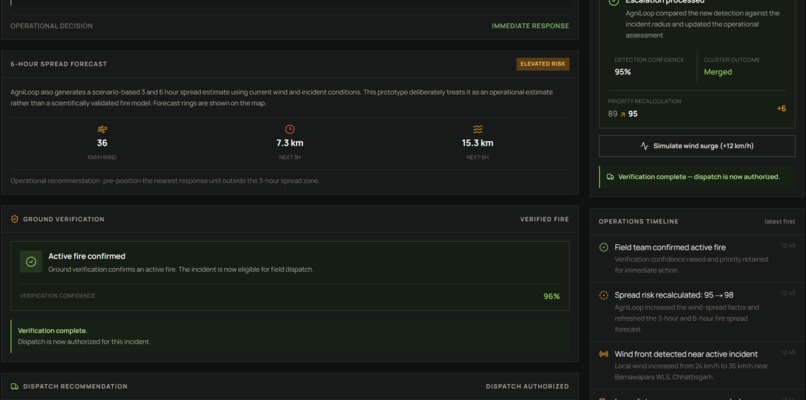
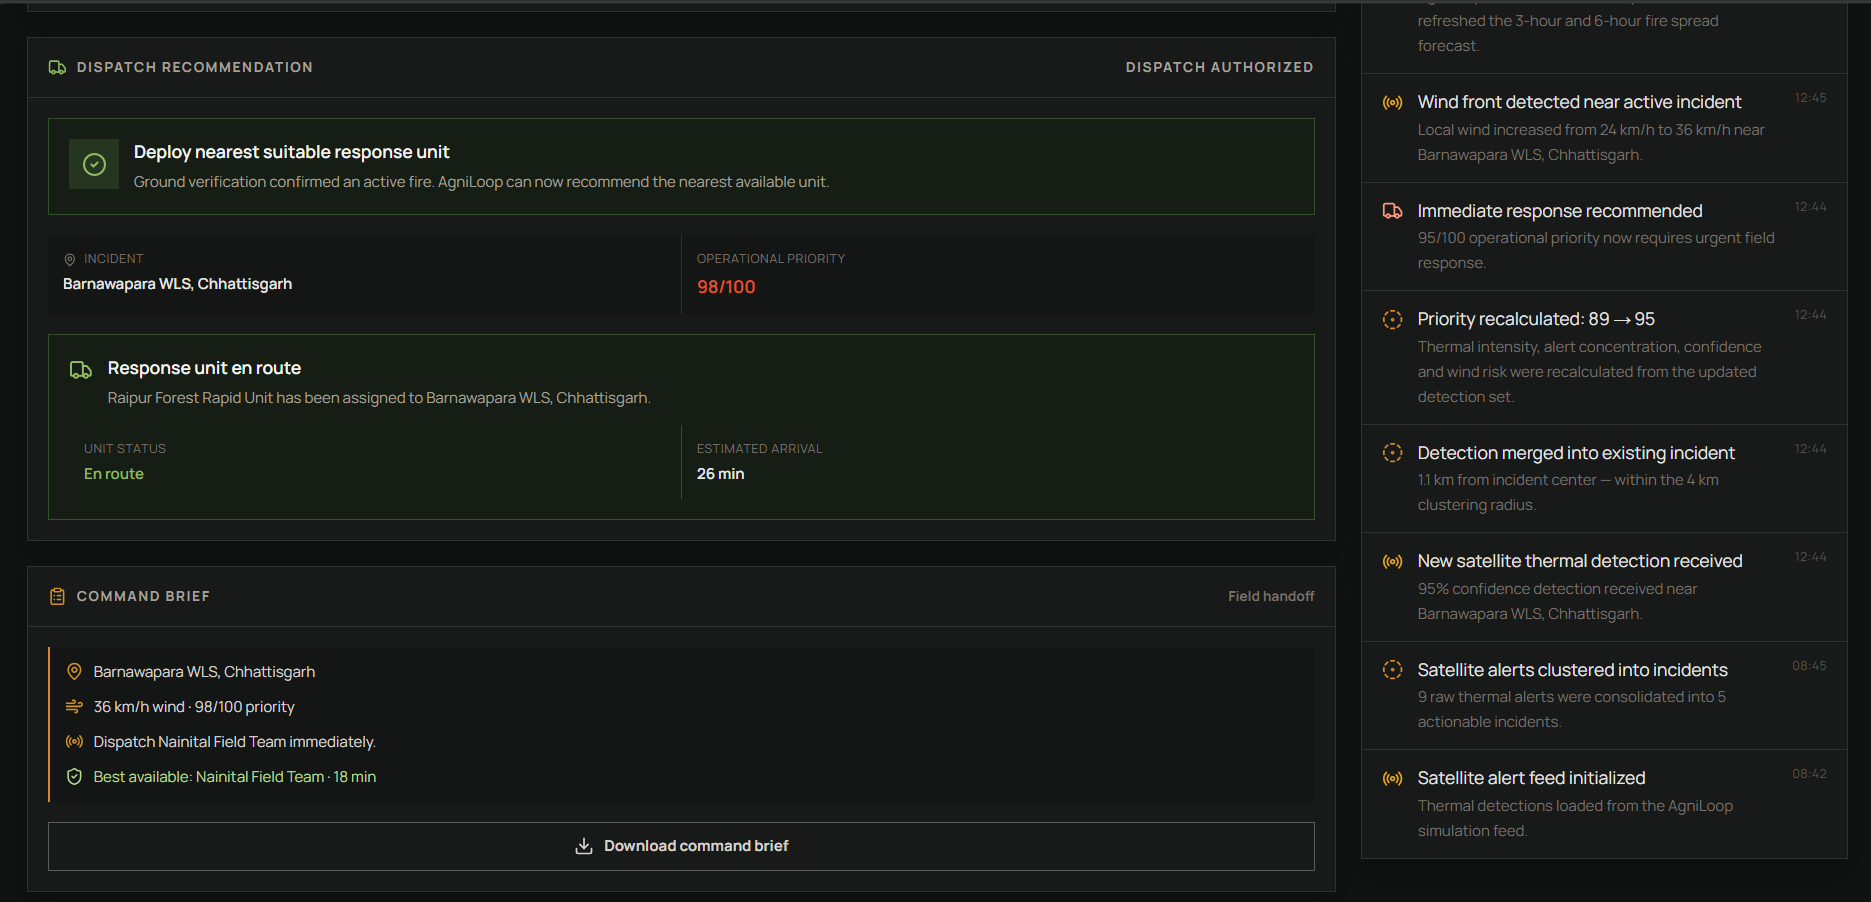
AgniLoop assigns a suitable response unit and tracks its estimated arrival.
-
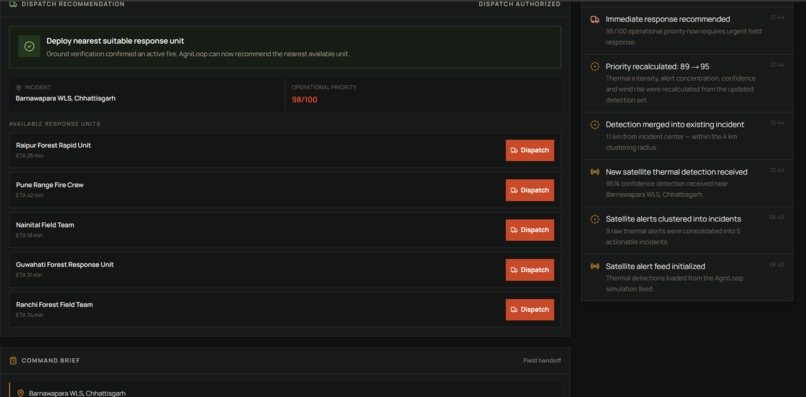
Scenario based fire spread estimates using current wind and incident conditions.
-
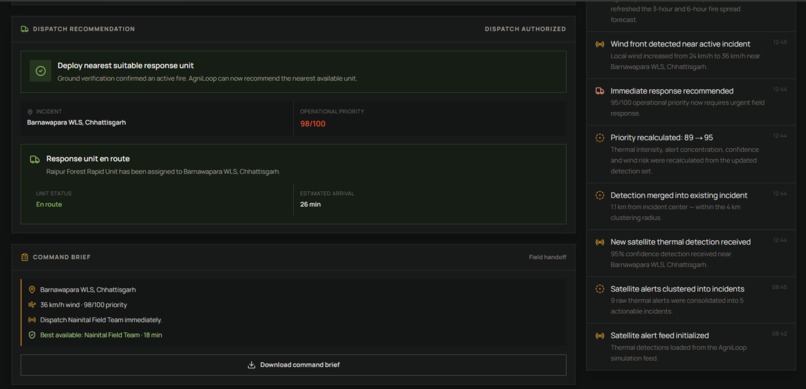
Operational timeline records detections, recalculations, verification, and response events.
-
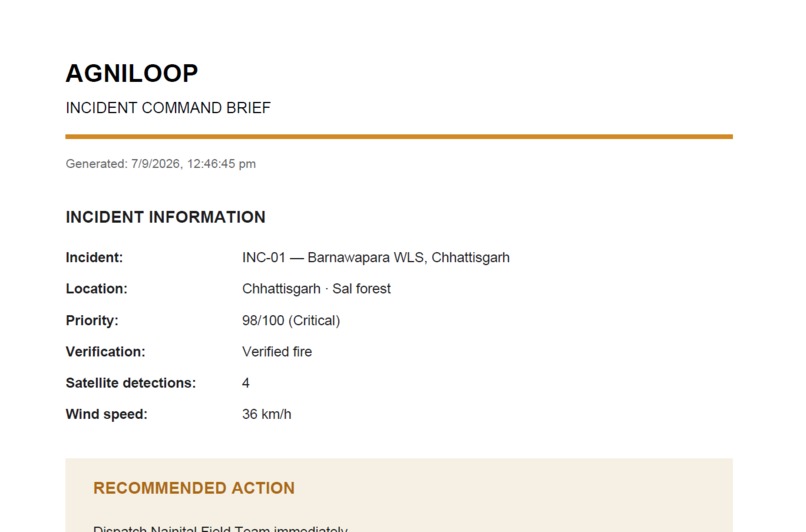
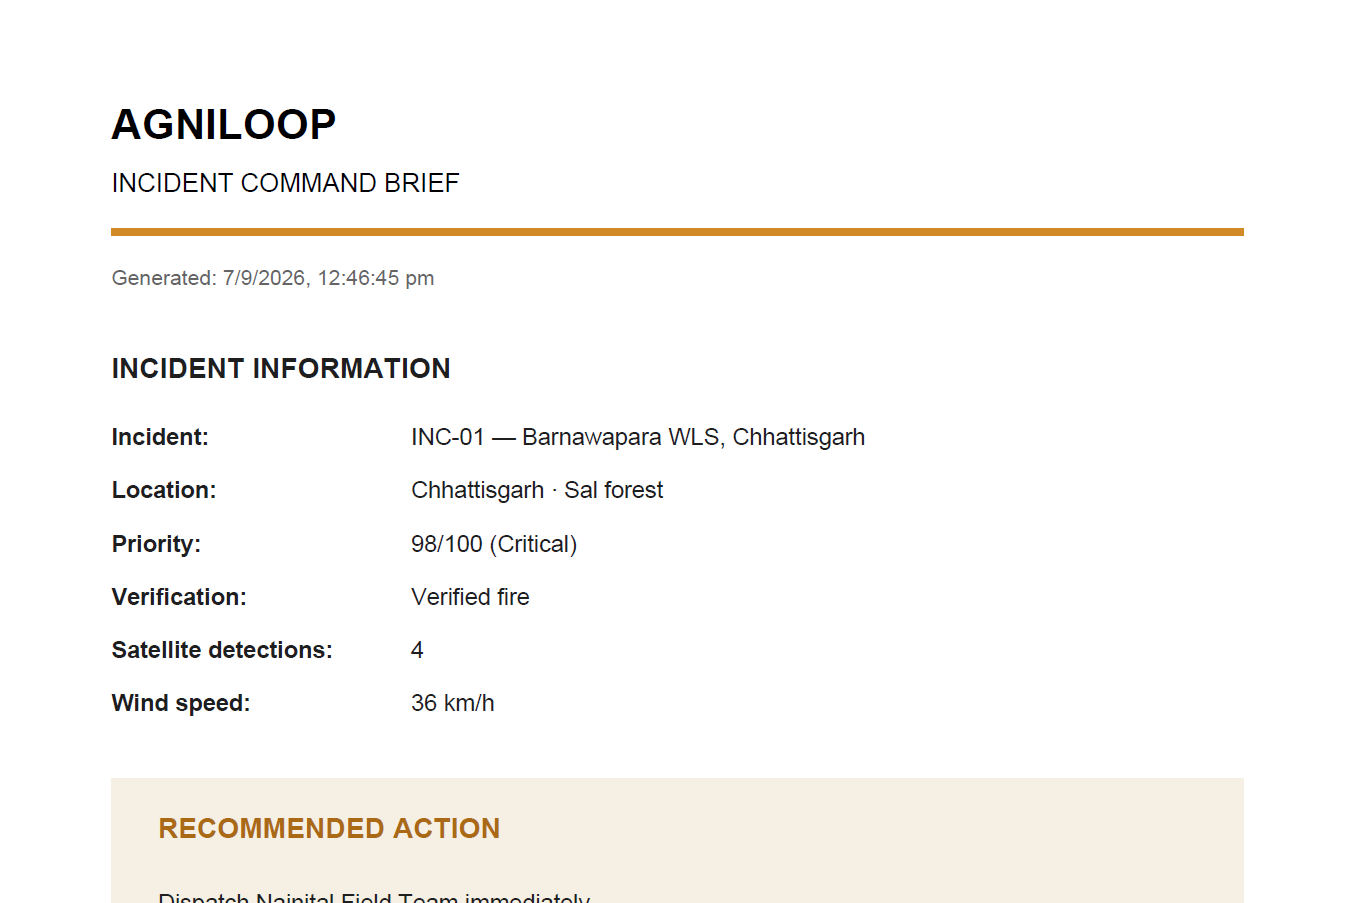
A field-ready command brief summarizes the incident and recommended action.
Inspiration
Wildfires can generate many alerts across large forest regions, but detecting a hotspot is only the beginning. The harder problem is deciding which incident needs attention first, whether the alert is actually a fire, and where limited response resources should go.
I wanted to build something that focused on this decision-making gap instead of creating another dashboard that simply displays fire locations.
That led me to AgniLoop - a forest fire operations console designed to turn scattered satellite fire alerts into clear, actionable response decisions.
What it does
AgniLoop follows a simple operational workflow:
Detect -> Analyze -> Verify -> Dispatch
It starts with simulated satellite thermal detections and clusters nearby alerts into operational incidents.
Each incident receives an explainable priority score based on:
- Thermal intensity
- Alert concentration
- Satellite confidence
- Wind spread risk
The system deliberately separates environmental priority from the actual operational decision.
A high-priority satellite alert is not automatically treated as a confirmed fire. Before a response is dispatched, the incident goes through ground verification.
If the incident is verified as a fire, AgniLoop recommends an available response unit based on readiness and estimated arrival time. If it is identified as a likely false positive, the incident can remain under monitoring instead of triggering an unnecessary deployment.
The result is a connected workflow from detection to field action rather than just another fire map.
How we built it
I built AgniLoop from scratch during the hackathon using React, Vite, JavaScript, Tailwind CSS, React Leaflet, Leaflet, and Lucide React.
The prototype uses simulated satellite thermal alert data so the complete workflow can be demonstrated without depending on an external live satellite feed.
The decision layer combines alert clustering, weighted priority scoring, verification logic, wind risk analysis, incident ranking, and response-unit selection.
The interface is designed as an operational console, with the map, incident intelligence, response queue, verification state, and command workflow connected to the same incident data.
Challenges we ran into
One of the biggest challenges was deciding how to present a large amount of information without making the interface difficult to understand.
A wildfire response system can contain many data points, but an operator should not have to search through several screens to understand what needs to happen next.
I solved this by designing the experience around the actual response process. The interface progressively moves from detection to analysis, verification, and dispatch, while showing the information needed for each decision.
Another challenge was making the priority score understandable. Instead of presenting only a final number, I broke the score into individual factors so an operator can see why an incident received its priority.
Accomplishments that we're proud of
I am most proud of turning the project into a complete decision to action workflow rather than stopping at detection or visualization.
AgniLoop can take multiple thermal detections, group them into incidents, rank them, show the reasoning behind their priority, request verification, change the operational state based on verification, recommend a response unit, and generate a command brief.
I also focused heavily on making the interface feel like an actual operations console rather than a typical hackathon dashboard.
Most importantly, I built the entire project independently during the hackathon, from the interface and map experience to the decision logic and operational workflow.
What we learned
Building AgniLoop taught me that environmental data becomes much more useful when it leads to a clear decision.
I learned how to combine geospatial visualization, data processing, prioritization logic, verification states, and resource allocation into one connected workflow.
I also learned that good product design is not about showing as much information as possible. It is about showing the right information at the moment a decision has to be made.
AgniLoop is a prototype, but its architecture provides a foundation that could later connect to real satellite feeds and operational data sources.
What's next for AgniLoop
The next step for AgniLoop would be connecting the prototype to real satellite fire detection feeds and operational data instead of simulated alerts.
I would also like to make the spread risk model more robust by incorporating real weather and wind data, while keeping the reasoning behind each recommendation visible to the operator.
With real deployments, AgniLoop could eventually support live incident updates, historical incident analysis, better response unit coordination, and integrations with forest and emergency response teams.
The goal is not to build another system that produces more alerts. It is to make those alerts easier to understand, verify, prioritize, and turn into the right action.
Built With
- javascript
- leaflet.js
- lucidereact
- react
- reactleaflet
- tailwindcss
- vite

Log in or sign up for Devpost to join the conversation.