-
-
App Icon
-
-
-
-
-
Logo
-
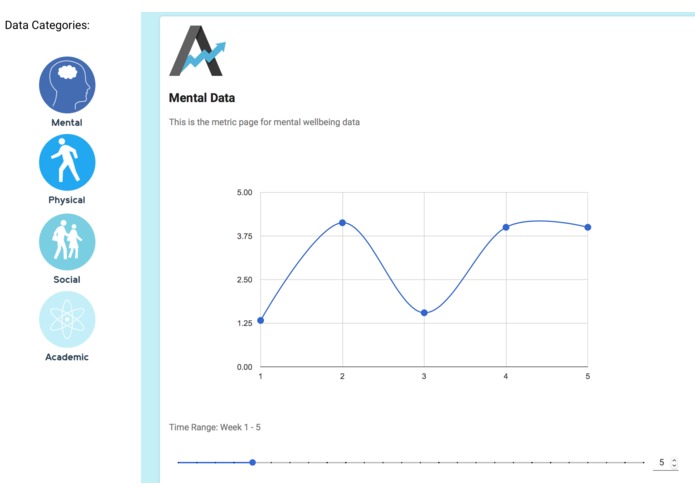
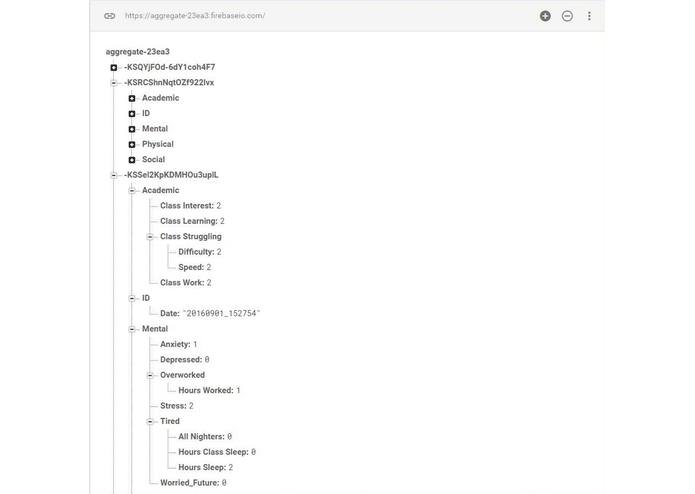
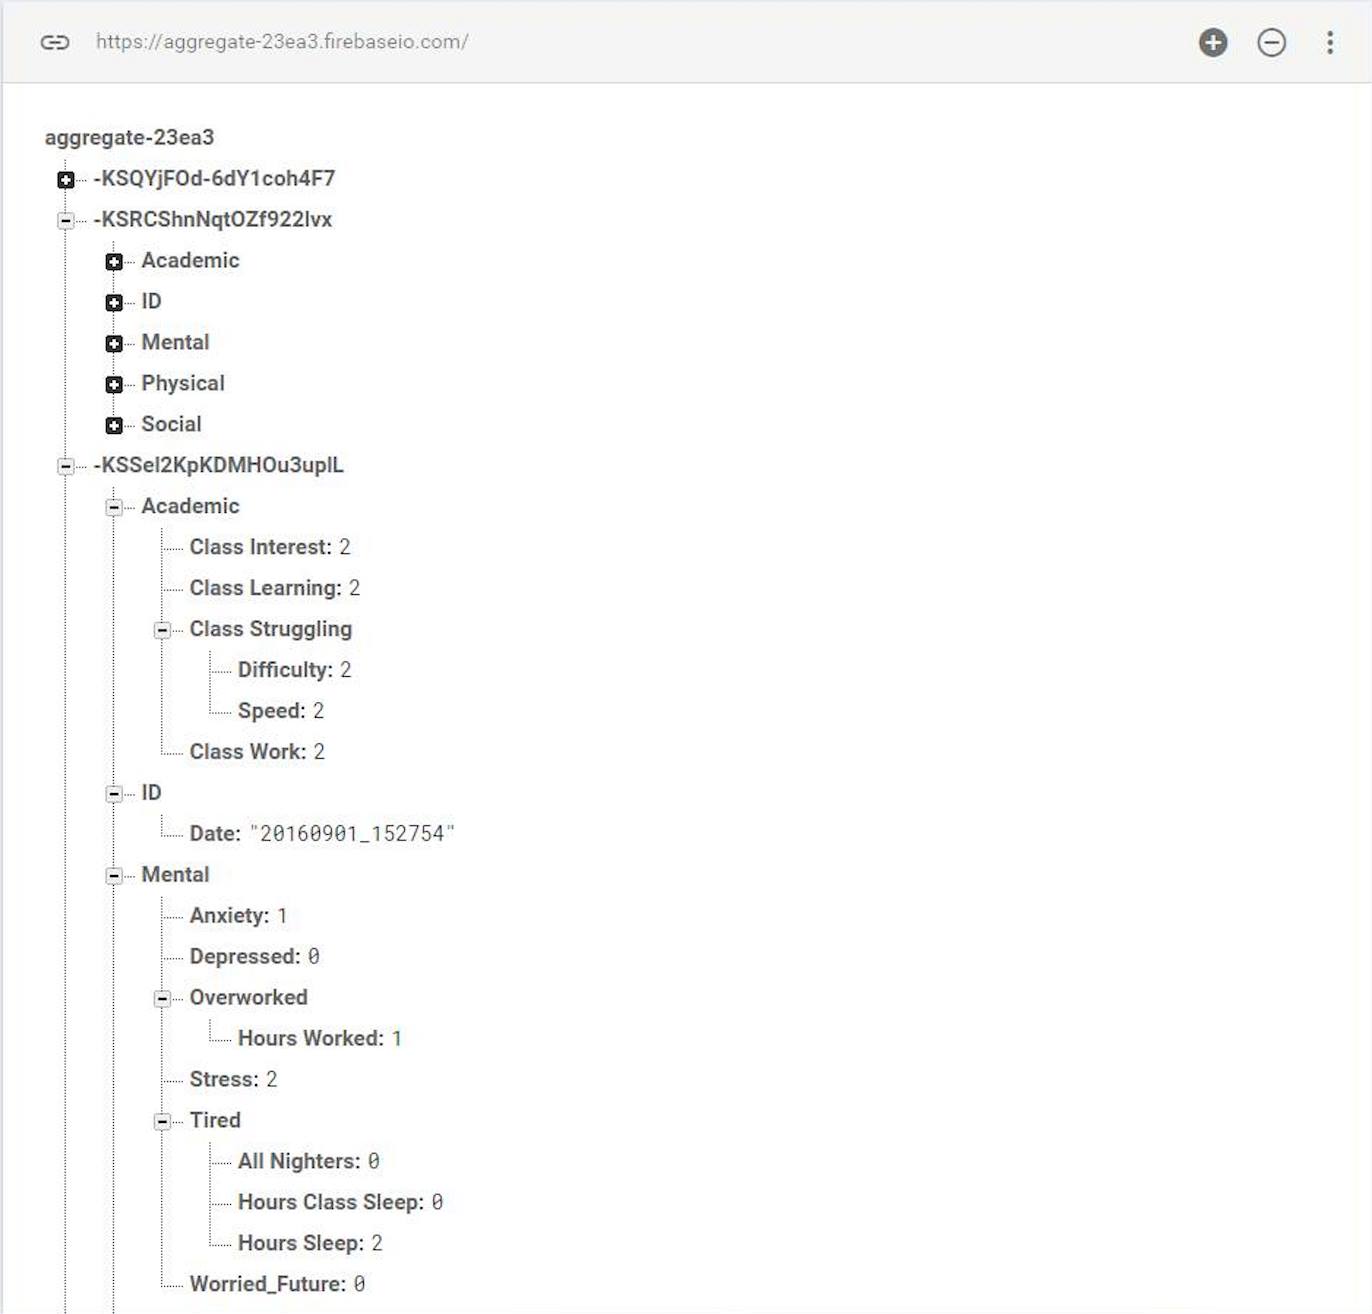
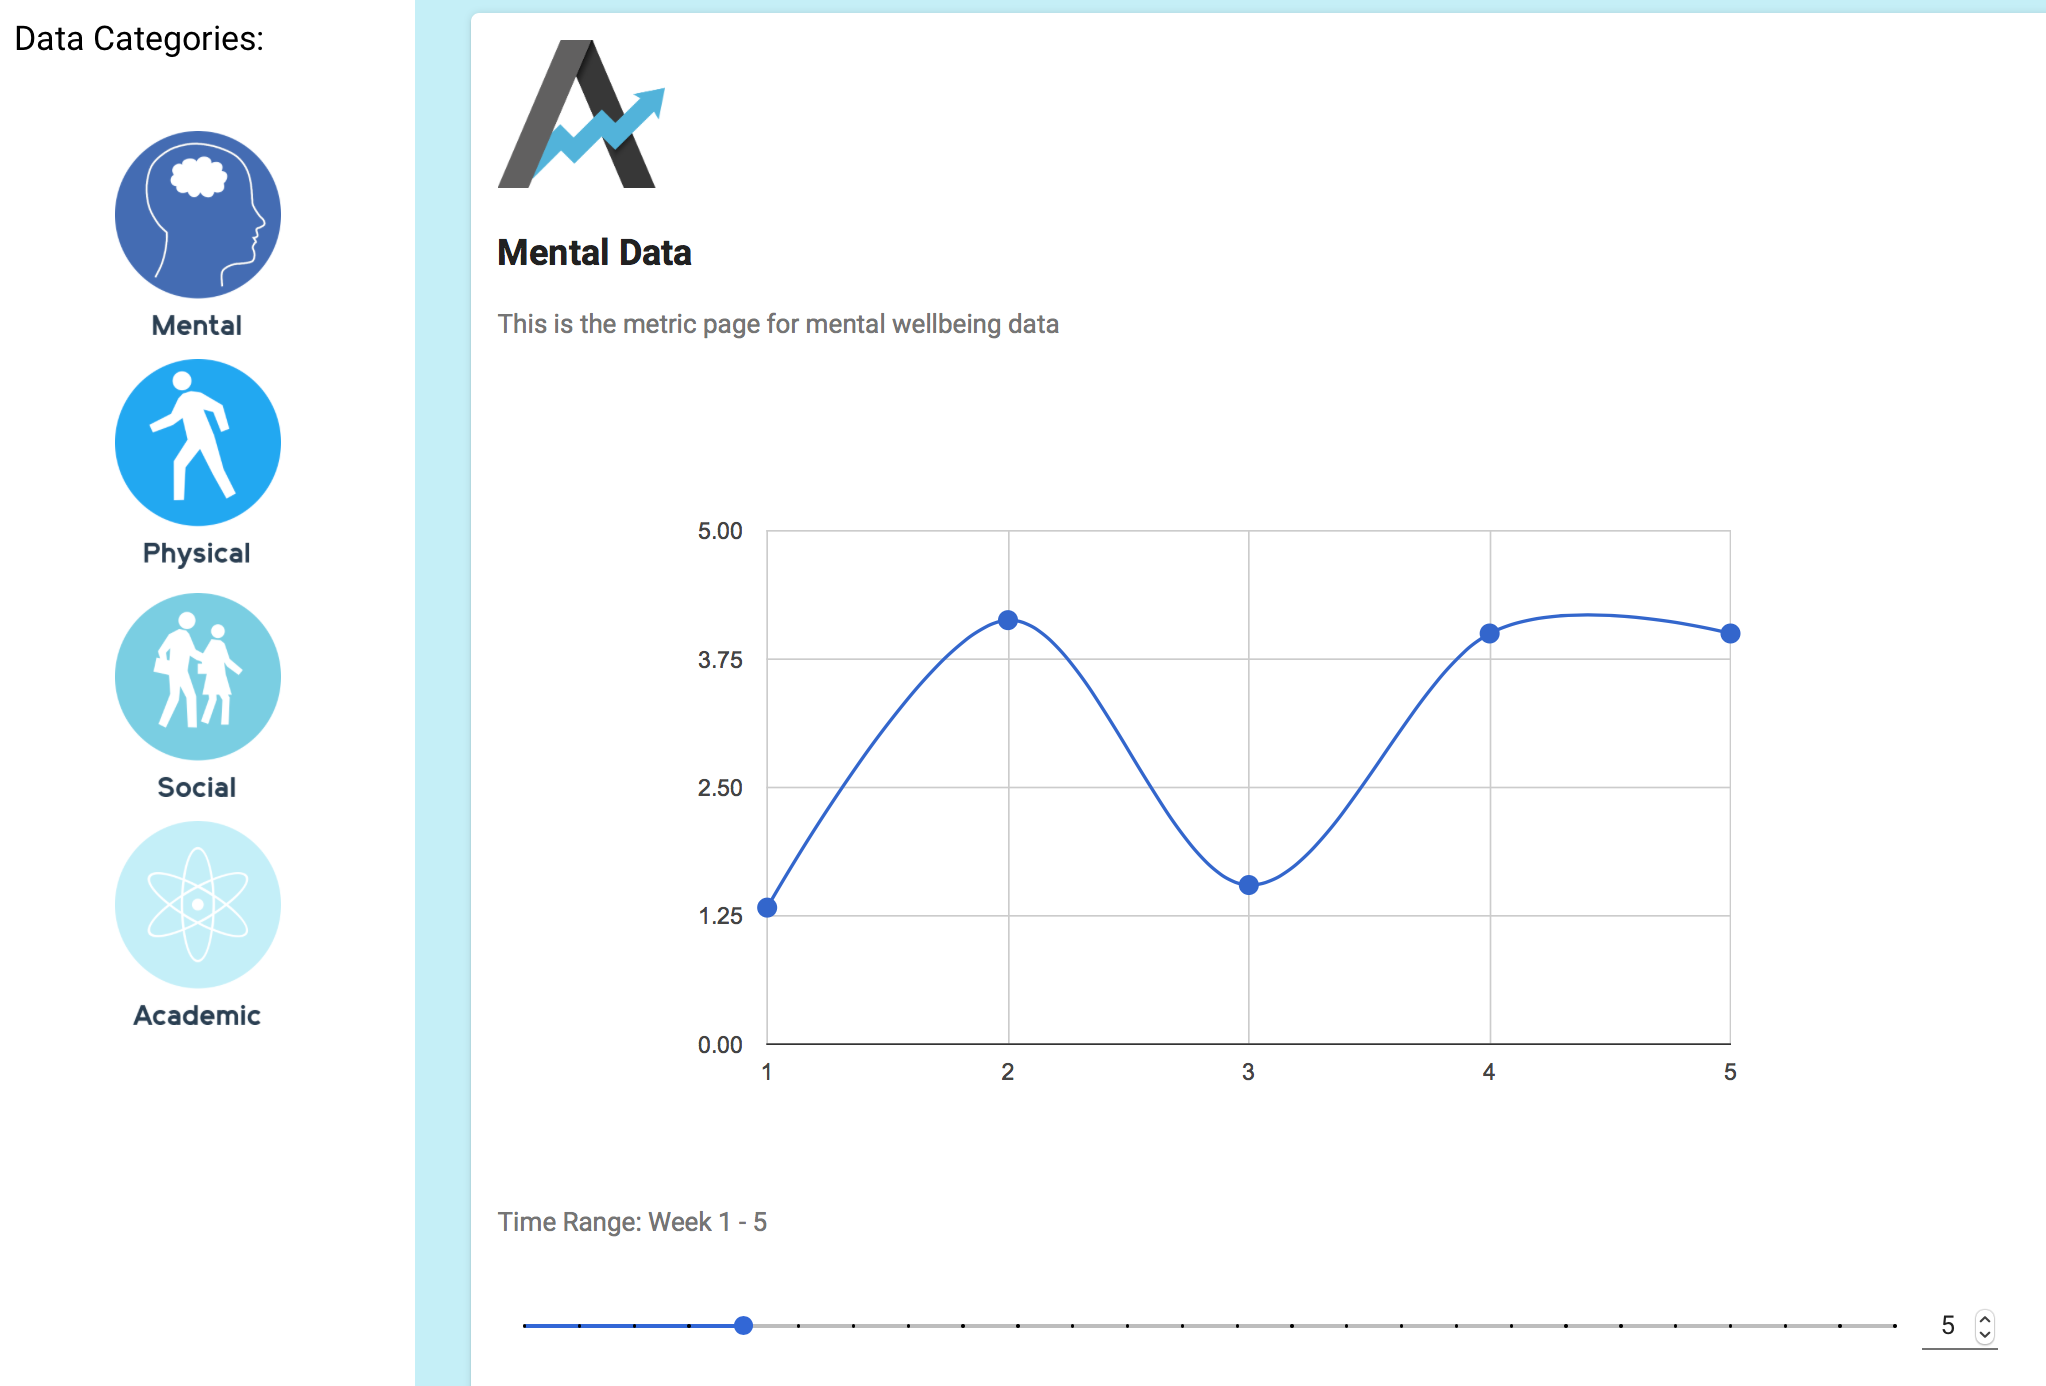
Website graphical analysis
Inspiration
Coming from the high stress, high pressure environments of Carnegie Mellon and Johns Hopkins, we know first hand what effects the rigors of college life can have on people. We sort of know what the effects are, but how does one track and quantify something as fluid as the cause of stress across a large body of people?
We constantly see university organizations trying help students deal with stress—through counseling services and other means of addressing the symptoms, yet we've never encountered a way of seeing what symptoms are being felt over the course of time.
Plenty of people have tried to alleviate the stresses of university life, or life in general, in a number of ways, but nobody has yet created a means of really seeing how a body of people reacts to such treatments long-term, nor is there a way of tracking wellbeing at an organizational level over a long period of time. With such a powerful diagnostic tool, we are hopeful that we can really effect a positive change in the stress cultures at our schools as well as other organizations.
What it does
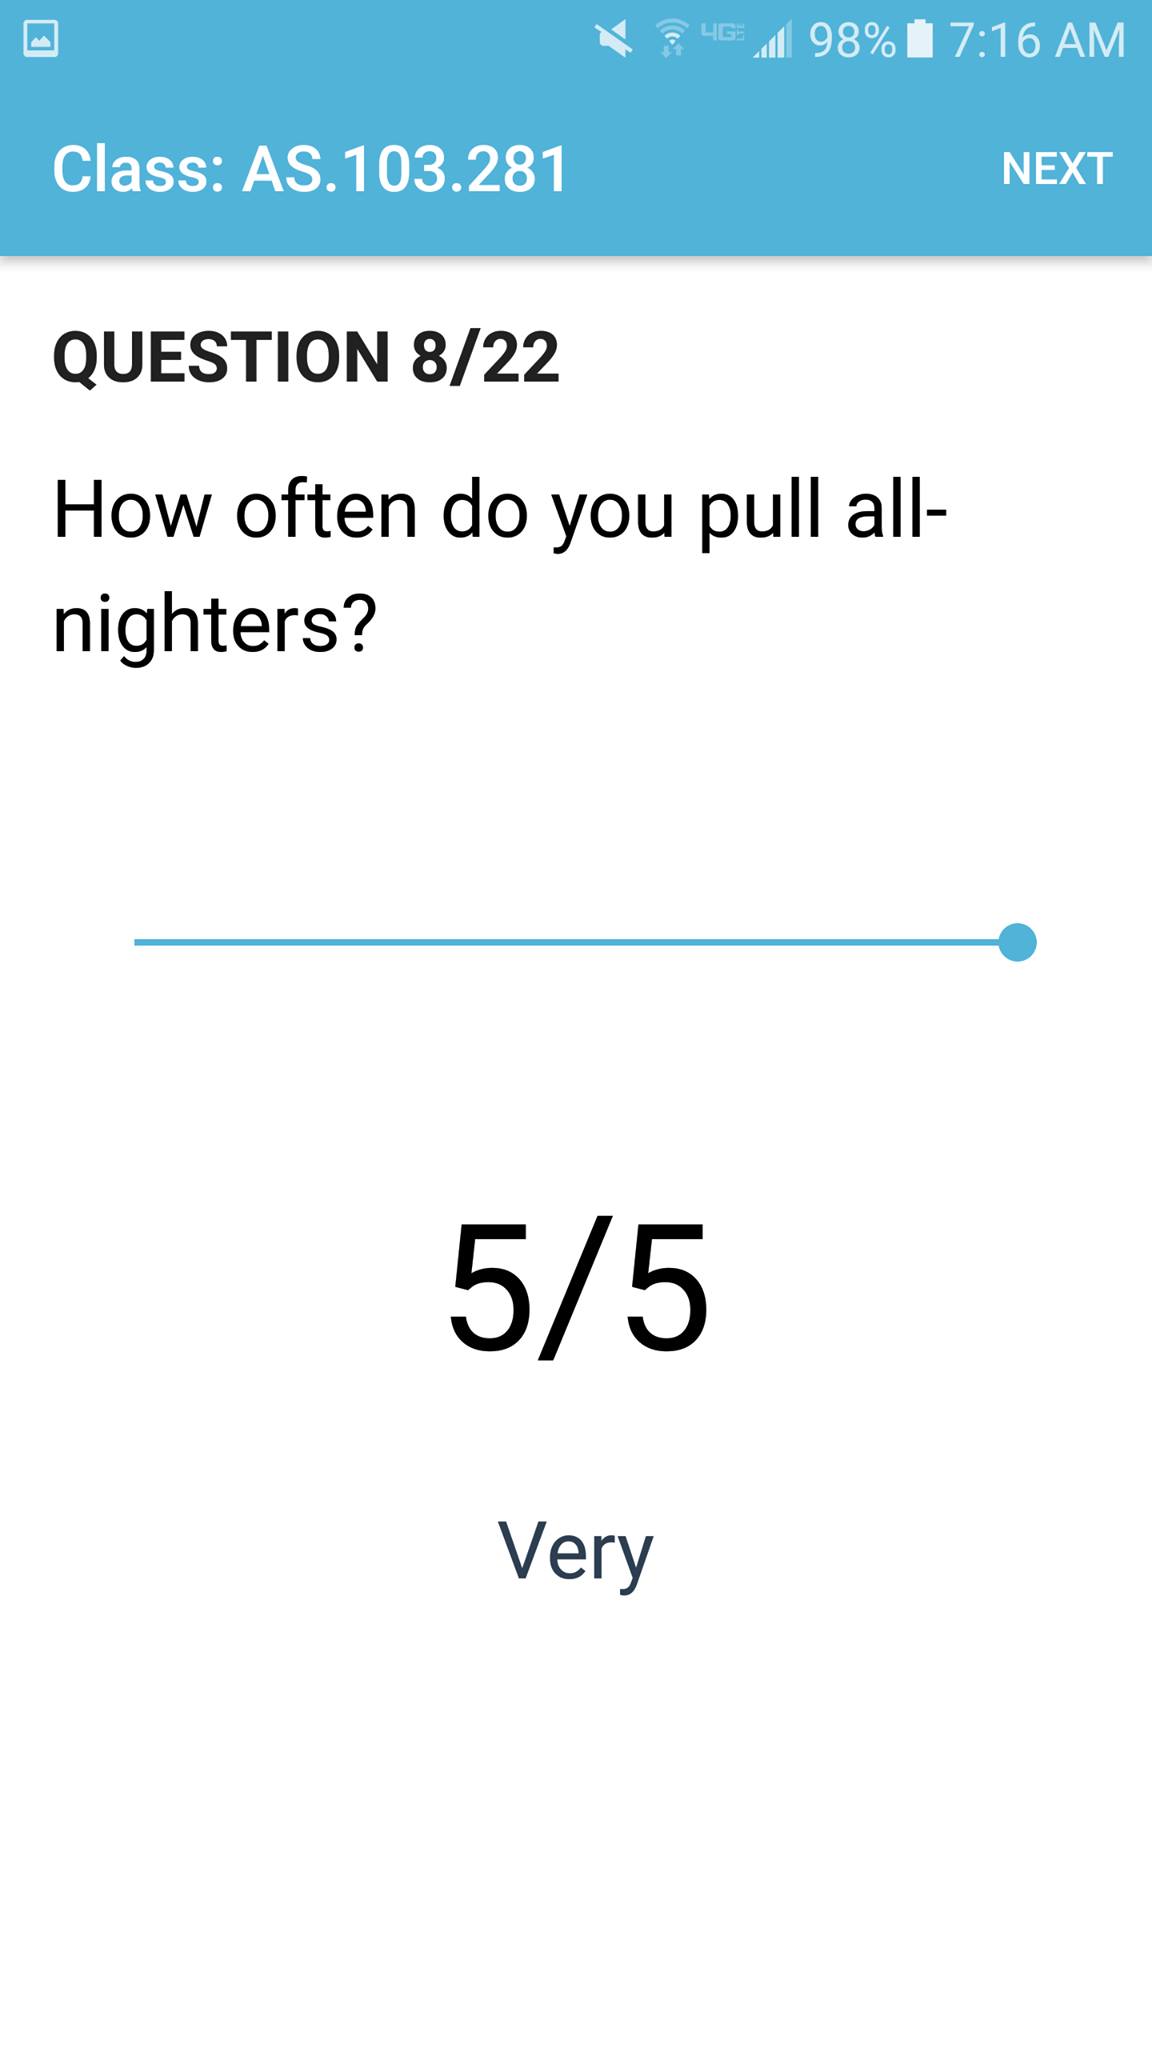
Our idea is simple: take the simple concept of surveys, and expand it to the next level. Instead of having one-off surveys, why not have a constantly stream of feedback—as often as weekly—that can be aggregated and tracked?
We created a feedback system that provides real time analytics on members of organizations by tracking group responses to surveys. Using this data, we establish a base-line of manageable behavior and newly incoming data against it. Thus we are able to identify trends in the mental, physical, social, and academic wellbeing of large bodies of people, mark when and why stress increases or decreases from week to week among them, and pinpoint what people find most troubling at different points in time.
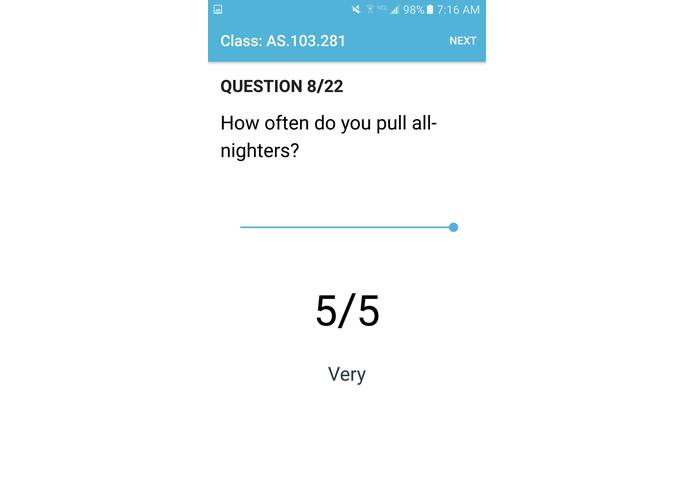
The app has people in an organization anonymously answer pre-designed questions about their environment and quality of life. Based on users' answers, the questions branch into other questions to better taylor surveys to the specific group of people taking them.
Such a powerful tracking and diagnostic tool could be implemented by universities seeking to clarify what causes the most stress and when amongst their student bodies, CEO's wishing to develop better management strategies based off of department or even company-wide trends in wellbeing, and NASA scientists trying to track a space crew's mental and physical responses to different stimuli. The possibilities are endless.
How we built it
We built a full stack infrastructure for our product. First we created an Android mobile app as we found this was the most popular platform for obtaining student data. On this Android mobile app, we created an interactive, customizable user interface. The 100% anonymous responses collected from a student on the app platform are sent to a NoSQL database in JSON format. This data is then accessed by authenticated users on the other end such as university professors and officials, in varying scopes depending on specific need to ensure privacy of student data. For example, a professor would be able to see data and subsequent statistical analysis from his or her classes, while a department head would be able to see data from students in the same department. To allow for such monitoring, we created a website that takes the raw information from our database, organizes it, and displays it in graph form. Administrators of surveys can select specific ranges of time over which to see data, and can inspect specific data point for a more in-depth look. By designing our product around our infrastructure, we ensured that it would be highly scalable to various universities, corporations, and research groups worldwide.
Challenges we ran into
This was the first hackathon for several members of our team, and we encouraged members to develop parts of the stack that they were unfamiliar with. Working with databases, designing apps and websites, and putting all of this together were all firsts. We struggled at a few points with putting each of our parts together, but managed to succeed with version control.
Accomplishments that we're proud of
We are extremely proud to have created an innovative product that can help potentially thousands of people. We hope to use what we've created to make our own college campuses, Carnegie Mellon and Johns Hopkins, into better educational environments. We're very thankful for the opportunity to help improve the lives of our friends.
What we learned
By encouraging members of our team to develop parts of the stack they were unfamiliar with, we helped everyone learn something new while simultaneously having fun doing so. For example, we had members learn about Android apps, responsive web development, backend NoSQL real-time databases, and how to run statistical analysis scripts on data sets.
What's next for Aggregate
Aggregate is currently in prototype phase, where we have created a fully functional project ready for further improvement and scaling. Our next hope is to take our concept to our test market of our own schools, Carnegie Mellon and Johns Hopkins, which are currently exploring solutions to better improve the satisfaction of students by means of creating more responsive environments. Additionally, we would be interested in seeking intellectual patents for our proprietary service and funding to further develop and perfect Aggregate. If our initial test market is successful, we will explore similar university audiences and potentially scale to large corporations around the nation. Overall, we hope to make the world a better place with Aggregate.


Log in or sign up for Devpost to join the conversation.