-
-

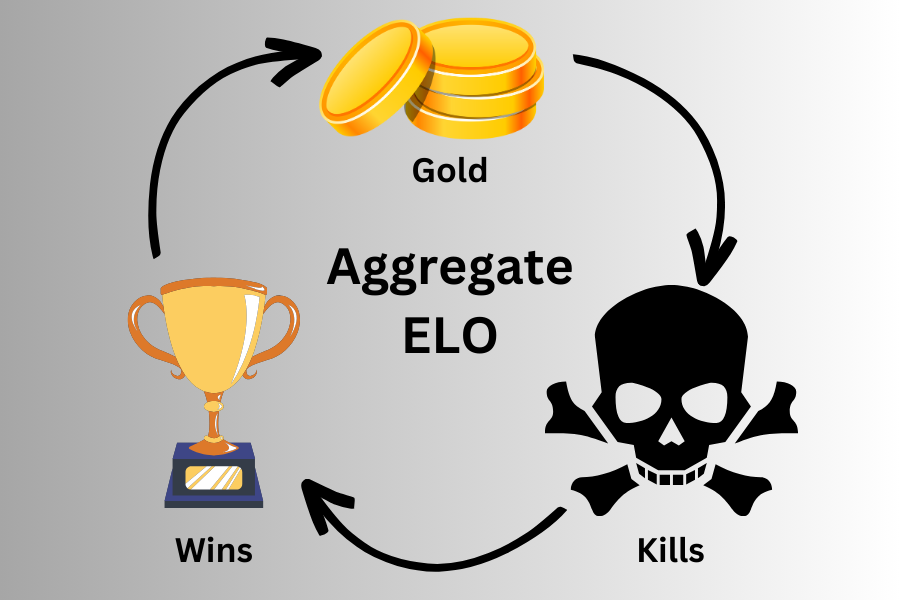
Title/Logo
-
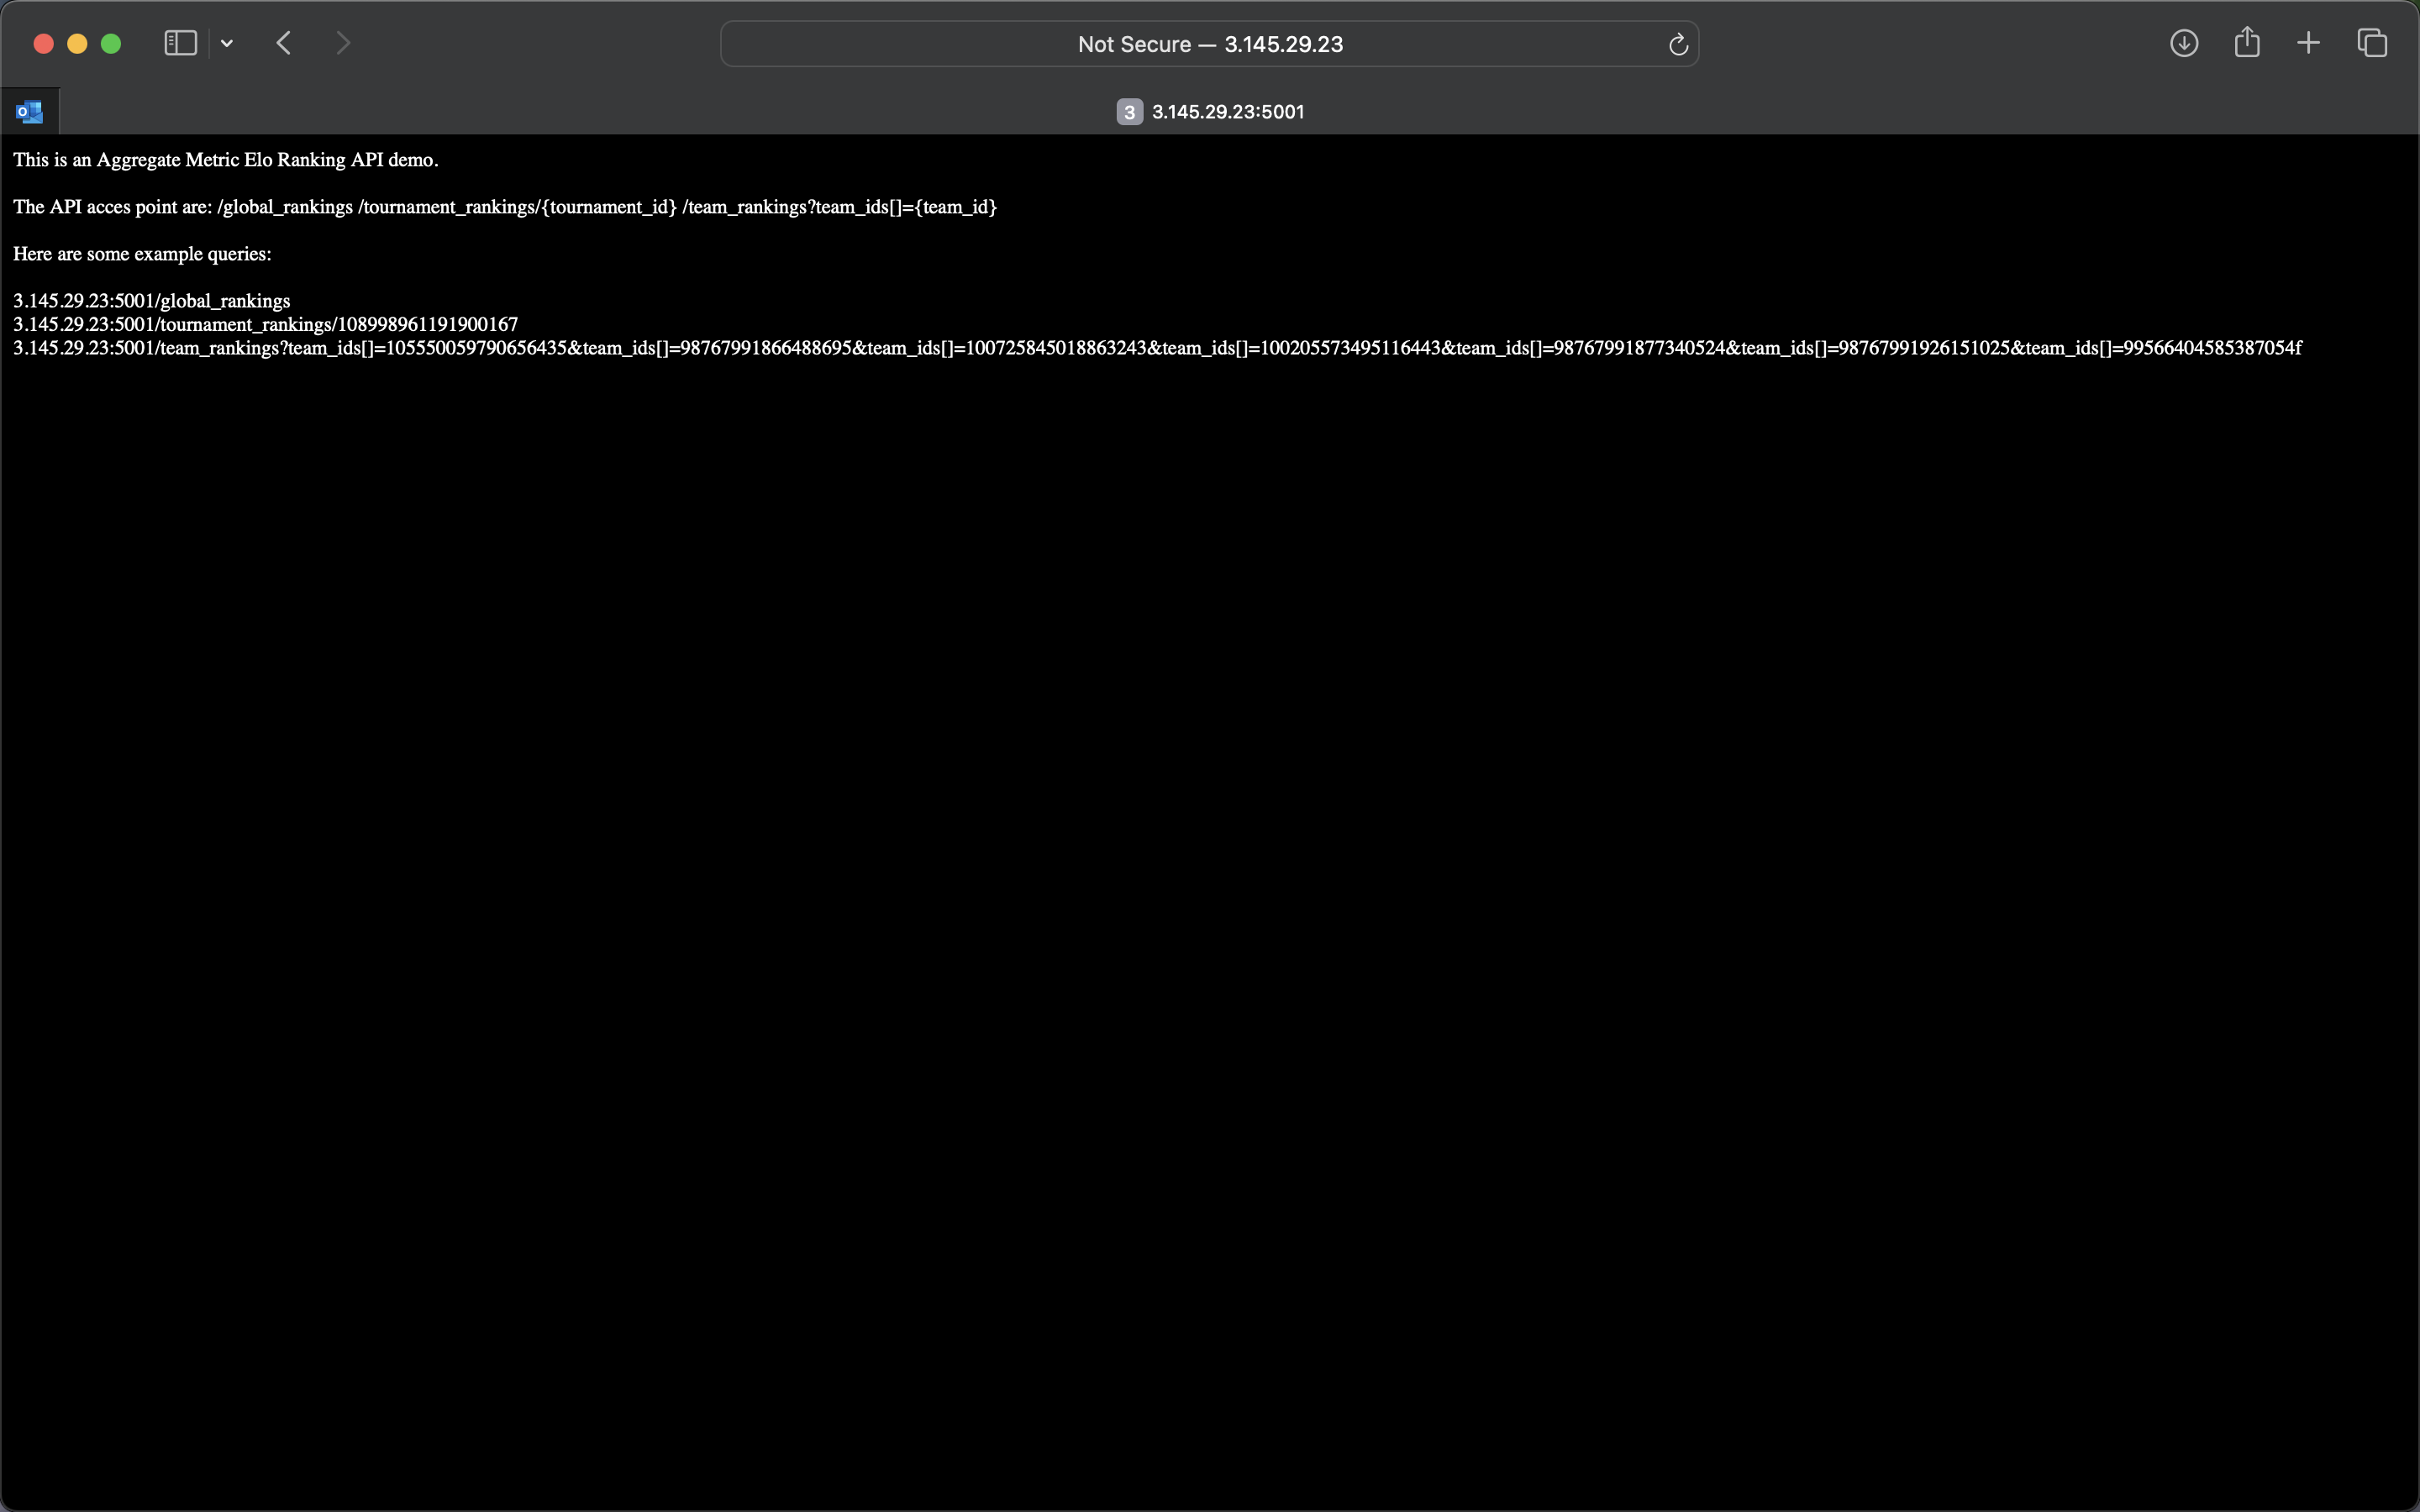
API visualized
-
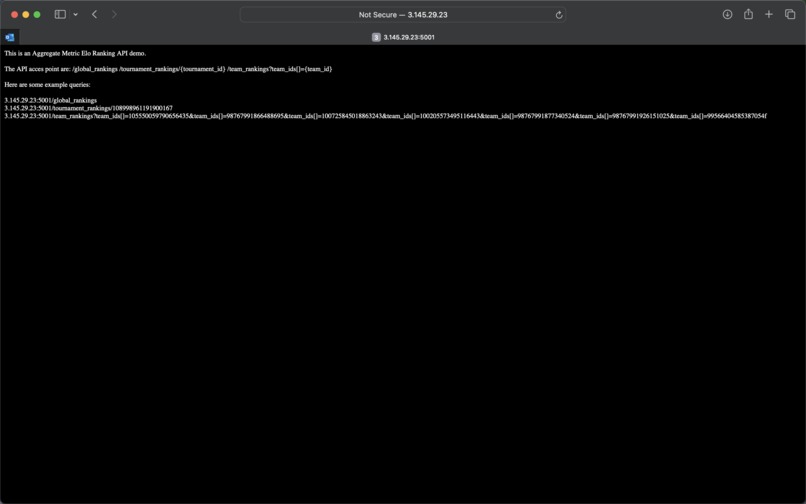
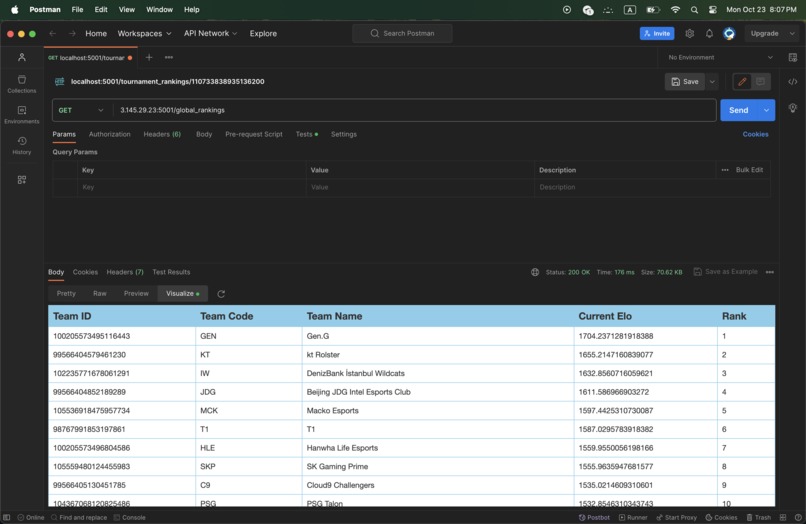
Site Homepage

Inspiration
The Elo system is a common method of ranking teams. They take expected outcomes and give or take Elo based on the difference between expected and resulting outcomes. They have a crucial problem though. They don't take into account how close or how much of a blowout matches end up being. In the eyes of the standard Elo ranking system, a win is 1 and a loss is 0. There is no in-between. We sought to rectify this issue by including metrics besides wins and losses in our calculations. We decided to take into account two additional metrics, the difference in total gold spent and the difference in kills. By using these additional metrics we can help add clarity and perfect the results of the standard win/loss Elo calculation.
What it does
Aggregate Metric Elo first calculates the standard Elo for all teams. This is the win/loss Elo. It does this by taking the tournament data provided by Riot and first sorting it. After this, it goes through and calculates the standard (win/loss) Elo for each team, while keeping a history that includes tournament IDs. To calculate the Elo we used the following formula that is consistent throughout our three Elo calculations.

Where c and k are constants (we tweaked these numbers to provide optimal results) and metricOutcome_a is the outcome of metric in the perspective of team a. (number between 0-1) and metricElo_a is the current Elo of team a.
After the standard Elo is calculated we move on to the two additional metrics. To calculate the two metric Elos for every team, we must first download the game data. To do this we first accessed the last twenty games of each team from the history of our standard Elo calculation and put their game IDs in a JSON object. Then we created the "gamedatapull.js" script. This script uses the IDs specified early and downloads the game corresponding to that ID. It then pulls the necessary metric data needed for our two metric Elo calculations (the last gold spent and kills statistics for each team). Once the data is pulled we delete the file and move on to the next game. Our output is an array of JSON objects that list the game ID, team IDs, and the metrics pulled.
Once we have this, we repurpose our standard Elo calculation script for our new metric Elo calculation. To calculate our metric Elo, our metric data must be between 0 and 1. To do this we divided the differences in the metric (gold or kills) by the larger team metric (if Team A had 3 kills and Team B had 2 kills, we would do 1/3). Then this number would be raised to a power between 0-1 to further spread the metric between 0 and 1. We then run the data through our Elo calculation just as we did for the standard win/loss Elo. At the end of doing this for both metrics as well as the win/loss metric, we have three .json files that include the Elos of each team based on the three different Elo calculations.
To combine the three Elos we took a percentage of each Elo calculation and added that to the final Elo. The final Elo is made up of 13% of goldSpent Elo, 20% of kills Elo, and 77% of standard win/loss Elo. In the end, we are left with an array of JSON objects that include current Elo and historical Elo based on given tournament IDs.
How we built it
We started the planning stage by downloading and looking through files provided by Riot on the S3 Bucket. We looked through every available metric that could be statistically significant. After going over them we wrote down the most important ones for later use. Thinking about we could combine all of these we chose to use the Elo formulas. We wrote down the pure mathematical representations of the Elo equations and came up with a way to scale the expected outcomes of a match for each metric between 0 and 1 on the whiteboard.
We separated the algorithm into two unrelated parts: the server and the Elo generation part. After that, we mind-mapped the general algorithm and broke down each major step into smaller ones, until we could write the algorithm in pseudo-code. We intentionally chose to separate extracting the data points from games and the Elo generation to be able to tweak the purely mathematical "magic" numbers in the Elo generation without having to rerun the time-consuming game data extraction. We implemented and tested each part of the algorithm by itself and then combined them into two. Running the metric extractions and Elo generation algorithms took 12+ hours. We tweaked the Elo constants a few times to better the output of the algorithm and after being happy with the results moved on to the server which was fairly easy and didn't take much time.
Challenges we ran into
Downloading the immense amount of game data was certainly a challenge. Our game-downloading script ran for over 12 hours.
Getting our additional metrics into values between 0-1.
Mapping platform IDs to game IDs and vice versa.
Accomplishments that we're proud of
We are very proud of our idea and its results. When coming up with a ranking method, we were not satisfied with the standards Elo calculation method. We wanted to do something unique and new. We posed the question why can't we use other metrics to calculate Elo other than wins and losses. So we decided to look at metrics that might give more insight into the game other than wins and losses. We wanted to reward close losses and also punish crushing defeats. By using the difference in gold spent and the difference in kills, we give our rankings an insight into games beyond just wins and losses. Our method takes into account how close matches are and we are proud of that. As a result, we believe that our rankings are more robust and accurate than standard Elo rankings.
What we learned
Running the download script on wifi was very time-consuming. If we were to do it over again we probably would try to download over ethernet if possible.
There are many aspects of a League of Legends game that factor into deciding its outcome. What we mean by that is the strength of the schedule as well as the region of the team are vitally important to the overall ranking of the team. LoL esports are unique in that way, making the sport much harder to provide rankings on.
What's next for Aggregate Metric Elo Ranking
With more time we would love to provide a more flushed-out UI/UX for users. Providing a more intractable site with links to historical Elo graphs for each team is something we anticipate providing. As of right now, only two additional metrics are included in the final Elo. In the future, we could add more metrics: difference in damage dealt, difference in forest farming, as well as expected tournament wins. In the future, we can also take into account the regions of teams.


Log in or sign up for Devpost to join the conversation.