Inspiration
Debugging AI agents can be difficult when a tool is called repeatedly or an execution fails. Logs may show what happened, but developers still need to identify the events that matter and understand what the evidence actually supports.
I built AgentTrace Doctor to explore a more transparent approach to debugging: instead of asking an AI model to guess the cause, the tool identifies specific patterns and links every finding to the events that triggered it.
What It Does
AgentTrace Doctor is a browser-based debugging tool for AI-agent execution traces.
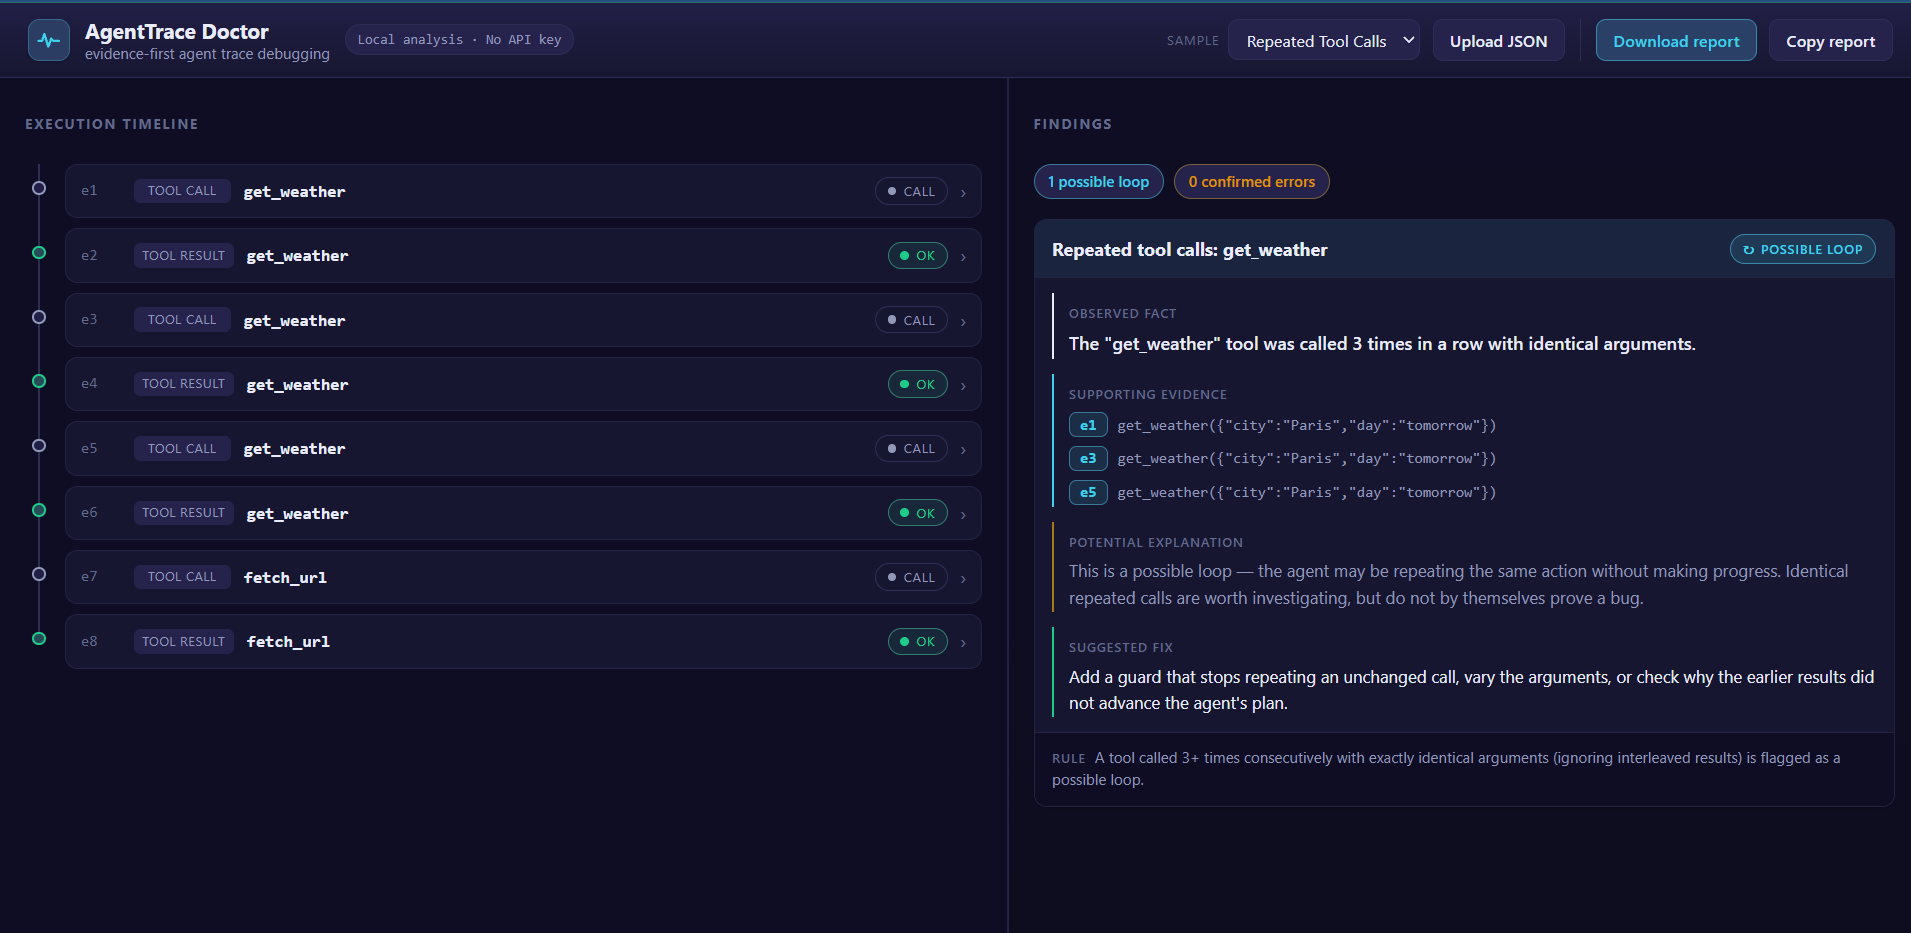
- Detect possible loops: Identifies when the same tool is called at least three consecutive times with identical arguments, ignoring interleaved tool-result events.
- Identify explicit errors: Flags tool results that explicitly report an error.
- Show supporting evidence: Connects findings to the exact events in an interactive execution timeline.
- Explain findings clearly: Separates observed facts, supporting evidence, potential explanations, and suggested fixes.
- Validate uploaded traces: Accepts JSON traces in its documented format and provides readable validation errors.
- Export reports: Generates Markdown debugging reports that can be downloaded or copied.
The application includes three sample traces: Repeated Tool Calls, Tool Failure, and Clean Run. It works locally in the browser without an API key, backend, or LLM-based diagnosis.
An important design principle is that a repeated tool call is a possible loop, not automatically a confirmed bug. Likewise, finding no issues means the implemented rules found no problems; it does not guarantee that an execution is correct.
How I Built It
I used Kiro with the Devpost Learn Skill Pack to follow a structured, plan-first development process.
I created a scope, product requirements document, and technical specification before implementing the application in incremental slices.
The application uses React, TypeScript, and Vite, with Zod for runtime validation and TypeScript type inference. The trace-processing pipeline parses JSON, validates the schema, normalizes events and arguments, runs deterministic detectors, and renders the resulting findings.
I used Vitest to test the processing functions independently, including repeated-call thresholds, argument normalization, error detection, event linking, validation failures, and report generation.
Challenges
One of the main challenges was distinguishing reliable observations from uncertain interpretations. Repeated calls can sometimes be legitimate retries, so the tool reports a possible loop rather than claiming a failure.
Another challenge was making the diagnosis reproducible. Argument normalization must treat different object-key orders consistently while preserving array order and all argument values. Tool-result references also need to be handled safely, even when a referenced call cannot be found.
I addressed these challenges through explicit rules, small independent functions, and focused automated tests. I also made invalid uploads non-destructive so a rejected trace does not replace the user's current valid trace.
What I Learned
This project helped me practice directing an AI coding agent through a complete workflow: defining scope, writing requirements, specifying the architecture, implementing small increments, and verifying the result with tests.
I learned the value of turning product decisions into measurable acceptance criteria before writing code. That made it easier to review generated code, detect regressions, and keep the implementation aligned with the original idea.
AgentTrace Doctor is a proof of concept, but it demonstrates the approach I wanted to explore: debugging tools should make their evidence visible and their limitations explicit.
Built With
- css
- devpost
- kiro
- learn
- pnpm
- react
- skill
- typescript
- vite
- vitest
- zod


Log in or sign up for Devpost to join the conversation.