-
-
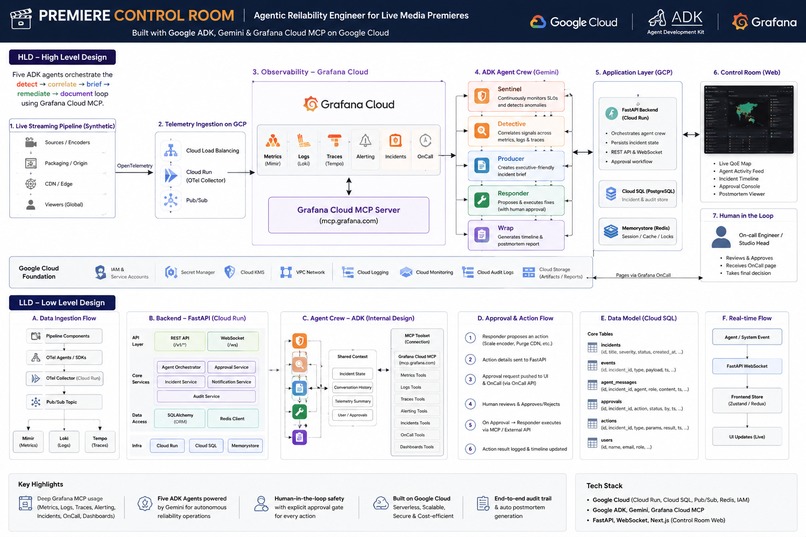
HLD
-
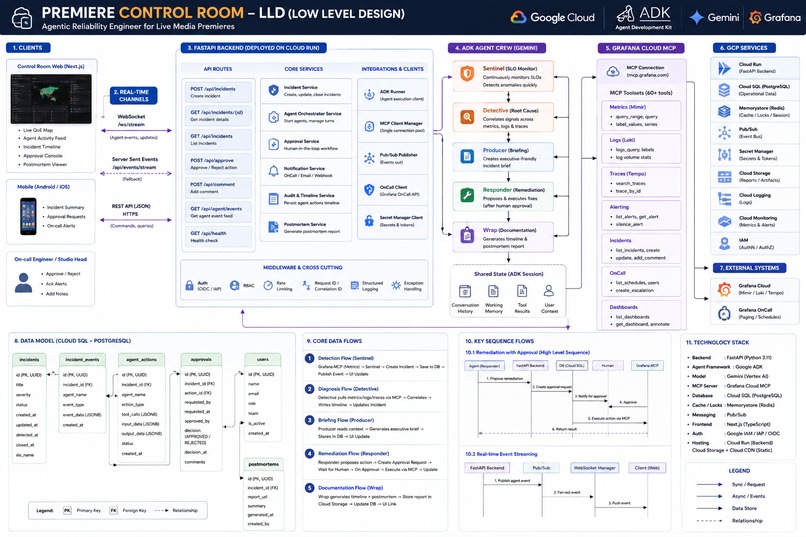
LLD
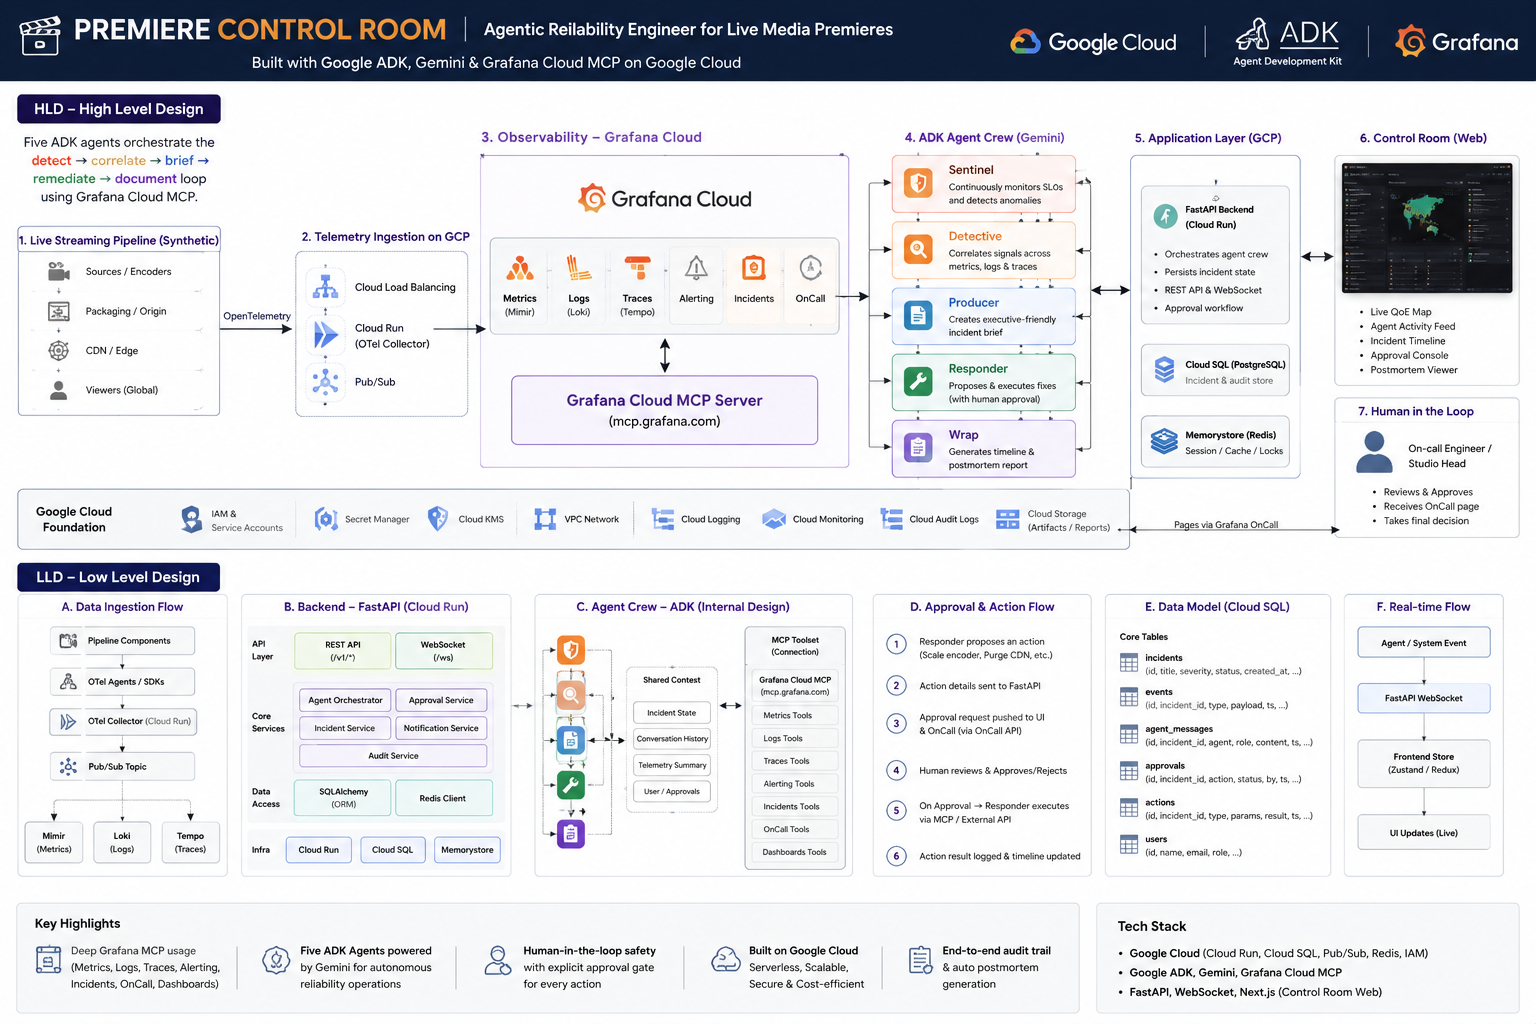
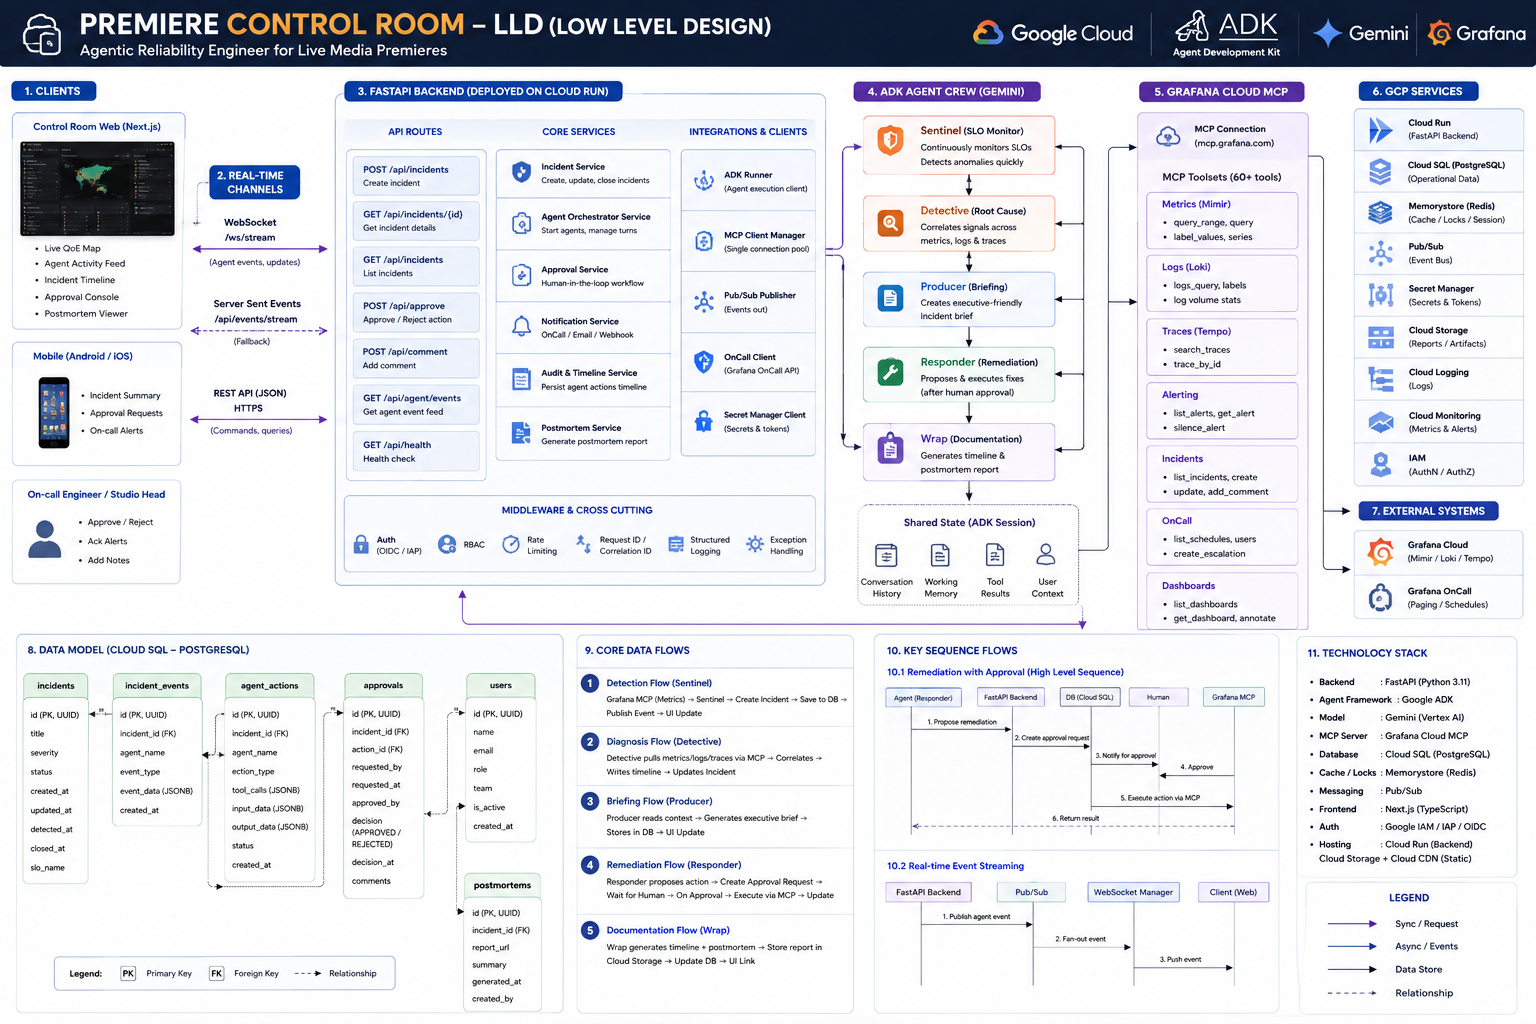
Track
Agentic Cinema - The Blockbuster Hackathon, Grafana Labs partner track
Inspiration
A global streaming premiere, an awards show, a live sports simulcast - these are events that happen exactly once. When the CDN edge overloads, an encoder saturates, or origin latency spikes during the first ten minutes of a season finale, there's no "re-airing" it. Today the response to that is almost entirely manual: an on-call engineer stares at a wall of Grafana dashboards, greps logs by hand, correlates traces, and pages people ad hoc - and every minute of that triage is a minute of buffering for millions of fans watching live.
We wanted to see whether a crew of cooperating agents, each with a narrow and well-defined job, could compress that manual loop from minutes to seconds - without removing the human from decisions that actually matter.
What it does
Premiere Control Room is a crew of five Google ADK agents - Sentinel, Detective, Producer, Responder, and Wrap - that share one Grafana Cloud MCP connection and automate the full incident lifecycle:
- Sentinel continuously watches SLOs (rebuffer ratio, playback failure rate, origin error rate, encoder queue depth) and detects a breach.
- Detective correlates metrics, logs, and traces through Grafana's MCP tools to build a root-cause hypothesis - and checks a memory of past incidents with the same breaching metric before committing to one.
- Producer turns that finding into an executive-readable incident brief and opens a real Grafana Incident.
- Responder selects a remediation from a risk-tiered playbook (scale encoder capacity, purge CDN cache, roll back a bad deploy, fail over a region). Low-risk actions execute immediately; high-risk actions are structurally forced to stop and wait for a human to click Approve - the LLM cannot talk its way past this gate, because the tool call itself blocks on a real async future until a human resolves it.
- Wrap generates a timeline and a markdown postmortem, downloadable straight from the UI.
Every step streams live over WebSocket to a real-time "control room" dashboard, where operators watch the crew work, approve or reject pending actions, and review a searchable incident history with MTTR and breach-frequency analytics - including real Gemini token usage and estimated cost per incident.
It ships two ways to run: a deterministic mock crew (zero external credentials, fully exercises every code path including the approval gate) for anyone evaluating the repo cold, and the real crew - real Gemini via Vertex AI, real Grafana Cloud MCP tool calls, real remediation writes back into Grafana Incidents/Alerting/Annotations - one env var flip away.
How we built it
- Agent layer: five
google.adk.agents.Agentinstances sharing oneMcpToolsetconnected to a Grafana Cloud MCP server. High-risk approvals use ADK's forced function-calling mode (FunctionCallingConfigMode.ANY) so the model must callrequest_human_approvalrather than narrate a decision - the tool itself awaits a realasyncio.Futurethat only an authenticated operator's API call resolves. - Grafana MCP, the real way: the hosted
mcp.grafana.comendpoint only supports interactive browser OAuth, which doesn't work for an unattended backend - so we deploy the open-sourcegrafana/mcp-grafanaserver as its own token-authenticated Cloud Run service instead, and wire it into the crew automatically. As a side effect, the crew's own OpenTelemetry instrumentation (every LLM call, every MCP tool call) rides the same OTLP pipeline straight into Grafana Cloud's AI Observability app - you can watch the agents think, for free. - Backend: FastAPI + Pydantic v2 orchestrating the crew and broadcasting every step over a WebSocket connection manager built to handle several incidents running concurrently without one clobbering another's status.
- Persistence, deliberately split in two: incidents, agent events, remediation actions, postmortems, and token usage - the schema-less, high-write, agent-authored timeline - live in Firestore. Users, the audit log, and workspaces - where relational constraints and audit queries actually matter - stay on SQL (SQLite locally, Postgres/Cloud SQL in production).
- Auth & governance: JWT-based auth with a viewer < operator < admin role hierarchy, a full audit log of every sensitive action (including the real authenticated approver's identity on a remediation, not whatever the LLM's structured output happened to claim), and lightweight multi-workspace tenancy.
- Frontend: Next.js 14 + Tailwind, a live agent activity feed, a queued approval modal (so concurrent incidents don't drop each other's approval requests), and a history/analytics page.
- Infra: one-command Cloud Run deployment (
infra/scripts/deploy-all.sh) that provisions dedicated least-privilege service accounts, the Artifact Registry repo, the Firestore database, and Secret Manager secrets from a completely fresh GCP project. - Docs: a full MkDocs Material site (architecture, agent design, deployment, security model, setup guide, user guide) published to GitHub Pages.
Challenges we ran into
- The hosted Grafana MCP endpoint is OAuth-only. There's no service-account path for an unattended backend to call it - which meant standing up and deploying a second Cloud Run service (the self-hosted
mcp-grafanaserver) with its own token-based auth model, rather than the simpler single-service design we started with. - Forced function calling has a real gotcha. Locking a model into
ANYmode so it can't skip the approval tool also means it can't produce a final prose summary afterward - we had to add an explicit callback that watches for the tool call and relaxes back toAUTOonce it's actually happened, rather than the model looping forever trying to satisfy a constraint that no longer applies. - Concurrency wasn't free. Once we let multiple incidents run in parallel, a single "current agent status" and a single "pending approval" both silently broke - status needed to become a set of active incidents per agent, and the approval UI needed to become a real queue instead of one modal overwriting the next.
- Firestore's query model forced real schema decisions. Combining an equality filter with a server-side sort on a different field needs a manually-created composite index - we designed around that entirely (single-field filters, sort client-side at this app's ops-scale volume) rather than making a manual
gcloudstep a hard prerequisite for the app to run. - A silent deploy-script bug dropped
ADMIN_EMAIL/ADMIN_PASSWORDon the floor instead of passing them to Cloud Run, so a redeploy never actually created the admin account you asked for - found the hard way, fixed by wiring the password through Secret Manager like every other credential, and by making that account's credentials reconcile on every boot instead of a one-shot that silently stopped working after the service's first-ever start.
Accomplishments that we're proud of
- A human-approval gate that's actually enforced by the tool-calling architecture, not by a prompt asking the model nicely.
- Real Grafana Cloud MCP integration verified end-to-end on a live, publicly reachable deployment - not just code that compiles against the SDK, but agents actually calling Prometheus/Loki/Tempo/Incidents/Alerting/Annotations tools on a real stack, confirmed via
agent_mode: "live"on the running service. - The agent crew's own reasoning is observable in Grafana Cloud's AI Observability app, for zero extra instrumentation work.
- A genuinely production-shaped persistence model - the SQL-vs-document-store split isn't cosmetic, it maps to which data actually needs relational guarantees.
- 26 automated backend tests, including full incident-lifecycle coverage (approval, auto-exec, rejection, concurrency, analytics, auth, memory), running green against a real Firestore emulator, not just mocks.
- The whole thing deploys to a fresh GCP project with one script (including the Firestore database and the Grafana SLO dashboard it renders a panel from) and tears back down with another.
What we learned
That the interesting engineering in an "agentic" system isn't the LLM calls - it's the guarantees you build around them: a tool call that genuinely can't be talked around, a status model that survives concurrency, a persistence layer that reflects the actual shape of the data rather than reaching for one database because it's the default. The model is the easy 20%.
What's next for Premiere Control Room
- Per-workspace Grafana credentials and a workspace-scoped WebSocket stream, so this is truly multi-tenant rather than app-level-isolated on one shared connection.
- Self-service password rotation and a proper account-recovery flow.
- A vector-backed version of cross-incident memory once "similar" needs to mean more than "same breaching metric name."
- Deploying the agent crew itself to Vertex AI Agent Engine as an optional hosting target, decoupled from the FastAPI layer.
Built With
adk, google-adk, gemini, vertex-ai, google-cloud-run, grafana, grafana-cloud, mcp, model-context-protocol, fastapi, python, nextjs, react, typescript, tailwindcss, websocket, firestore, google-cloud-firestore, postgresql, cloud-sql, opentelemetry, pytest, jwt

Log in or sign up for Devpost to join the conversation.