-
-
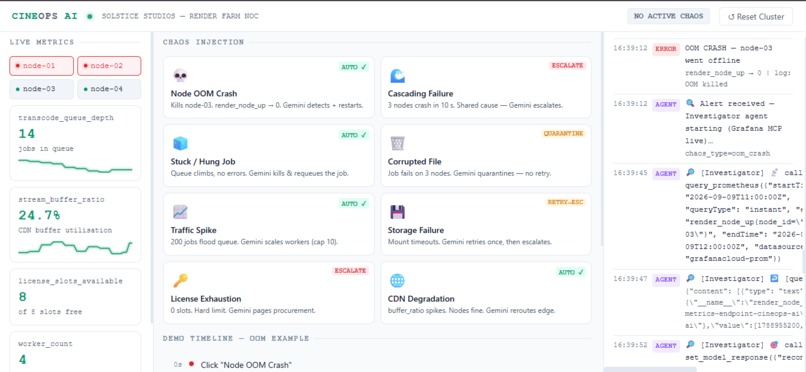
Server dashboard with error simulation and agent logs
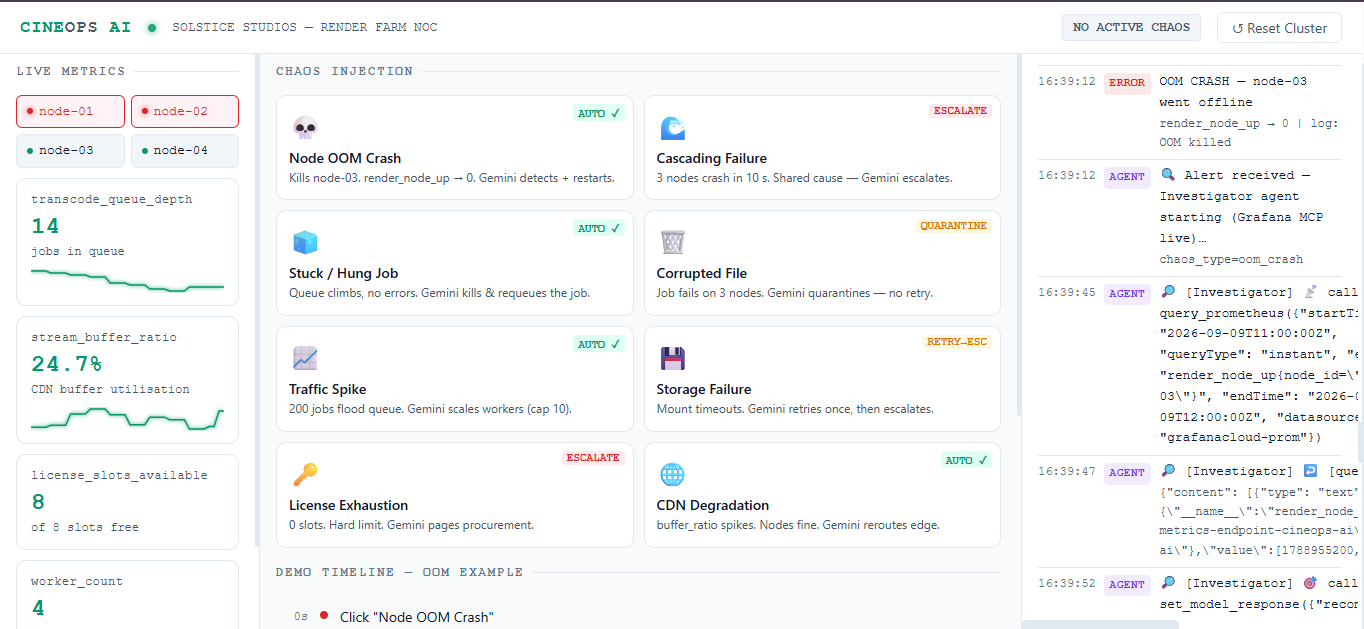
CineOps AI
Most "AI observability" demos we'd seen were staged, a chatbot summarizing metrics someone already knew about. We wanted to build something that had to be real: an agent that never sees our code, never sees our database, and only knows what's happening because it genuinely asked Grafana. So we built CineOps AI, a fake media-rendering cluster we could deliberately break on command specifically so we'd have a reason to find out whether an LLM agent could diagnose and FIX a live incident using nothing but Grafana's MCP server as its eyes.
What it does
CineOps AI simulates a small render farm: four nodes, a transcoding queue, CDN buffer health, license slots, and workers. Eight chaos-injection endpoints let us break it in specific, realistic ways an OOM crash, a traffic spike, license exhaustion, cascading node failures, and more.
When something breaks, a two-agent pipeline built on Google ADK + Gemini takes over:
- An Investigator agent queries real Grafana MCP tools (Prometheus, Loki) to gather evidence, then produces a structured diagnosis root cause, confidence, and a recommended action as its actual output, not a guess dressed up afterward.
- A Remediator agent independently decides whether to act on that diagnosis or escalate it, calls the appropriate fix, and writes an annotation back to Grafana documenting what it did and why.
Critically, when the Remediator calls restart_node, it isn't just reporting a fix it's mutating the same live cluster state that our Prometheus metrics read from. We verified this directly: trigger an OOM crash, watch render_node_up drop to 0 in Grafana, watch the agent reason through it live in the dashboard's SSE log stream, and watch the metric climb back to 1 with a Grafana annotation timestamped seconds later as the paper trail.
How we built it
The whole stack is a single FastAPI app (deployed on Render) that serves the simulated cluster, exposes Prometheus metrics, ships logs to Loki, and streams live agent reasoning to a NOC-style dashboard over Server-Sent Events. Traces go to Tempo and continuous profiling to Pyroscope. The Grafana MCP server runs self-hosted as a sidecar process alongside the app in the same container, since the fully hosted mcp.grafana.com endpoint requires interactive browser OAuth and can't be driven by a headless backend.
Challenges we ran into
- A blocking call froze the entire app. Our early SSE endpoint used a synchronous queue read inside an
async deffunction — on a single-threaded event loop, this silently stalled every other request (including/metricsitself) the moment a browser tab opened the dashboard. Nasty to diagnose because the app looked fine right after every fresh deploy. - Grafana rejected our metrics with a misleading error. A newer
prometheus_clientversion declaredversion=1.0.0in its Content-Type header, which Grafana Cloud's scraper silently rejected while reporting the failure as an authentication problem. Forcing the classic0.0.4header fixed it. - A free-tier Gemini quota that gave us zero margin.Every step in our Investigator/Remediator loop costs a real API call, and free-tier limits are small. We had to genuinely re-architect around this: converting our diagnosis step from a tool call to schema-validated structured output (removing a wasted, ADK-mandated follow-up turn), hardcoding known Grafana datasource UIDs instead of rediscovering them every run, and adding retry-with-backoff for both rate limits and Google's own transient server overload. We went from a fragile 5-call budget with no room for error to a comfortable 4-call cycle with real headroom an optimization problem we didn't expect going in, but one that shaped a lot of the final architecture.
- The MCP sidecar started with zero authentication. Anyone who could reach its port could use our Grafana credentials with no password of their own. We added a shared bearer token and verified all three cases directly: no token rejected, wrong token rejected, correct token accepted.
What we learned
The hardest part of this project wasn't prompting Gemini it was everything around the model: async correctness, exposition-format compatibility, and the mechanics of a multi-turn agent loop under a genuinely tight rate limit. We came away with a much sharper understanding of how ADK's tool-calling loop actually works turn-by-turn, and why "the model got the right answer" and "the pipeline completed successfully" are two different things worth verifying separately.
What's next for CineOps AI
Expanding the Investigator's evidence-gathering to Tempo traces and Pyroscope profiles for incidents where metrics and logs alone don't tell the full story, and testing the Remediator against the full set of eight chaos scenarios not just the two we've verified end-to-end to see how well its judgment generalizes beyond the cases we designed it around.
Built With
- adk
- agentic
- aiops
- autonomous
- cloud
- devops
- docker
- gemini
- googleadk
- grafana
- html5
- javascript
- mcp
- media
- observability
- python
- render
- sre


Log in or sign up for Devpost to join the conversation.