-
-
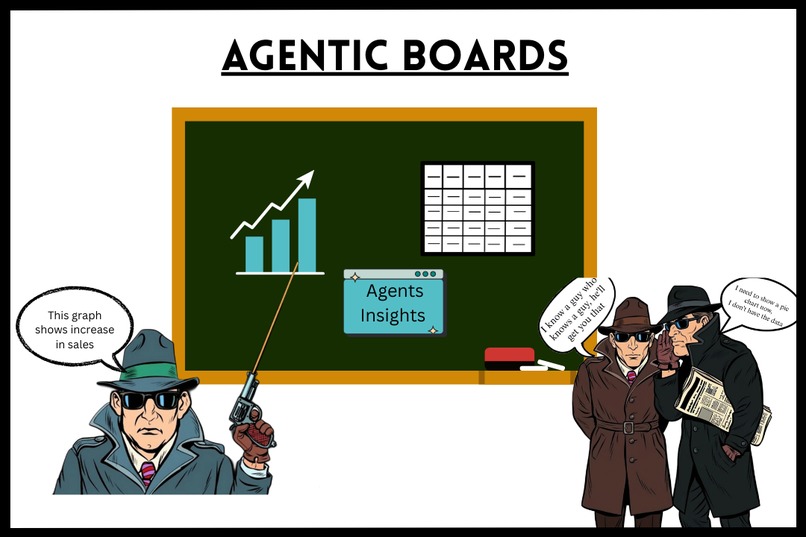
Agentic Boards
-
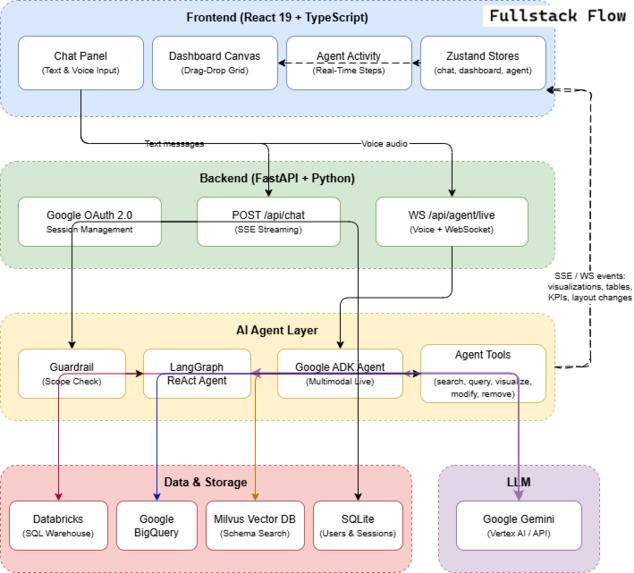
Fullstack Flowchart
-
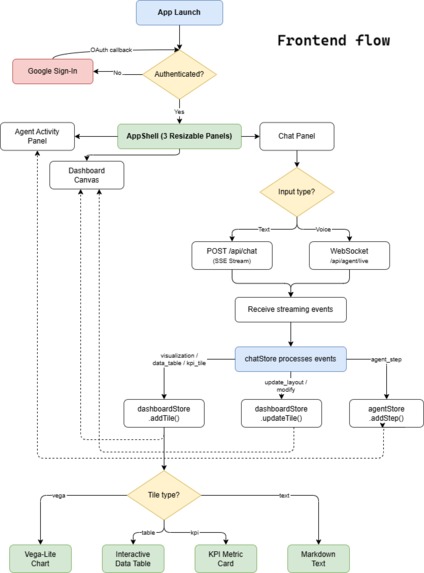
Frontend Flowchart
-
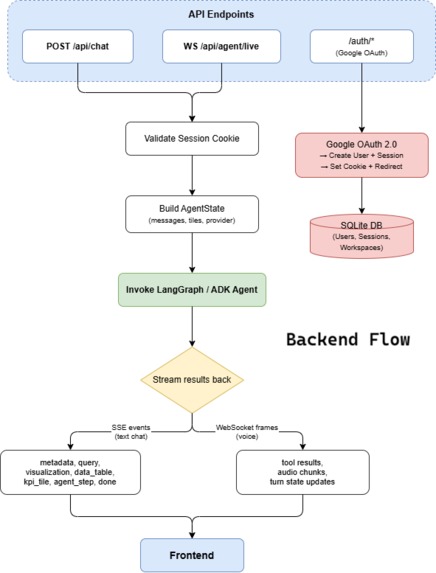
Backend Flowchart
-
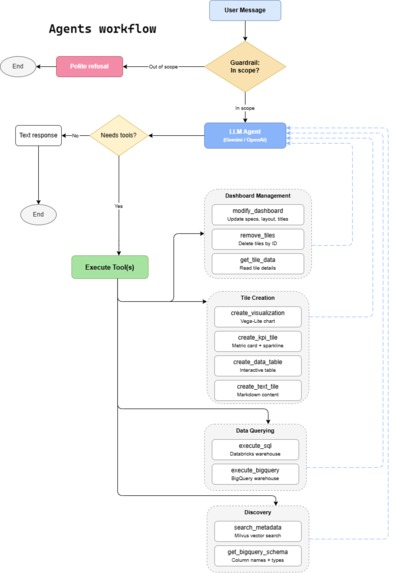
Agents Flowchart
-
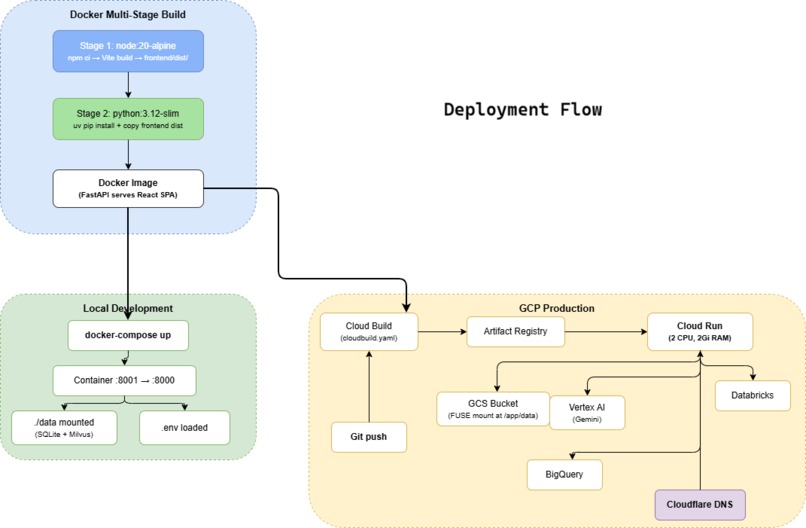
Deployment Flowchart


Inspiration
Agentic IDEs changed the way we write code. It's now more about architecture, I want to bring something similar to data visualization, what if charts/tables are generated by AI similar to code? This question inspired me to build this. I just didn't want an AI to build charts, I wanted it to be interactive, talk to the data, understand it. I wanted to bring that "co-authoring" feeling to data exploration. A real agent that builds live, interactive visualizations on a shared canvas and keeps reasoning about them with you.
What it does
Agentic Boards is an AI-native workspace for building data dashboards through conversation.
- Voice and text chat - ask questions in natural language and the agent figures out the rest.
- Automatic SQL generation - the agent searches your schema semantically, writes the query, and runs it against Databricks or BigQuery.
- Live chart generation - results are rendered as Vega-Lite charts directly on a drag-and-drop dashboard grid.
- KPI cards and tables - beyond charts, the agent creates metric cards with sparklines and interactive data tables.
- Dashboard manipulation - you can ask the agent to resize, rename or recolour tiles/charts by just describing what you want.
- Real-time voice session - a full bidirectional audio session where the agent speaks back while simultaneously calling tools that update the dashboard in real time.
- Always-on context awareness - the agent knows what's on your dashboard and can reason about it, summarise it, or update it without re-querying the database.
How I built it
I built two agents that share the same 14 tool definitions:
The text chat agent runs on LangGraph - a StateGraph with a guardrail node for intent classification, an agent node, and a ToolNode. The graph loops until the LLM produces a final answer. Results stream back to the frontend via SSE.
The voice agent runs on Google's Agent Development Kit (ADK) using Runner.run_live() over a WebSocket. The browser streams 16kHz PCM audio frames as binary WebSocket messages. The ADK model processes audio, reasons, calls tools, and returns 24kHz PCM audio chunks - all in the same session. Tool call events are intercepted and forwarded as JSON to the frontend, which applies the tile mutations to the React dashboard state.
For schema discovery, we built a Milvus Lite vector store. A background indexer crawls your warehouse schema - table names, column names, data types, sample categorical values - embeds everything with text-embedding-004, and stores it. When the agent needs to find the right table, it does a COSINE similarity search against that index in milliseconds.
The frontend is React 19 with Zustand for state, Vega-Lite (via react-vega) for chart rendering, and a Web Audio API pipeline for real-time PCM audio playback in the voice session.
The whole stack runs in a single Docker container deployed on Google Cloud Run.
Challenges I ran into
Context window limits in live mode. The Multimodal Live API has a hard 32K-token context window. Agent ran into context lenght issues while summarizing data when asked, SQL results from a real warehouse can be thousands of rows. I had to build a summariser that truncates tool outputs intelligently
Duplicate tool call events. The ADK streaming event loop sometimes emits the same create_visualization call more than once, which would create duplicate tiles. I fixed this by computing a SHA-1 hash of each tool call's semantic signature (name + args + turn ID) and dropping anything I'd seen before in the same session.
Autonomous agent behaviour on context sync. When the frontend sends the current dashboard tiles to the backend at session start, the model occasionally treated it as a user request and started calling tools unprompted. I've added a has_user_audio gate - context is accepted server-side but never injected into the model as a user turn until the user has actually spoken first.
Milvus paths on Cloud Run. Milvus Lite uses a local SQLite-style file. Relative paths like ./data/milvus_data.db worked locally but broke on Cloud Run with a ConnectionConfigException. I've fixed it by always resolving to absolute paths at client init time using Path.resolve().
LLM skipping create_visualization. After getting SQL results back, the text agent sometimes wrote a plain-text description of the data instead of calling the visualization tool. I detect this with a post-response check - if SQL returned rows but no viz tool was called, I inject a hard nudge message and re-invoke the LLM.
Cross-provider routing. Users can switch between Databricks and BigQuery mid-session. The agent had to correctly route execute_sql vs execute_bigquery and filter Milvus search results by the active provider to avoid referencing Databricks tables in BigQuery queries and vice versa. I've added provider-hint detection and a filtering pass on all metadata results.
Accomplishments that I'm proud of
The voice-to-dashboard loop actually working end-to-end. You say "show me total sales by store for last month as a bar chart," and within a few seconds there's a real chart on the dashboard - built by an agent that searched the schema, wrote SQL, ran it, and generated a complete Vega-Lite spec - all while talking back to you in audio. Getting that entire loop reliable and fast was genuinely hard, and seeing it work smoothly is still satisfying every time.
The dual-agent design where LangGraph and ADK share the same 14 tool implementations. Neither framework required me to duplicate business logic just different wrappers around the same functions. That abstraction held up cleanly.
The semantic schema discovery is something I'm quite proud of. You can point Agentic Boards at any Databricks or BigQuery warehouse and it will figure out which tables are relevant to your question without any manual configuration. Zero hardcoded schema.
The data quality guard in SQL execution - when every numeric column comes back zero or null, the agent is explicitly told to re-query instead of charting meaningless empty data. It's a small thing but it stopped a real class of confusing failures.
What I've learned
The Multimodal Live API is genuinely powerful but requires a lot of defensive engineering around it. The bidirectional audio streaming works beautifully once you get the buffer management right, but the stateful session model means errors tend to cascade in ways that are hard to recover from mid-session. Defensive gates and clean teardown logic are not optional.
LangGraph is great for structured, inspectable agents. Being able to see exactly which node the agent is in and inject logic between steps (like the guardrail or the viz nudge) is very useful. But it doesn't help you when you need streaming audio. ADK fills that gap well - though the two frameworks have very different mental models and combining them requires a clean abstraction layer.
Vector search for schema discovery was the right call over keyword search or static mapping. Queries like "revenue trends" correctly resolving to a column called gross_sales in a table called transactions - without any explicit synonym mapping - is the kind of thing that makes the product feel intelligent rather than just scripted.
Building something that works at the end of a multi-hop AI chain (query → embed → search → SQL → chart) requires very robust error handling at every step because failures compound. The goal wasn't to make each step perfect but to make the whole pipeline recoverable.
What's next for Agentic Boards
There are a lot of charts that can be created in traditional BI platforms, due to time constraint I couldn't build most of them.
- Next steps would be adding tools for more charts.
- I also want to implement predictive analysis and forecasting using ARIMA, SARIMAX etc. AI + predictive analysis is something I see as a pro side of BI.
- More database integration.
- Add real-time collaborative sessions where two people can talk to the agent simultaneously.
- Plugins for python script
Built With
- databricks
- fastapi
- gcp
- gemini
- google-bigquery
- langchain
- langgraph
- milvus
- python
- react
- sqlite
- typescript

Log in or sign up for Devpost to join the conversation.