Inspiration
The idea came from something pretty familiar to anyone who builds software: debugging usually takes longer than writing the first version.
That gets even worse with AI agents. When an agent gives a final answer, we often do not know what actually happened in the middle. Did it run the right command? Did it change a file? Did it fail once and recover? Did it expose something sensitive?
We wanted to make agent runs easier to inspect. Instead of treating the agent like a black box, Agent Trace gives developers a timeline they can look through when something works, breaks, or behaves unexpectedly.
What it does
Agent Trace records what happens during an agent run and turns it into a readable trace.
It captures things like run status, messages, commands, file changes, tool calls, searches, usage, errors, and failure evidence. In the UI, users can open the trace inspector, browse the timeline, filter for failed steps, jump to the first failure, and export the trace as JSON.
It also redacts sensitive values before saving trace data, so things like API keys, bearer tokens, passwords, and secret-like fields do not end up in stored logs.
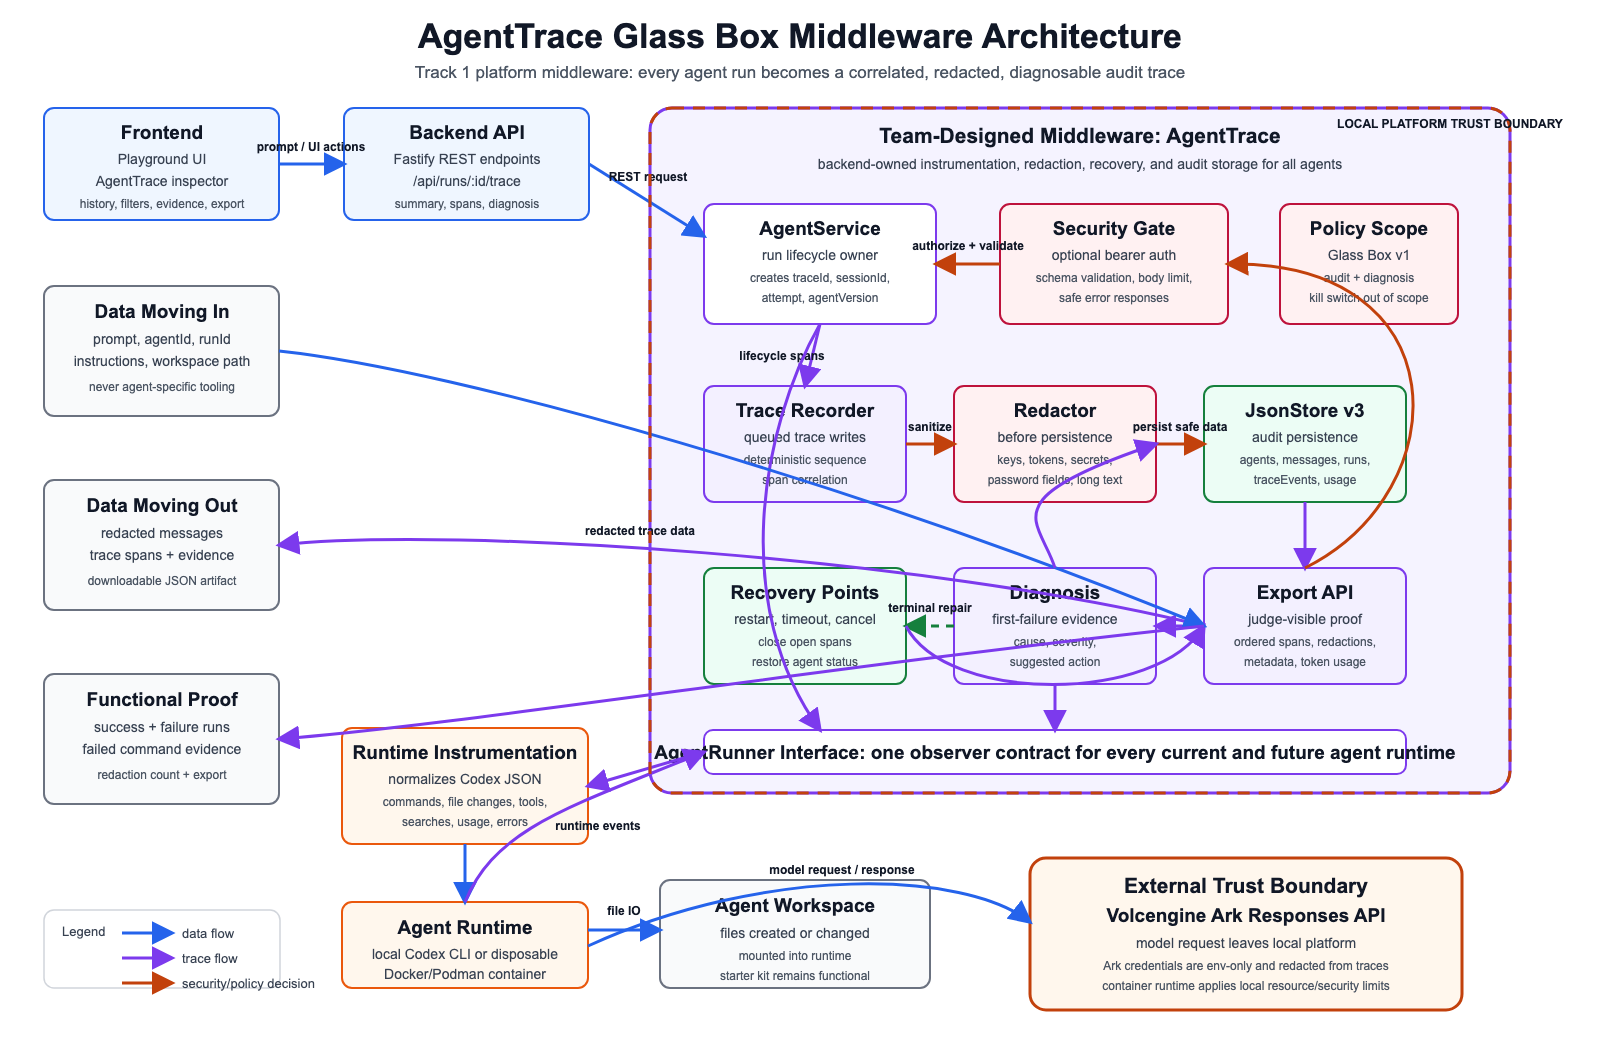
The important part is that Agent Trace is middleware for the whole platform. It is not a one-off tool for a single demo agent. Any agent run that goes through the shared backend/runtime path gets the same tracing and debugging support.
How we built it
We started from the Volc Agent Launchpad starter kit and added Agent Trace into the shared runtime path.
The frontend is a React app with the normal agent playground plus a trace inspector. The backend is a Fastify server that manages agents, messages, runs, trace data, and persistence.
Most of the work went into the backend. We added a shared runner interface so different runtimes can report events in the same format. The local Codex runner and the container runner both send events through this observer path. The backend then normalises those events into trace spans with IDs, timestamps, status, metadata, usage, and parent-child relationships.
Before saving any trace details, the backend passes them through a redaction layer. We also added recovery handling for cancelled runs, timeouts, and server restarts, so unfinished runs are not left stuck forever.
Challenges we ran into
One hard part was deciding how much information to keep. If the trace is too small, it is not useful for debugging. If it stores everything, it becomes noisy and risky. We had to keep the data structured and useful while still redacting sensitive content.
Another challenge was making sure this was real middleware and not just a nice-looking dashboard. It would have been much easier to fake a timeline in the frontend, but that would not prove much. We moved the tracing into the backend runtime path so the UI is showing actual recorded events.
We also had to think about local reproducibility. Judges need to run the project without hidden setup steps, but real model runs still need credentials. That pushed us to document the local setup clearly and keep the demo path simple.
Accomplishments that we're proud of
We are proud that Agent Trace shows real evidence from agent runs instead of only displaying final outputs.
The failure view is probably our favorite part. When a run breaks, the system does not just say “failed.” It points to the first useful failure event and shows details like the command, exit code, error, and suggested next step.
We are also proud that the tracing layer applies across agents. The project feels more like a platform feature than a single-agent hack.
What we learned
We learned that agent debugging needs a different kind of observability from normal app logs. A useful agent trace has to connect the prompt, runtime actions, model usage, file changes, and errors into one timeline.
We also learned that transparency is not just about showing more data. It is about showing the right data in a way that helps someone make a decision.
The biggest takeaway was that trust comes from evidence. If developers can see what happened during a run, they can debug faster and feel more confident using agents.
What's next for Agent Trace
The next step would be adding policy controls on top of the trace layer. Since Agent Trace already captures commands, file changes, tools, errors, and runtime metadata, it could support approval gates, allowlists, deny rules, or kill-switch behaviour.
We would also like to add better multi-user access control, trace comparison between retries, more runtime providers, and higher-level metrics across many runs.



Log in or sign up for Devpost to join the conversation.