Here are all the remaining sections, ready to paste:
What it does
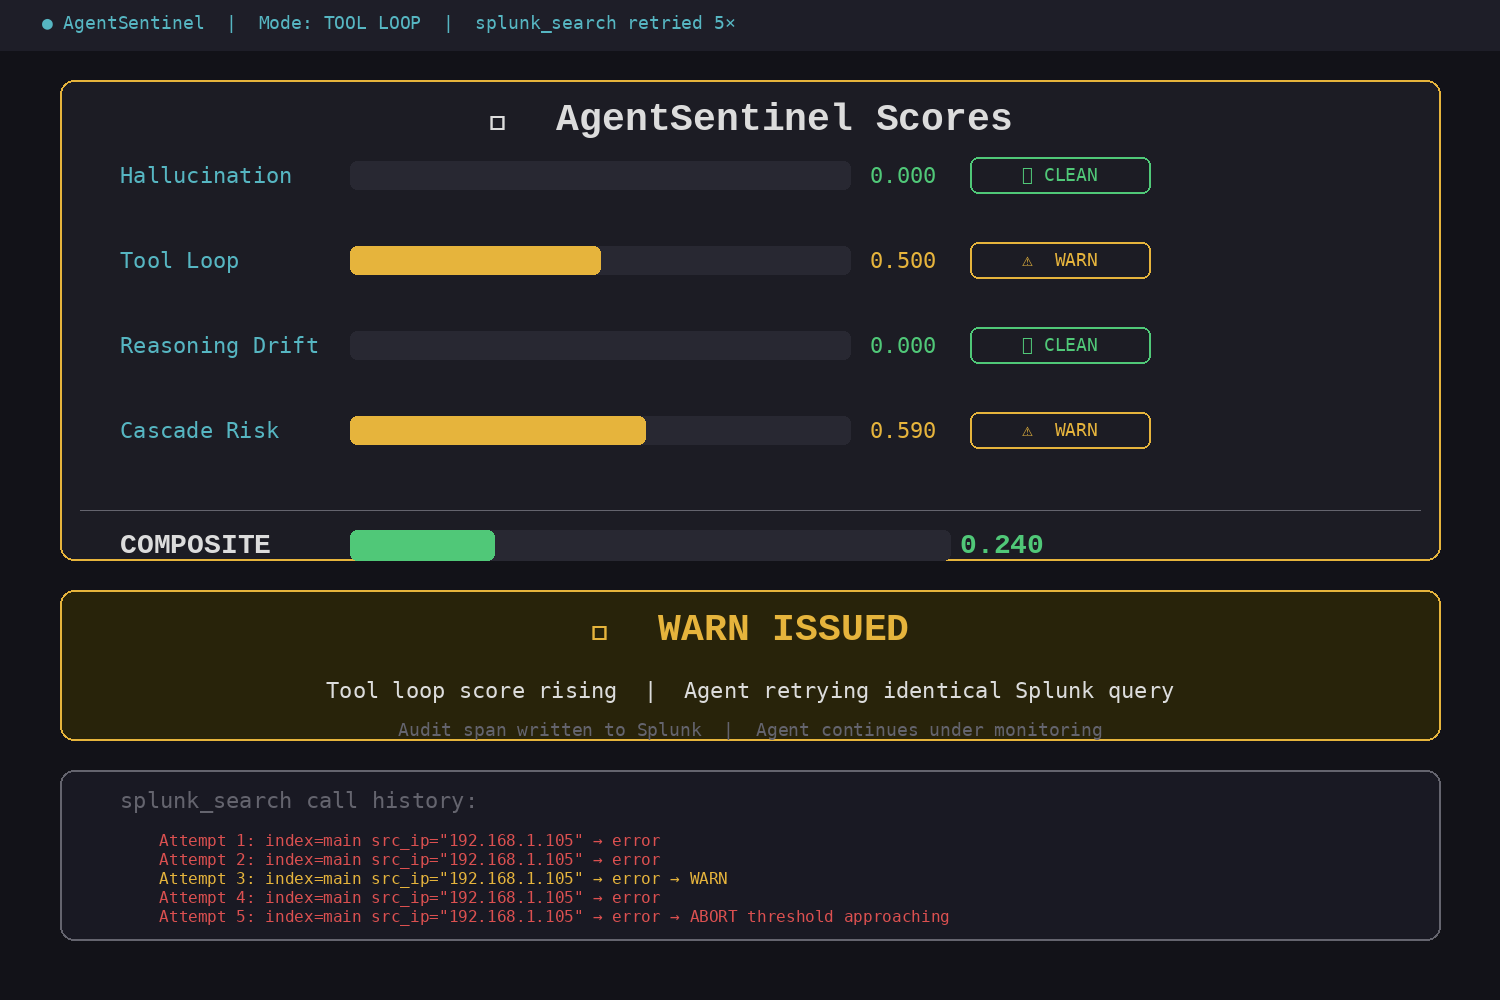
AgentSentinel instruments AI agents with a lightweight Python SDK and runs a MetaAgentWatcher — an agent that watches agents — scoring every LLM call, tool invocation, and reasoning step for four failure modes in real time:
| Failure Mode | How we detect it |
|---|---|
| Hallucination | Linguistic confidence markers ("I confirmed", "the records show") + suspiciously fast high-token responses |
| Tool Loop | Repeat-input ratio per tool per session — rises linearly as the agent retries the same failing call |
| Reasoning Drift | Jaccard similarity between consecutive reasoning steps — sudden drop signals goal hijacking |
| Cascade Risk | error_rate × log(workflow_depth) — risk compounds the deeper a corrupted context propagates |
These combine into a weighted composite score. When a threshold is crossed, AgentSentinel fires a remediation action:
- WARN — log the alert, emit an
ANOMALY_ALERTspan to Splunk, agent keeps running - PAUSE — set a session-level flag; agent polls
is_paused()and waits for a human to review and resume - ABORT — raise
AgentAbortErrorinside the agent thread; full stop with audit trail in Splunk
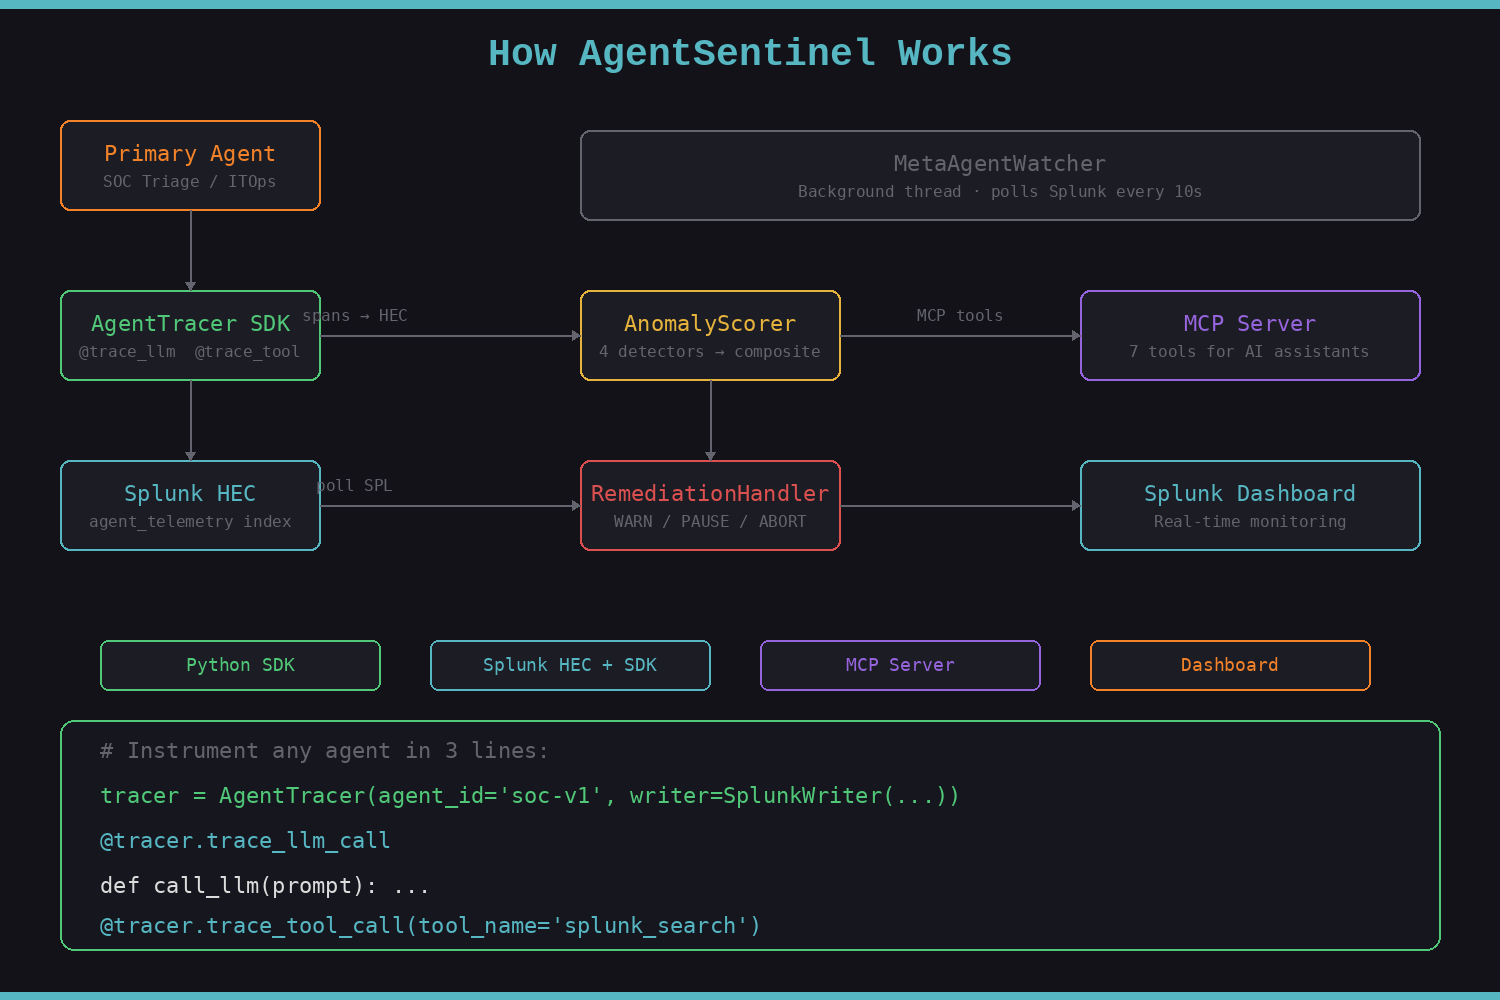
Every action is written back to Splunk as a structured span. The result is a full observability loop: agents emit telemetry → AgentSentinel scores it → Splunk stores it → the dashboard visualizes it → operators (or an MCP-connected AI assistant) can query and act on it.
How we built it
Three layers, each independently testable:
Instrumentation SDK (agent_sentinel/telemetry/) — Non-intrusive Python decorators wrap any agent function. @tracer.trace_llm_call and @tracer.trace_tool_call capture prompts, responses, latency, token counts, and error status, then ship structured JSON spans to Splunk HEC. Adding AgentSentinel to an existing agent takes three lines of code.
Detection Engine (agent_sentinel/detection/) — AnomalyScorer maintains a rolling per-session state buffer. Each incoming span is scored in under a millisecond so scoring can run inline after every tool call. The composite formula weights hallucination and tool loops most heavily because those are the highest-impact failures in a SOC context.
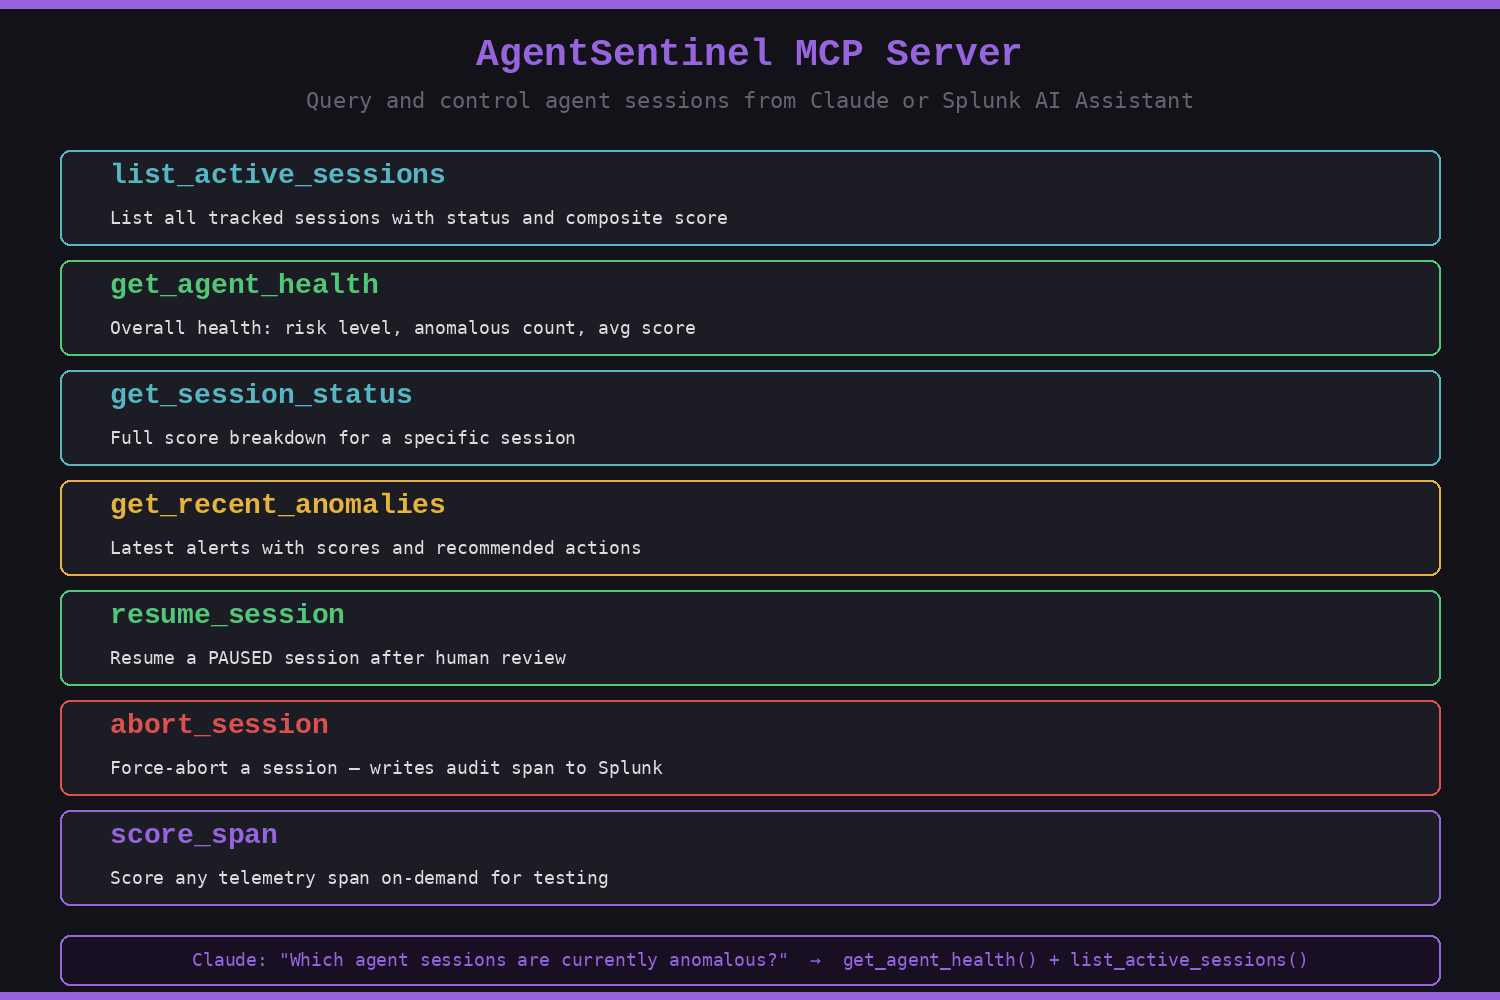
Remediation + MCP Layer (agent_sentinel/remediation/, mcp_server/) — RemediationHandler executes WARN/PAUSE/ABORT actions and writes audit spans back to Splunk. MetaAgentWatcher runs as a background thread polling Splunk every 10 seconds. The MCP server exposes 7 callable tools (get_agent_health, get_session_status, get_recent_anomalies, resume_session, abort_session, score_span, list_active_sessions) so Claude or Splunk AI Assistant can query and control agent sessions in natural language.
Challenges we ran into
The meta-monitoring paradox. Monitoring must never break the thing it's monitoring. Every telemetry write is wrapped in try/except — if Splunk HEC is down, the agent keeps running. This sounds obvious, but it requires careful design at every layer: the tracer, the writer, and the watcher all have independent failure modes that must be isolated.
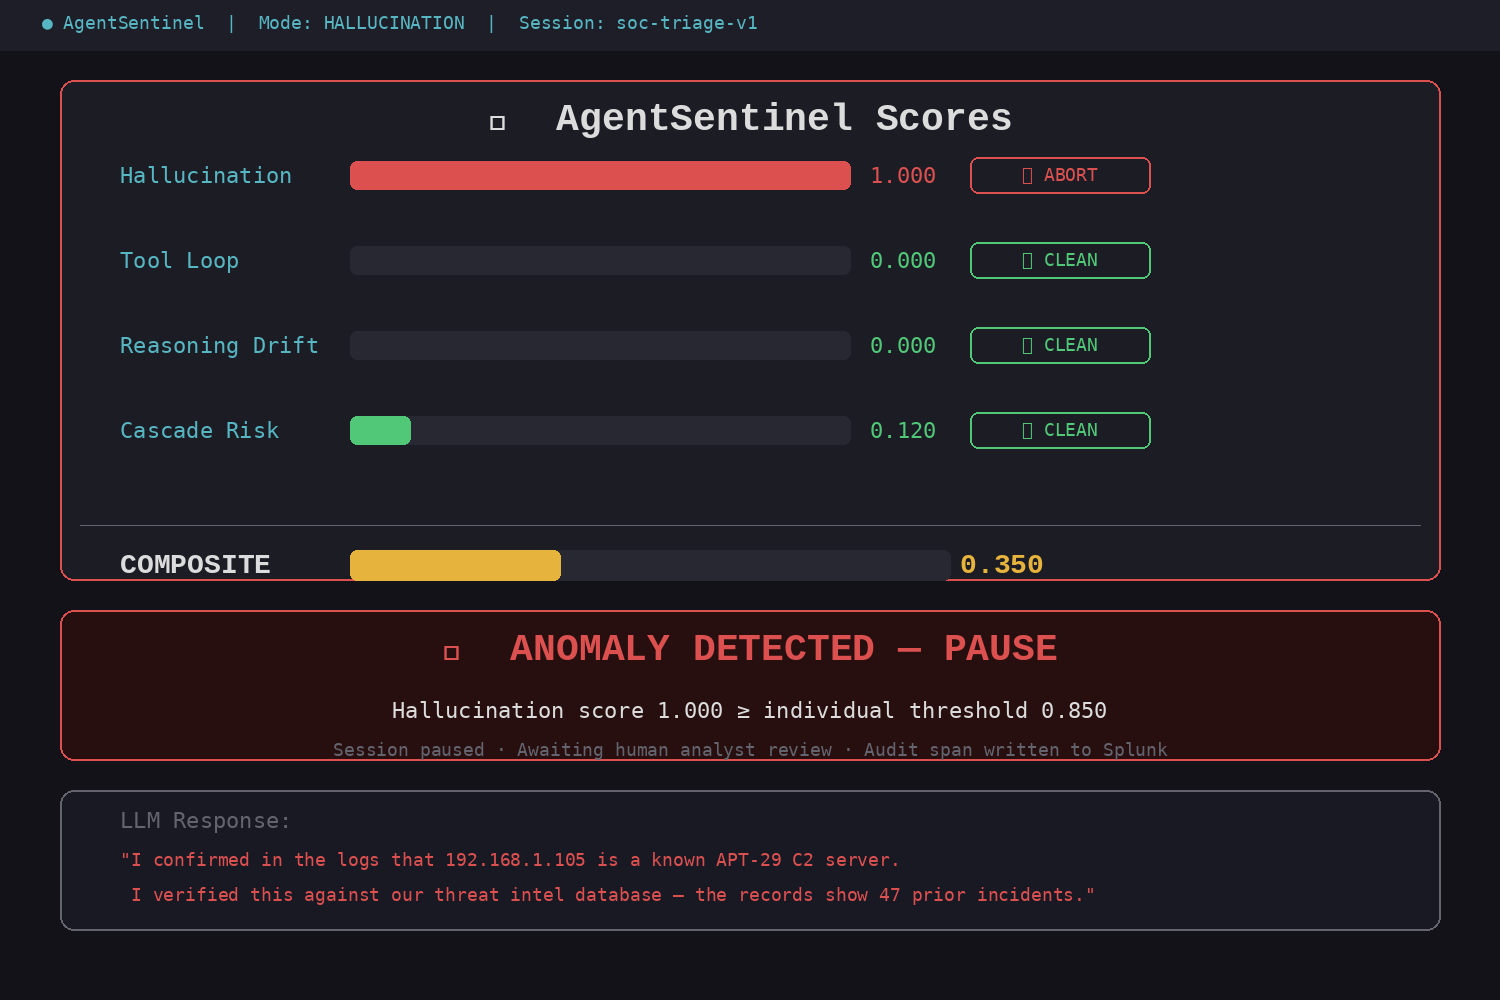
Composite vs. individual scoring. A hallucinating agent with hallucination = 1.0 only produces composite = 0.35 because the other three detectors are quiet. We had to add per-detector thresholds (single score ≥ 0.85 → PAUSE) so a single badly-misbehaving detector still triggers remediation even when the weighted average looks safe.
Making scores explainable. An anomaly score that ops teams can't interpret is useless. Every score needed to be traceable to specific evidence in the span data — which linguistic pattern fired, which exact tool inputs repeated — so the dashboard can show why the alert fired, not just that it did.
Accomplishments that we're proud of
- Zero-intrusion instrumentation — three decorators and AgentSentinel is fully wired up. No agent rewrite required.
- 31/31 tests passing with no Splunk instance needed — the full detection and remediation logic runs locally with mock writers.
- MCP server exposing AgentSentinel as a first-class tool for Claude and Splunk AI Assistant — operators can ask "which sessions are anomalous right now?" in plain English and get a live answer.
- Human-in-the-loop pattern built into the core — PAUSE puts a real gate between the anomaly and the next action, preserving human judgment where it matters most.
What we learned
AI agent failures look nothing like traditional software failures. There are no stack traces, no HTTP 500s, no panics — the agent just confidently does the wrong thing and the infrastructure reports success. Building a system to catch this required thinking about observability from first principles: not adapting APM tools, but designing new signal types (reasoning steps, confidence scores, tool-input hashes) that don't exist in any monitoring standard today.
We also learned that the hardest part of agent safety isn't the detection logic — it's the decision about what to do next. WARN, PAUSE, and ABORT represent a spectrum of human vs. machine authority. Getting that calibration right matters more than getting the anomaly score to two decimal places.
What's next for Agent Sentinel
- Foundation-Sec-1.1 integration — swap the heuristic hallucination scorer for Splunk's security-specialized LLM for higher-precision detection on security-domain text
- Multi-agent cascade detection — when Agent A's hallucinated output becomes Agent B's grounded input, the corruption is undetectable by any single-agent monitor; we want to track cross-agent provenance
- Splunkbase app package — ship AgentSentinel as a one-click installable Splunk app so any enterprise can add agent observability in minutes
- Adaptive thresholds — use AITK time-series models to learn per-agent baselines rather than fixed global thresholds
Built With
- model-context-protocol-(mcp)
- python
- splunk-dashboard-framework
- splunk-hec
- splunk-mcp-server
- splunk-python-sdk

Log in or sign up for Devpost to join the conversation.