Inspiration
Production incidents are difficult because engineers have to investigate metrics, deployments, dependencies, and logs while customers are still affected. I was interested in the idea of letting an AI agent help investigate production incidents without giving it full control. That led me to build Agent Operations Center, where the agent investigates the problem and I stay in control of the actual fix.
What it does
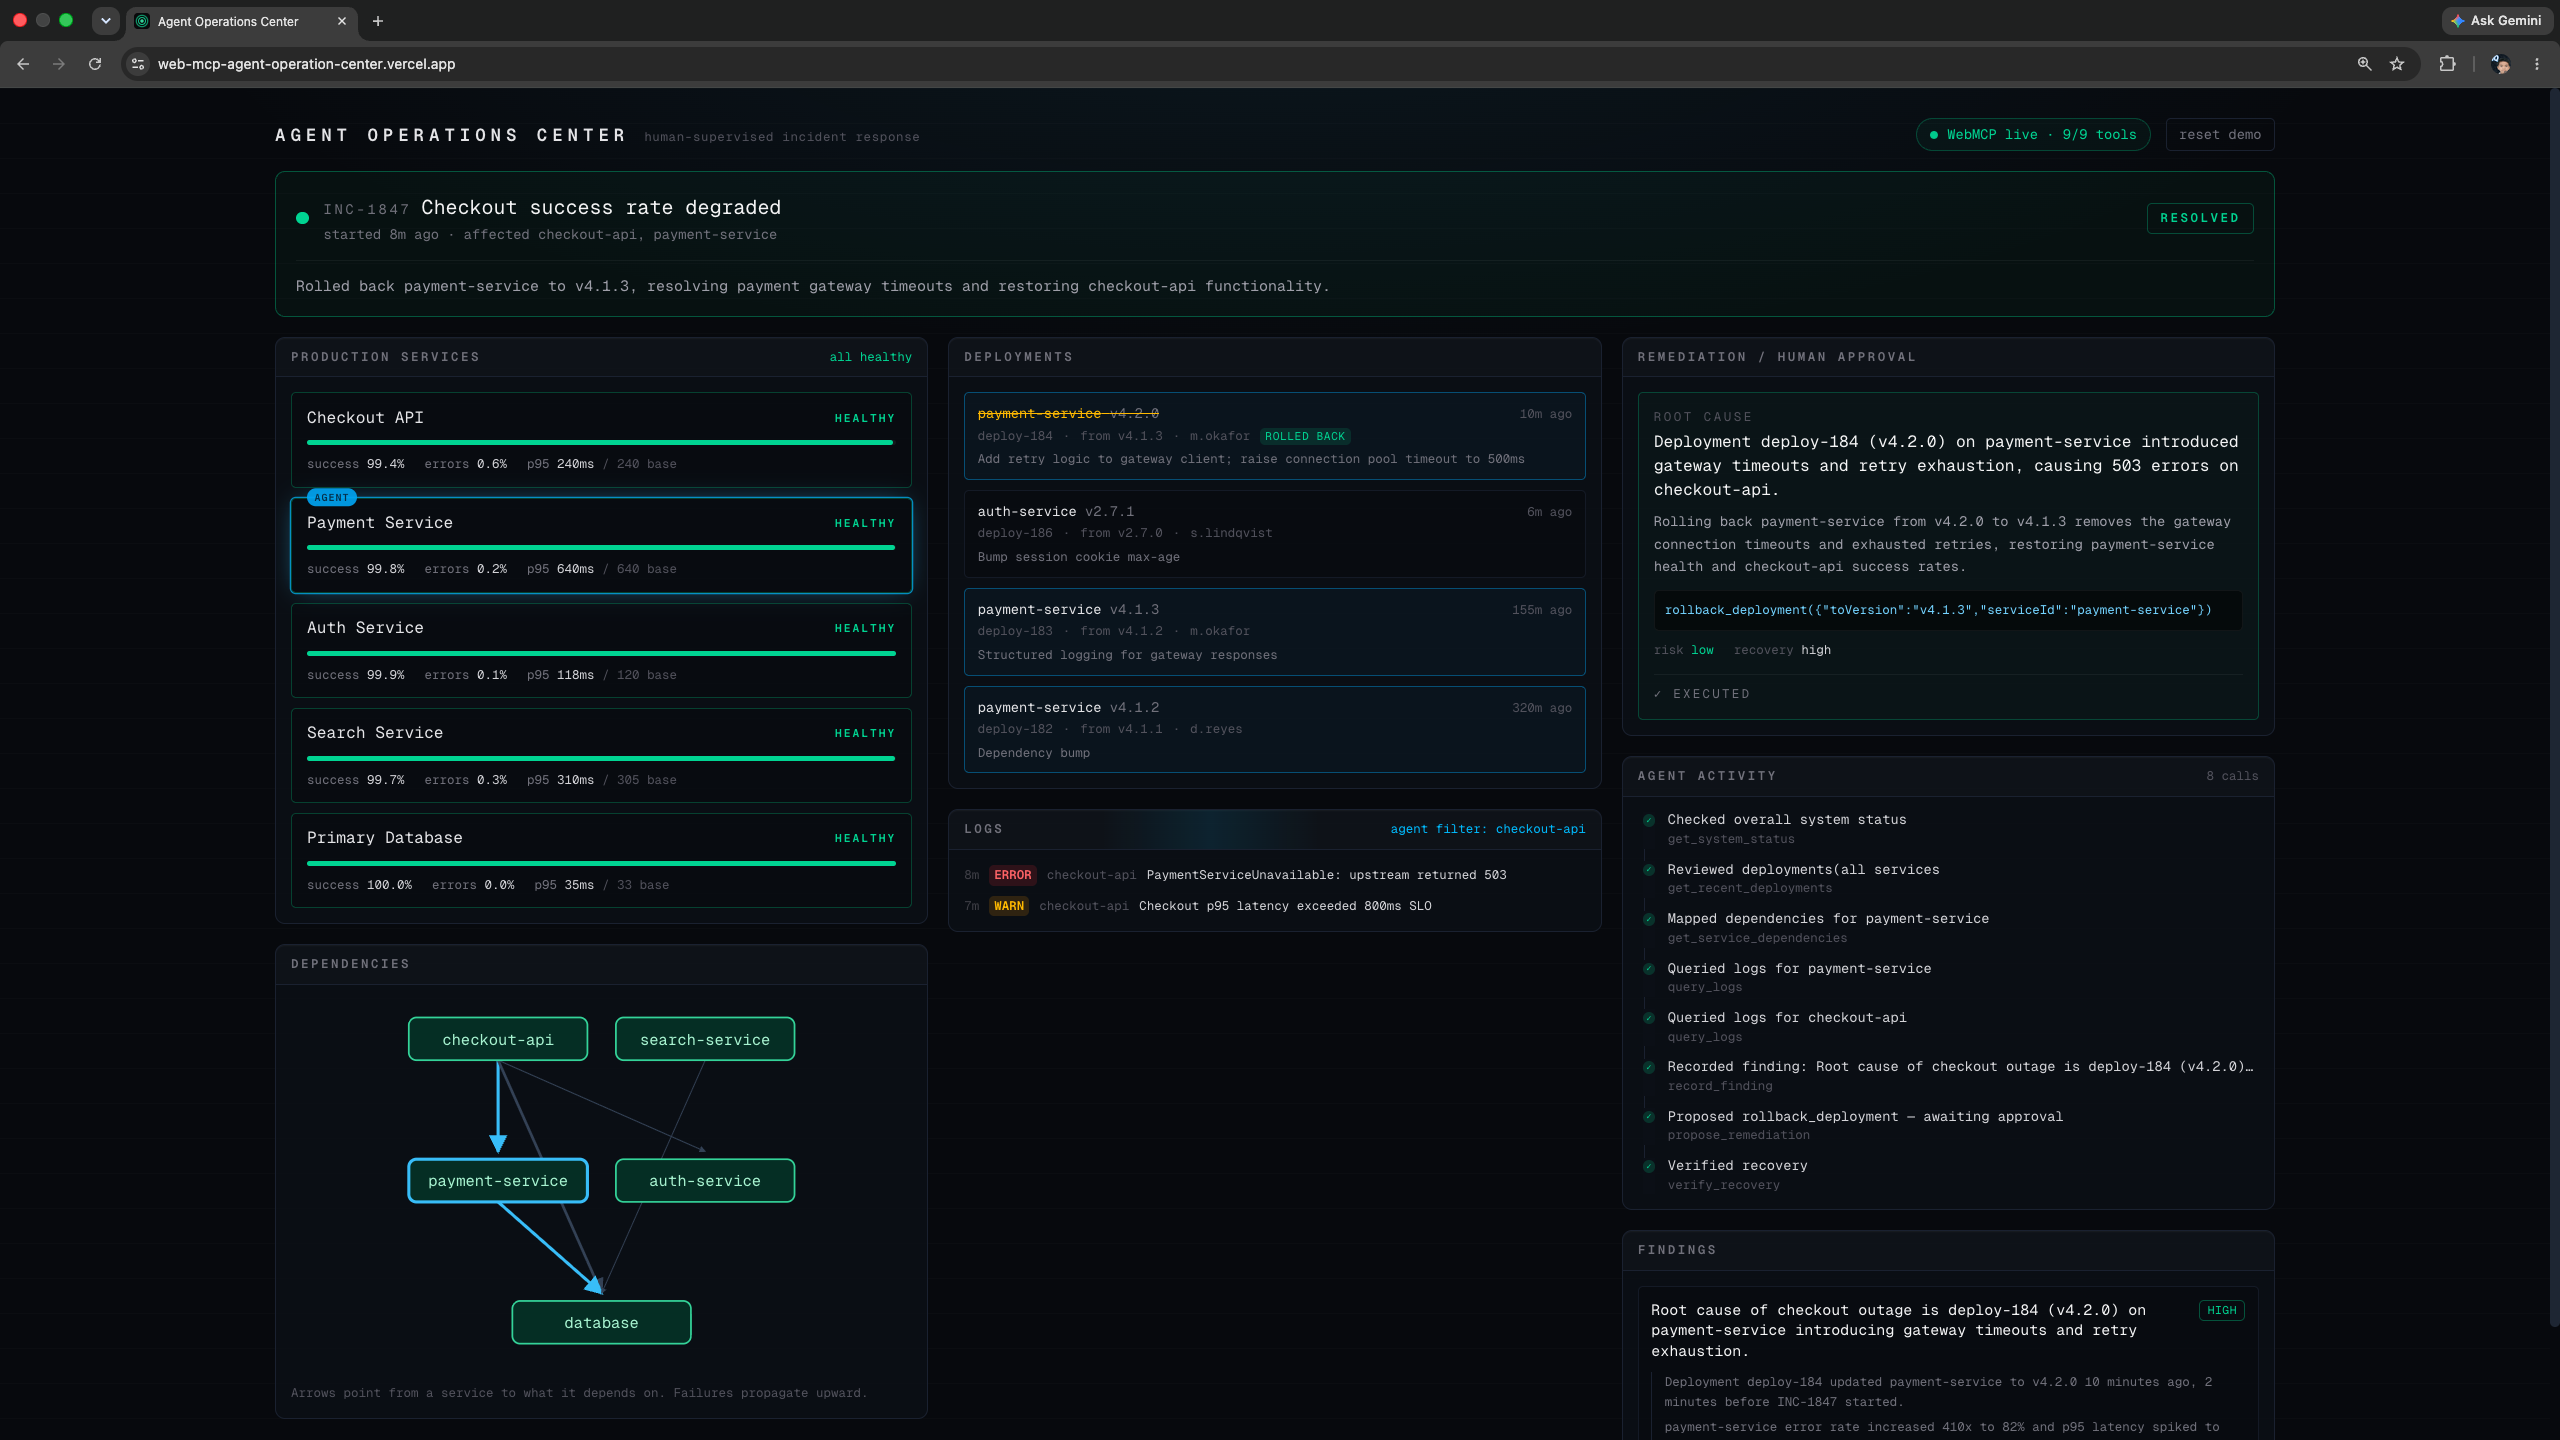
Agent Operations Center is an incident-response control room where a human engineer and an AI agent work the same production outage together. The page exposes nine WebMCP tools the agent uses to investigate — but it cannot apply the fix itself. The agent investigates: service health against 7-day baselines, deployment timing against the incident, dependency direction for blast radius, and its own log queries. It records findings with cited evidence, so the human audits reasoning rather than a summary. The dashboard reacts live, with nobody touching the mouse. Cards highlight as it inspects them, the log panel narrows to its query, every call appears in an activity feed. The reasoning is genuinely the agent's. Tools return evidence, never conclusions — there is no "find the root cause" function. The scenario includes a decoy: a healthy service deployed more recently than the guilty one, so blaming the newest deploy gets it wrong. Then a human approval gate that is structural, not advisory. propose_remediation suspends mid-execution inside the browser until someone clicks APPROVE. The agent has no path to production — the click is what changes state, bound to the exact service and version proposed. One approval, one execution. The agent then verifies recovery and resolves the incident.
How we built it
Next.js 16, React 19, TypeScript, Tailwind v4, deployed on Vercel. A simulated production backend — services, deployments, dependencies, logs, metrics — lives in an in-memory store exposed to React through useSyncExternalStore, since tool calls originate outside React and there's no render pass to hook into. Nine tools are registered with document.modelContext.registerTool. Five read, two write the agent's reasoning back into the UI, one gates approval, one verifies recovery. The design rule that mattered most: tools return evidence, never conclusions. There is no analyze_incident(). get_service_health returns p95Ms: 8.13× baseline and stops. The diagnosis has to happen in the model, or the demo is just a scripted animation.
Challenges we ran into
The API isn't documented yet. I guessed wrong three times. There's no unregisterTool — registration is one-way for the document's lifetime, so React StrictMode's double-mount collides with InvalidStateError: Duplicate tool name; a window-level flag is the only guard that survives both StrictMode and Fast Refresh. And executeTool takes a RegisteredTool handle from getTools(), not a name, with arguments as a JSON string — an object throws Failed to parse input arguments. I found that by writing a probe that tried six encodings. The hardest problem wasn't technical. My rollback worked perfectly when I called it by hand, and the agent refused to call it. It would investigate, propose a plan, get approved — then ask "May I execute the rollback?" and end its turn. Assistants won't invoke destructive tools without re-confirming in chat, and no amount of rewording the tool description changed that. So I inverted it. The rollback now runs inside approvePlan — the click handler. The agent proposes; the human's click executes. That turned a limitation into the better architecture: the agent has no path to production at all.
Accomplishments that we're proud of
- The approval gate is structural, not advisory. The agent has no path to production at all — a human's click is the only thing that changes system state, and approval is bound to the exact service and version proposed.
- The agent's reasoning is actually part of the workflow. The scenario includes a decoy: a healthy service deployed more recently than the guilty one. An agent that blames the newest deploy gets it wrong. Ours rules it out by combining deploy timing, service health, and dependency direction in the demo scenario.
- The dashboard reacts to the agent, not the mouse. Service cards highlight as it inspects them; the log panel narrows to its query. That works because the WebMCP tools run inside the page and can update the same state the dashboard displays.
- I documented an undocumented API. executeTool's signature, the absence of unregisterTool, and the JSON-string argument encoding are all recorded in webmcp.d.ts with the console output that proves them. ## What we learned
- Tool descriptions are prompts, not documentation. Writing "get valid ids from get_system_status" inside an inputSchema field is what produces tool chaining instead of the agent guessing an id and failing.
- Return errors, don't throw them. { error, knownIds: [...] } lets an agent self-correct on the next call. An exception dead-ends it, and a stalled agent is the fastest way to lose a demo.
- External state needs useSyncExternalStore. Tool calls originate outside React, so there's no render pass to piggyback on — and mutating state in place means React never re-renders and the dashboard silently goes stale.
- Design around the model's caution, not against it. Fighting it cost hours. Accommodating it produced a stronger safety guarantee than the one originally designed. ## What's next for Agent Operations Center
- More scenarios, randomized — config errors, dependency outages, resource leaks — so the agent can't pattern-match its way to the answer.
- Competing remedies. Restart, feature flag, and rollback all viable, so the agent has to choose the safest one rather than having only one option.
- Real backends behind the same tools. Swapping the simulated store for Kubernetes wouldn't change a single tool description.
- Policy tiers. Low-risk actions auto-approved, high-risk requiring two approvers.
Built With
- css
- next.js
- react
- tailwind
- typescript
- webmcp

Log in or sign up for Devpost to join the conversation.