-
Game!
Agent Clank
Inspiration
Data presentation has been historically limited at CDC competitions, so we wanted to take a novel and creative approach. Through our gamified, interactive interface, we enable real data exploration and granular control of what data you see. We had several "there has to be a better way" moments when dealing with data quality issues - obviously due to being on Mars and in adverse weather conditions, some of the data was not transmitted properly along with a whole host of other issues. Our target audience is anyone aiming to literally explore data. With the advent of AI, it only feels right to start taking steps in the direction of 'live data' and true exploration.
What it does
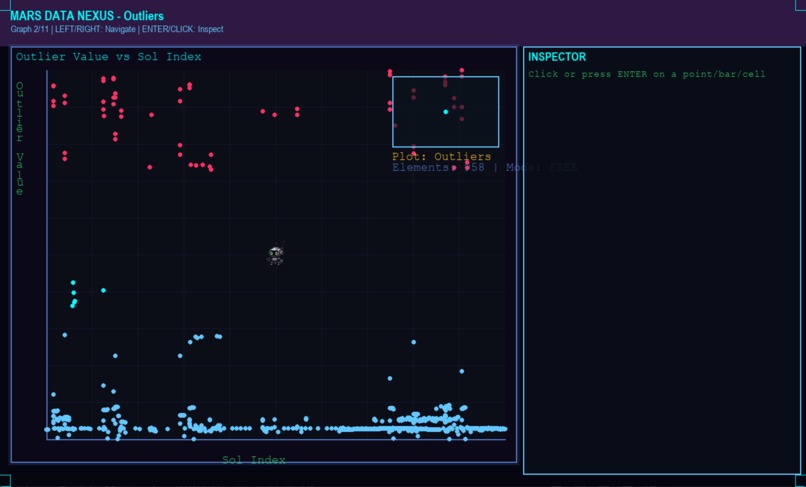
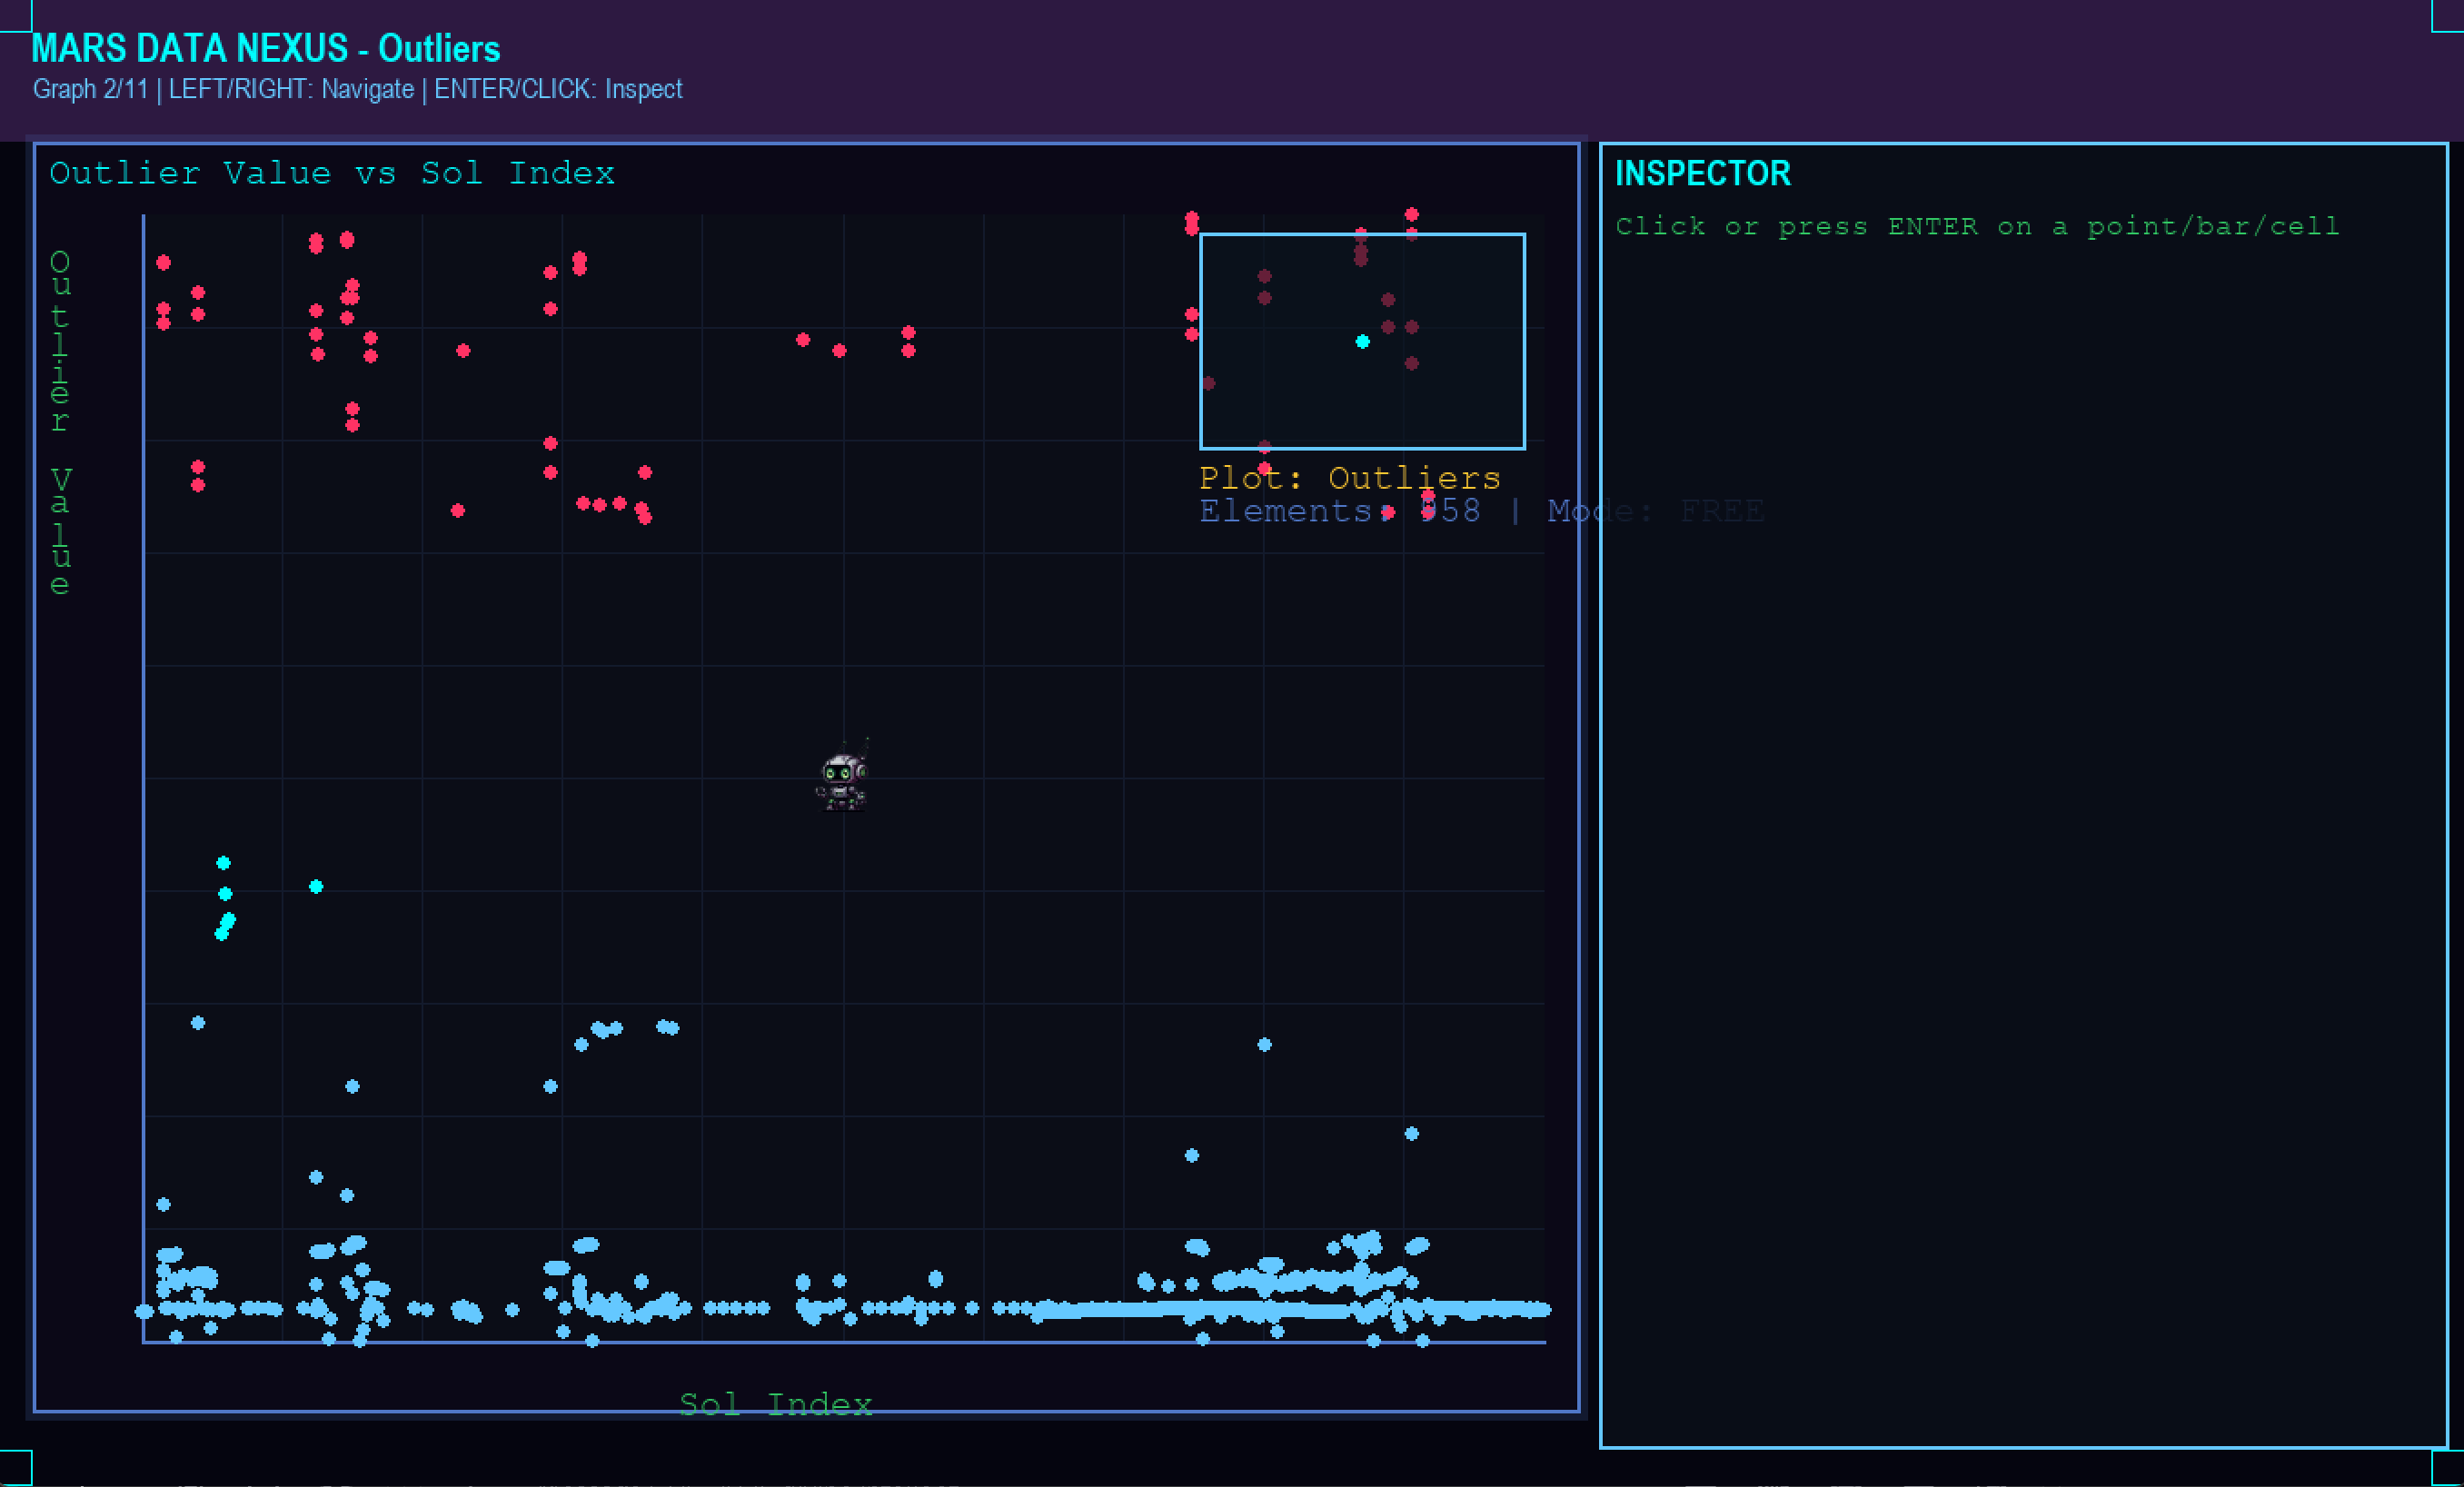
Agent Clank is a C# interface that processes and displays analysis of over 100 columns, over 80 graphs, tables, and other visualizations in many different formats including Q-Q plots, regression lines, scatterplots, and more. It integrates unique interaction mechanisms for each visualization type, such as being able to click into specific points on a scatterplot to view detailed information, climb a density plot, or watch the screen turn red as you leave the confidence interval for a predictive model. The graphs don't load simultaneously - instead, they flow as part of an interactive narrative story, like an interactive narrative game. We hope to implement a Hugging Face model for natural language analysis, though sleep and dev time are major constraints. The main focus is ensuring a proper 'narrative' for the question we are asking is present while leaving room for future AI implementation, otherwise the quantity of graphs would be overwhelming.
How we built it
We built Agent Clank using C# with pre-computed data processing to handle the complex analysis pipeline. The system processes over 100 columns of data and generates visualizations dynamically as part of the narrative flow. We implemented sophisticated data quality handling to deal with the transmission issues inherent in Mars-based data collection. The column calculations are fairly hidden and work behind the scenes to create meaningful derived variables that enable effective analysis.
Challenges we ran into
The biggest challenges were dealing with extensive data quality issues due to the harsh Martian environment affecting data transmission. Creating meaningful analysis from incomplete datasets required significant data engineering work. Implementing the interactive narrative flow while maintaining performance across 80+ visualizations was technically demanding. Building unique interaction mechanisms for each visualization type also presented interesting UI/UX challenges.
Accomplishments that we're proud of
We're particularly proud of our interactive features and live data functionality, as well as the complex data science engineering we accomplished. The narrative-driven approach to data exploration creates an engaging user experience that goes beyond traditional dashboards. Successfully handling the data quality challenges while maintaining analytical rigor was a significant achievement. The seamless integration of gamification elements with serious data analysis creates a unique exploration experience.
What we learned
We learned the importance of robust data preprocessing when working with real-world, imperfect datasets. The value of narrative structure in data presentation became clear - without it, the quantity of visualizations would be overwhelming. We also gained insights into balancing interactive features with performance considerations. If we started over, we would have looked much deeper into what InSight was and how to calculate new columns from the beginning, though we're glad we didn't - otherwise we might not have taken on this challenge!
What's next for Agent Clank
Our immediate priority is integrating a Hugging Face model for natural language analysis, allowing users to query the data conversationally. We plan to expand the interactive narrative elements and add more sophisticated AI-driven insights. Future development will focus on making the data exploration even more intuitive and expanding support for additional data sources and formats. We're also exploring ways to make the gamification elements even more engaging while maintaining analytical depth.


Log in or sign up for Devpost to join the conversation.