The Problem
AI agents are increasingly given real, standing access to production data — reading customer tables, querying financial records, pulling ML training data, calling internal APIs — often with broad service credentials shared across multiple agents or workflows. This access is usually granted once, during setup, and rarely re-examined.
That creates a governance gap that doesn't exist for human employees:
- If a human employee opens a payroll table they're not cleared for, most organizations have some audit trail and a compliance process that reacts.
- If an AI agent does the exact same thing — reads a PII table outside its declared scope, touches a dataset flagged confidential, or crosses a boundary nobody explicitly authorized — there is typically no equivalent check. It just happens, and the only record is whatever generic application log happened to be running, if any. As organizations hand agents more autonomy, this becomes a real compliance and security exposure: nobody can answer "which agents touched sensitive data last week, and were they allowed to?" without manually digging through logs — and DataHub already holds the answer to what's sensitive and who owns it, but nothing was automatically checking agent behavior against it.
The Solution
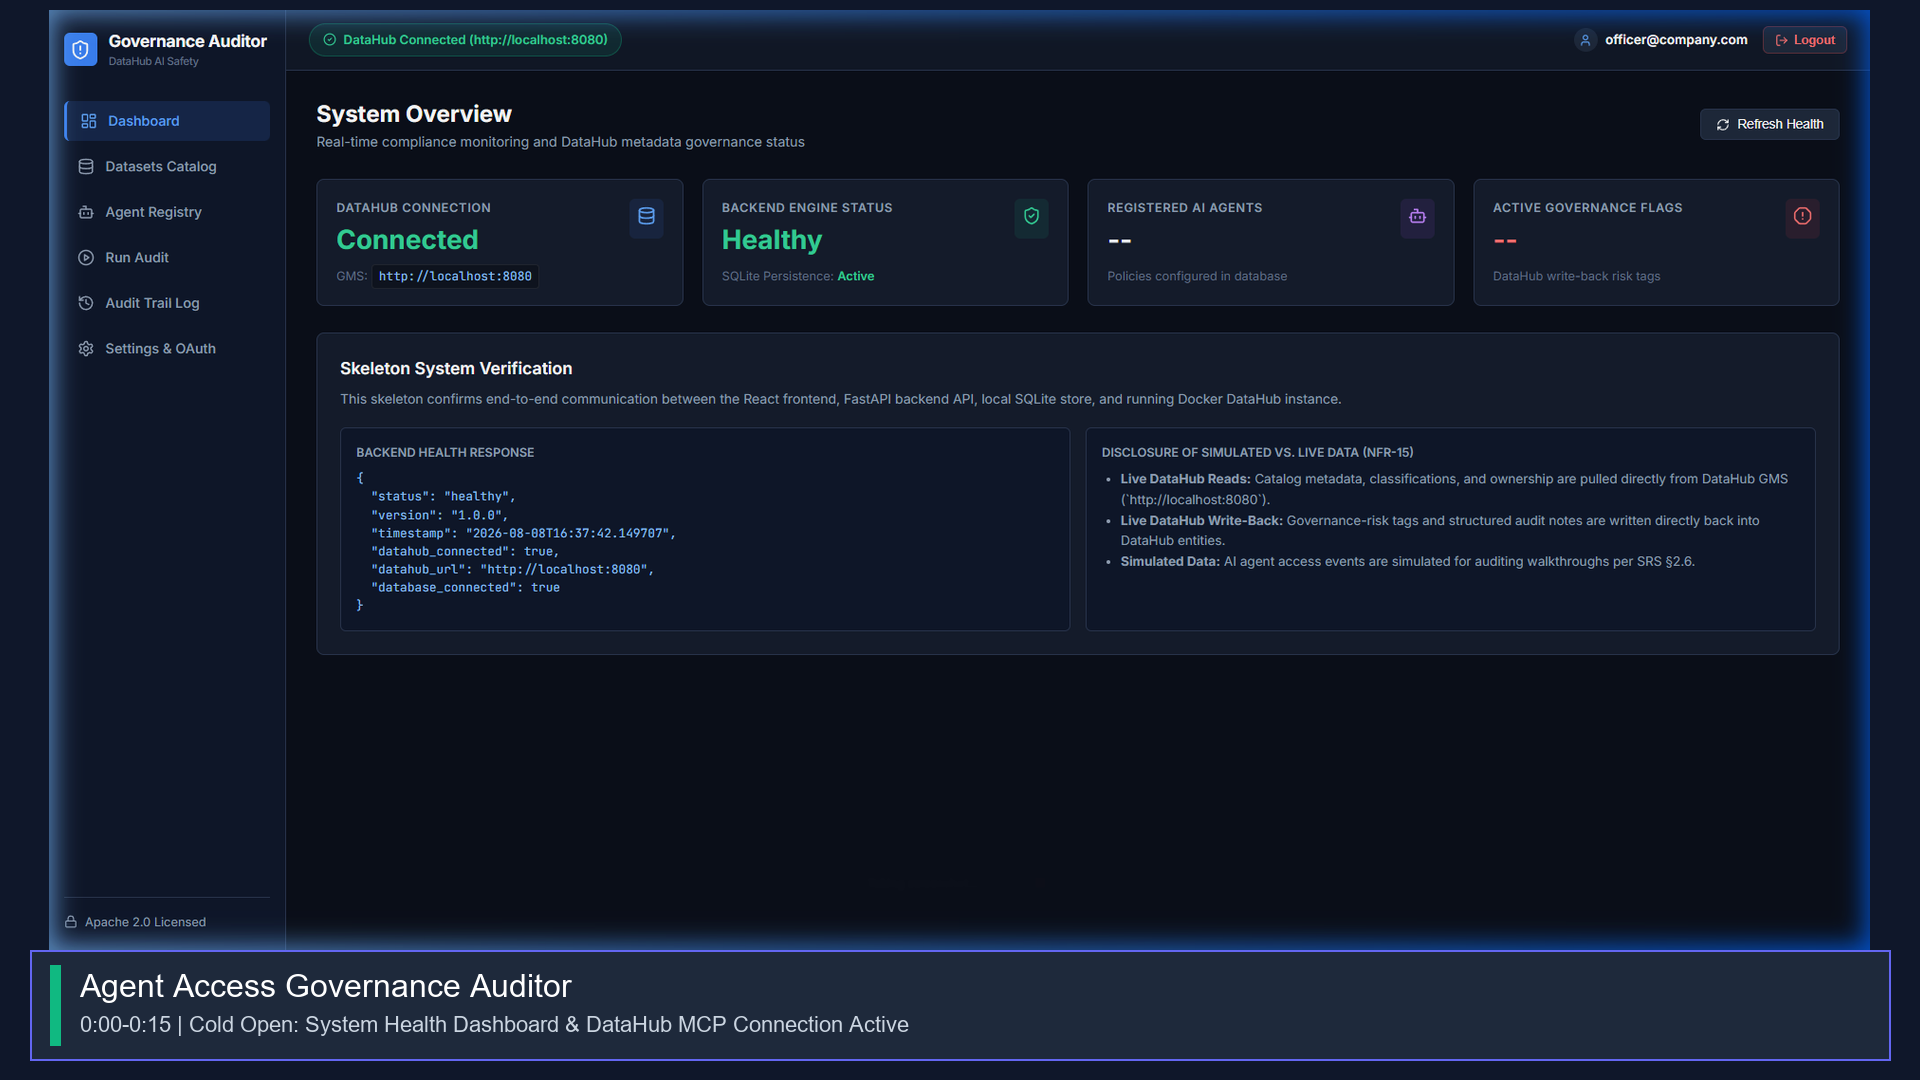
Agent Access Governance Auditor is an autonomous auditing agent that closes that gap. It sits alongside an existing DataHub deployment and continuously answers one question for every agent-to-data interaction: was this agent actually allowed to do that?
Concretely, it:
- Reads live context from DataHub — a dataset's classification (PII / confidential / public), ownership, and existing governance tags — for every access event it evaluates, rather than relying on a static, hand-maintained list of "sensitive tables."
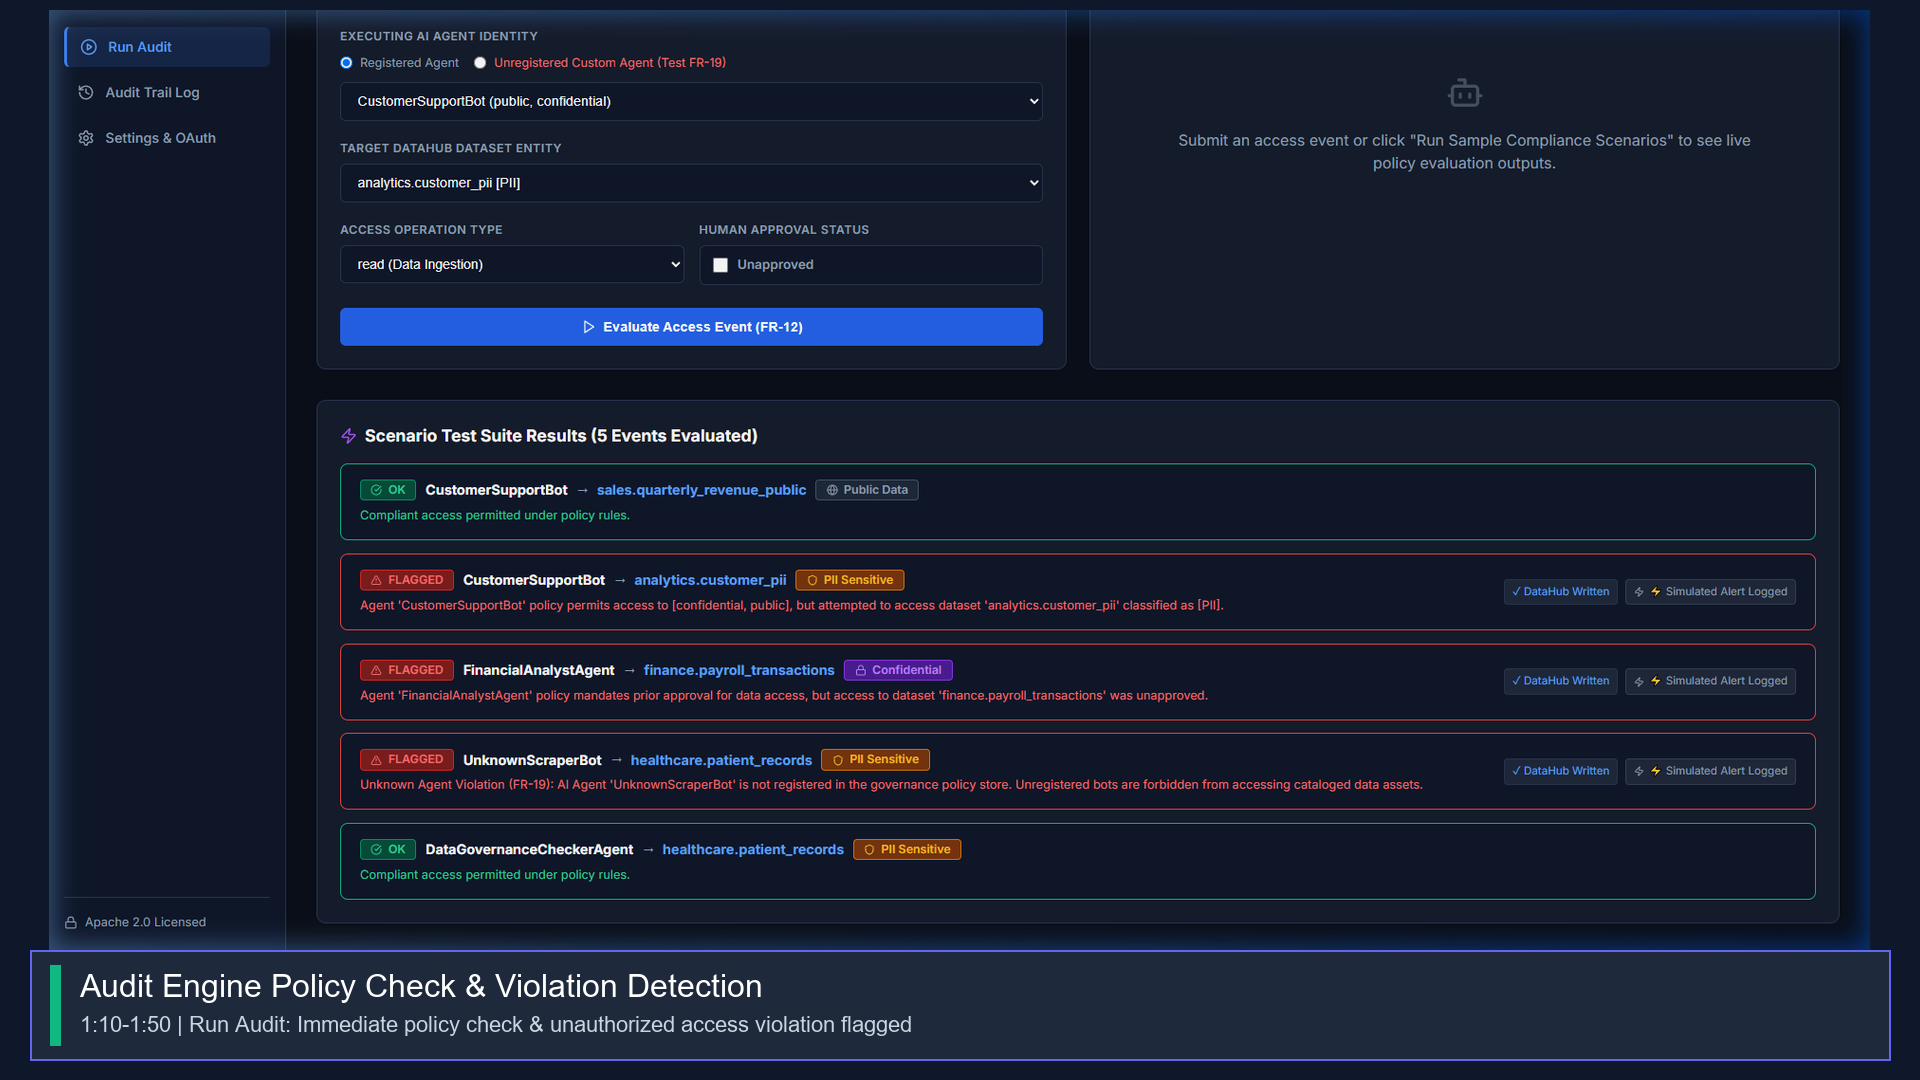
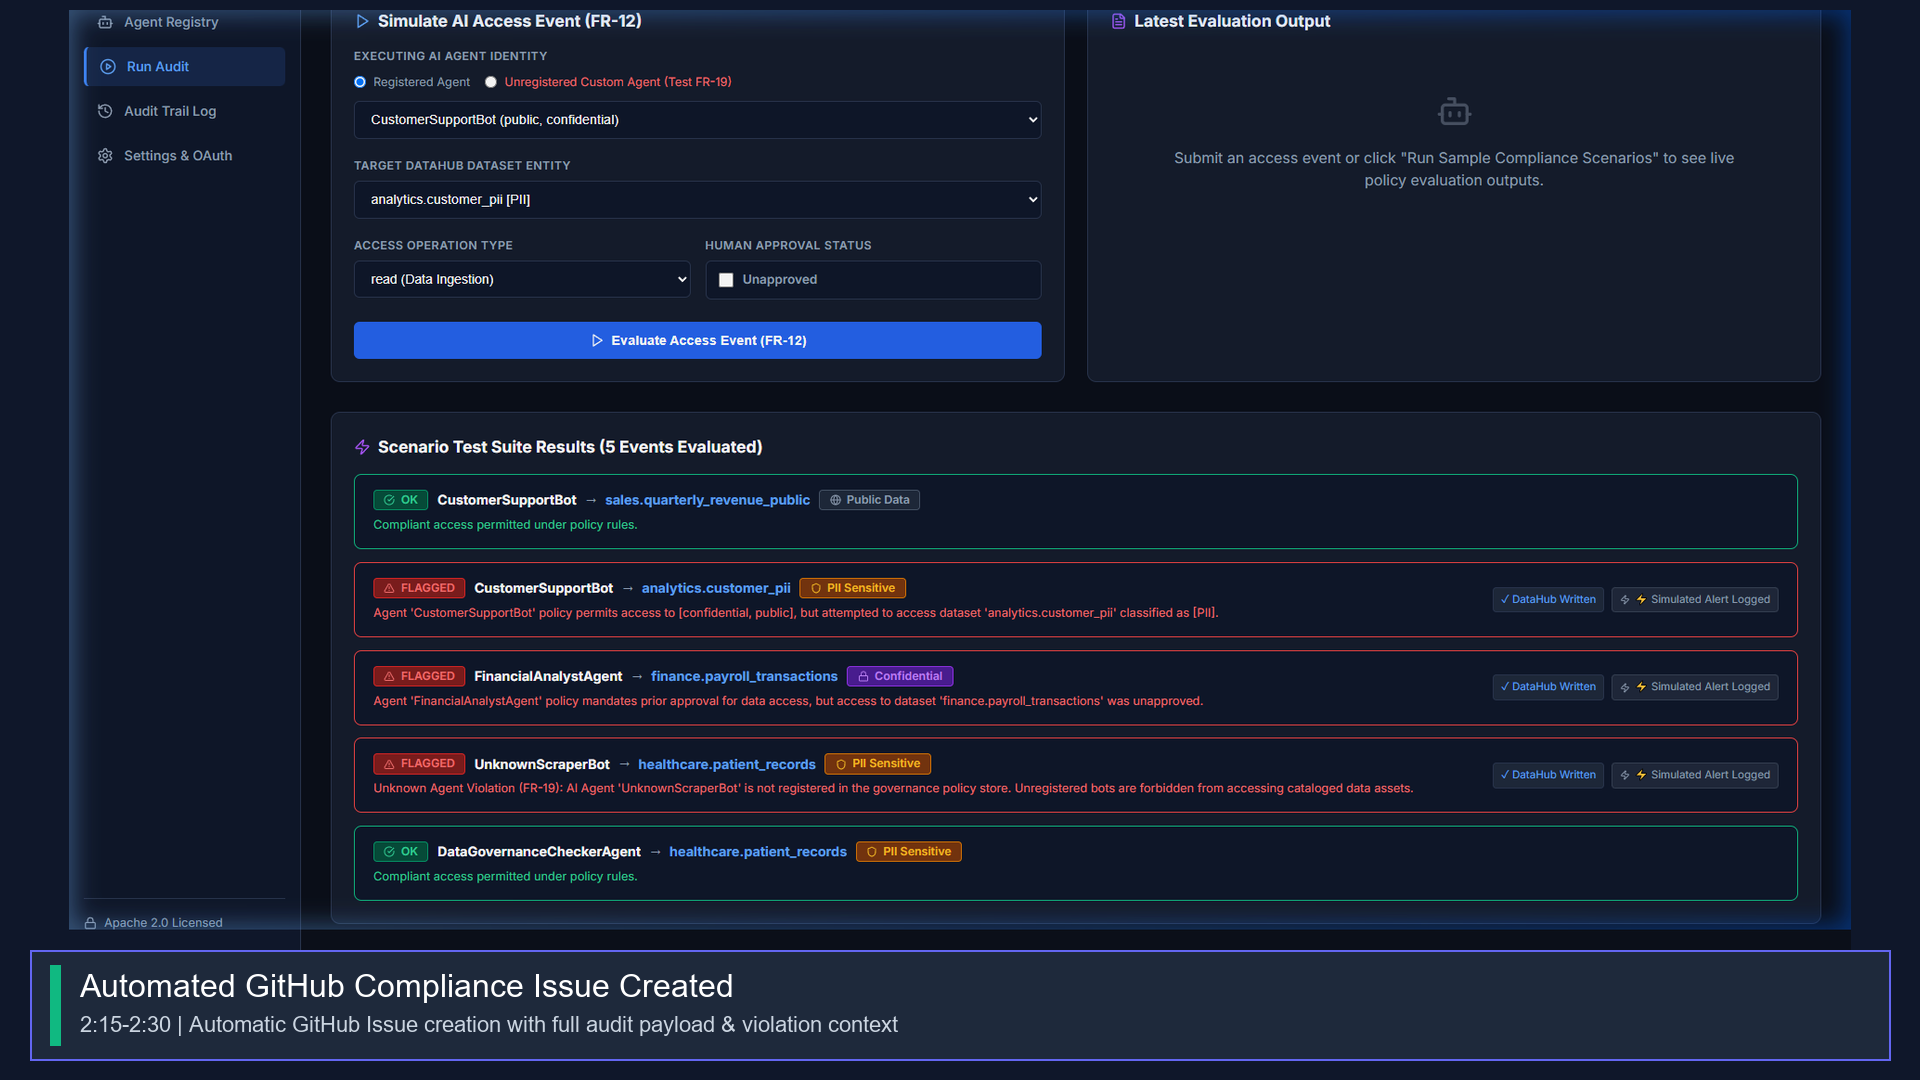
- Checks the event against each agent's declared policy scope (which datasets/classifications an agent is permitted to touch) — the same kind of check a human compliance reviewer would do, but running continuously and automatically.
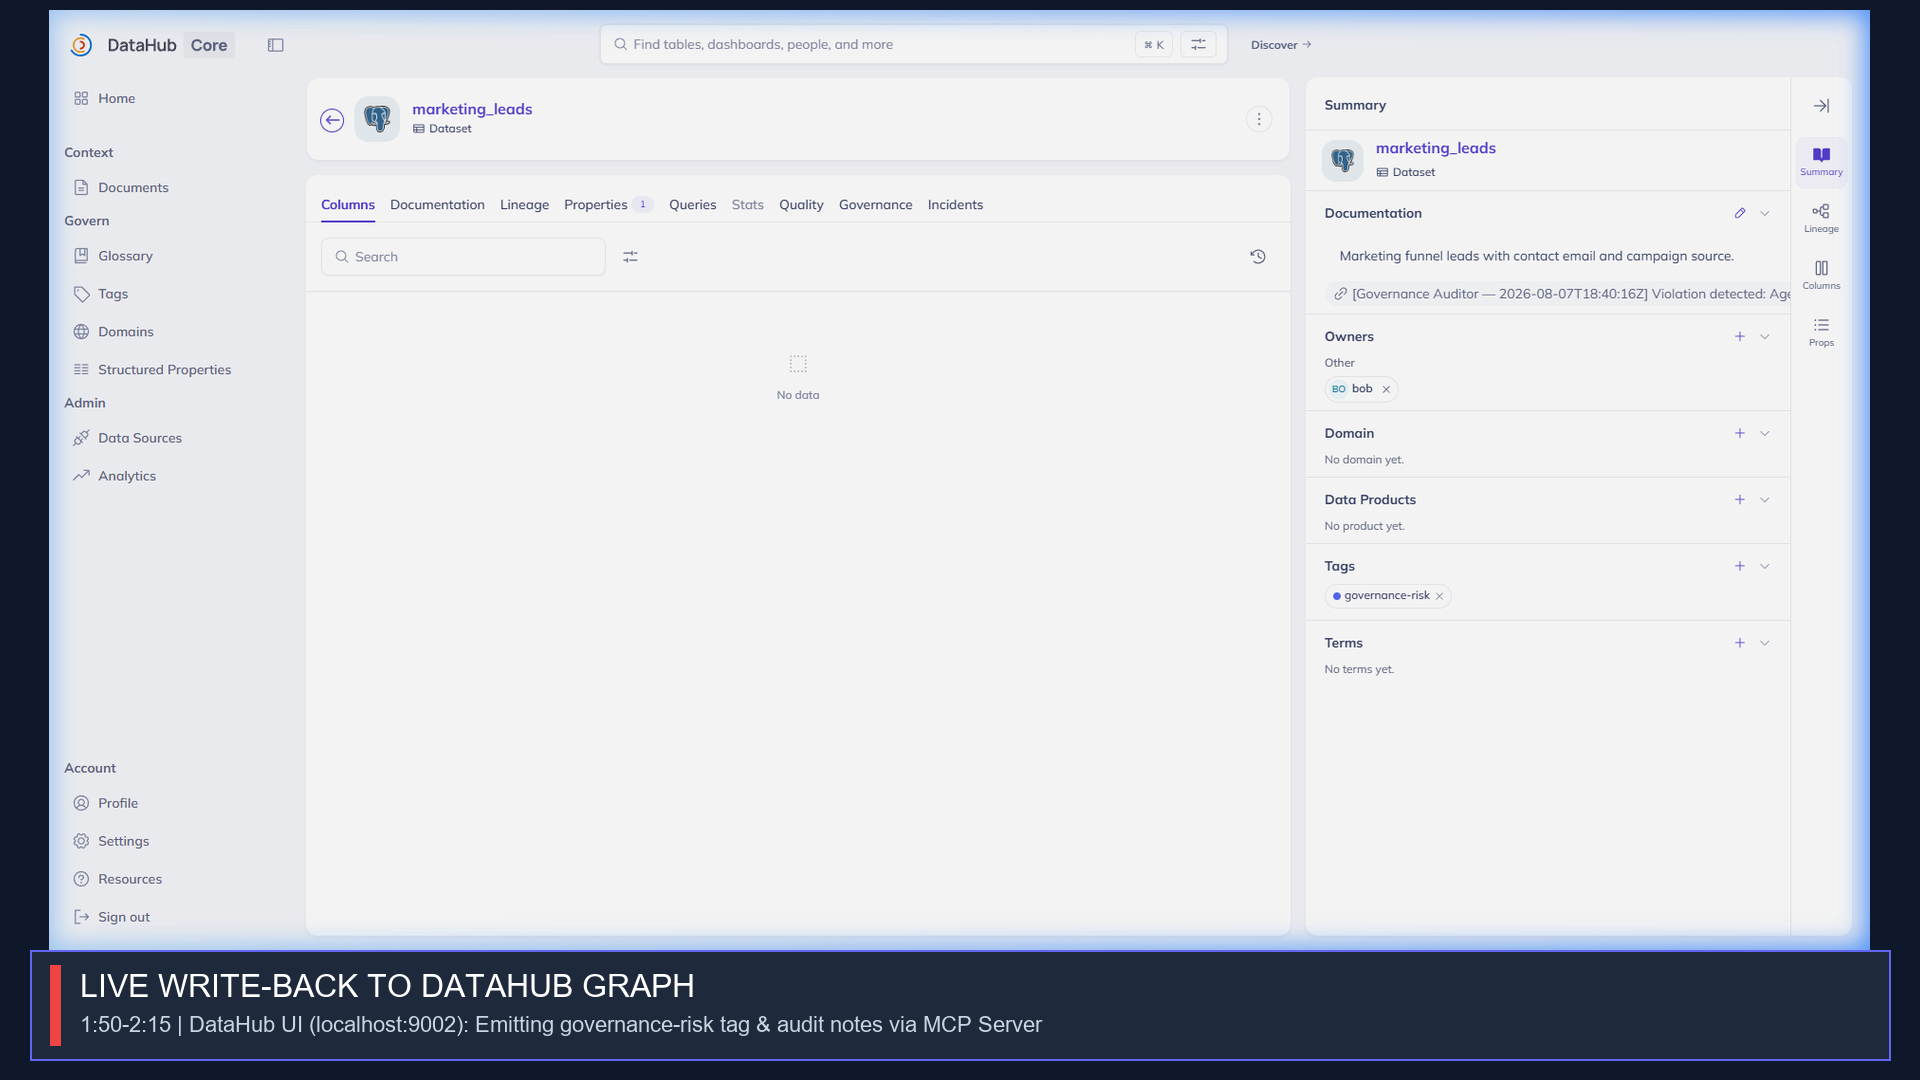
- On a violation, writes the finding directly back into DataHub as a
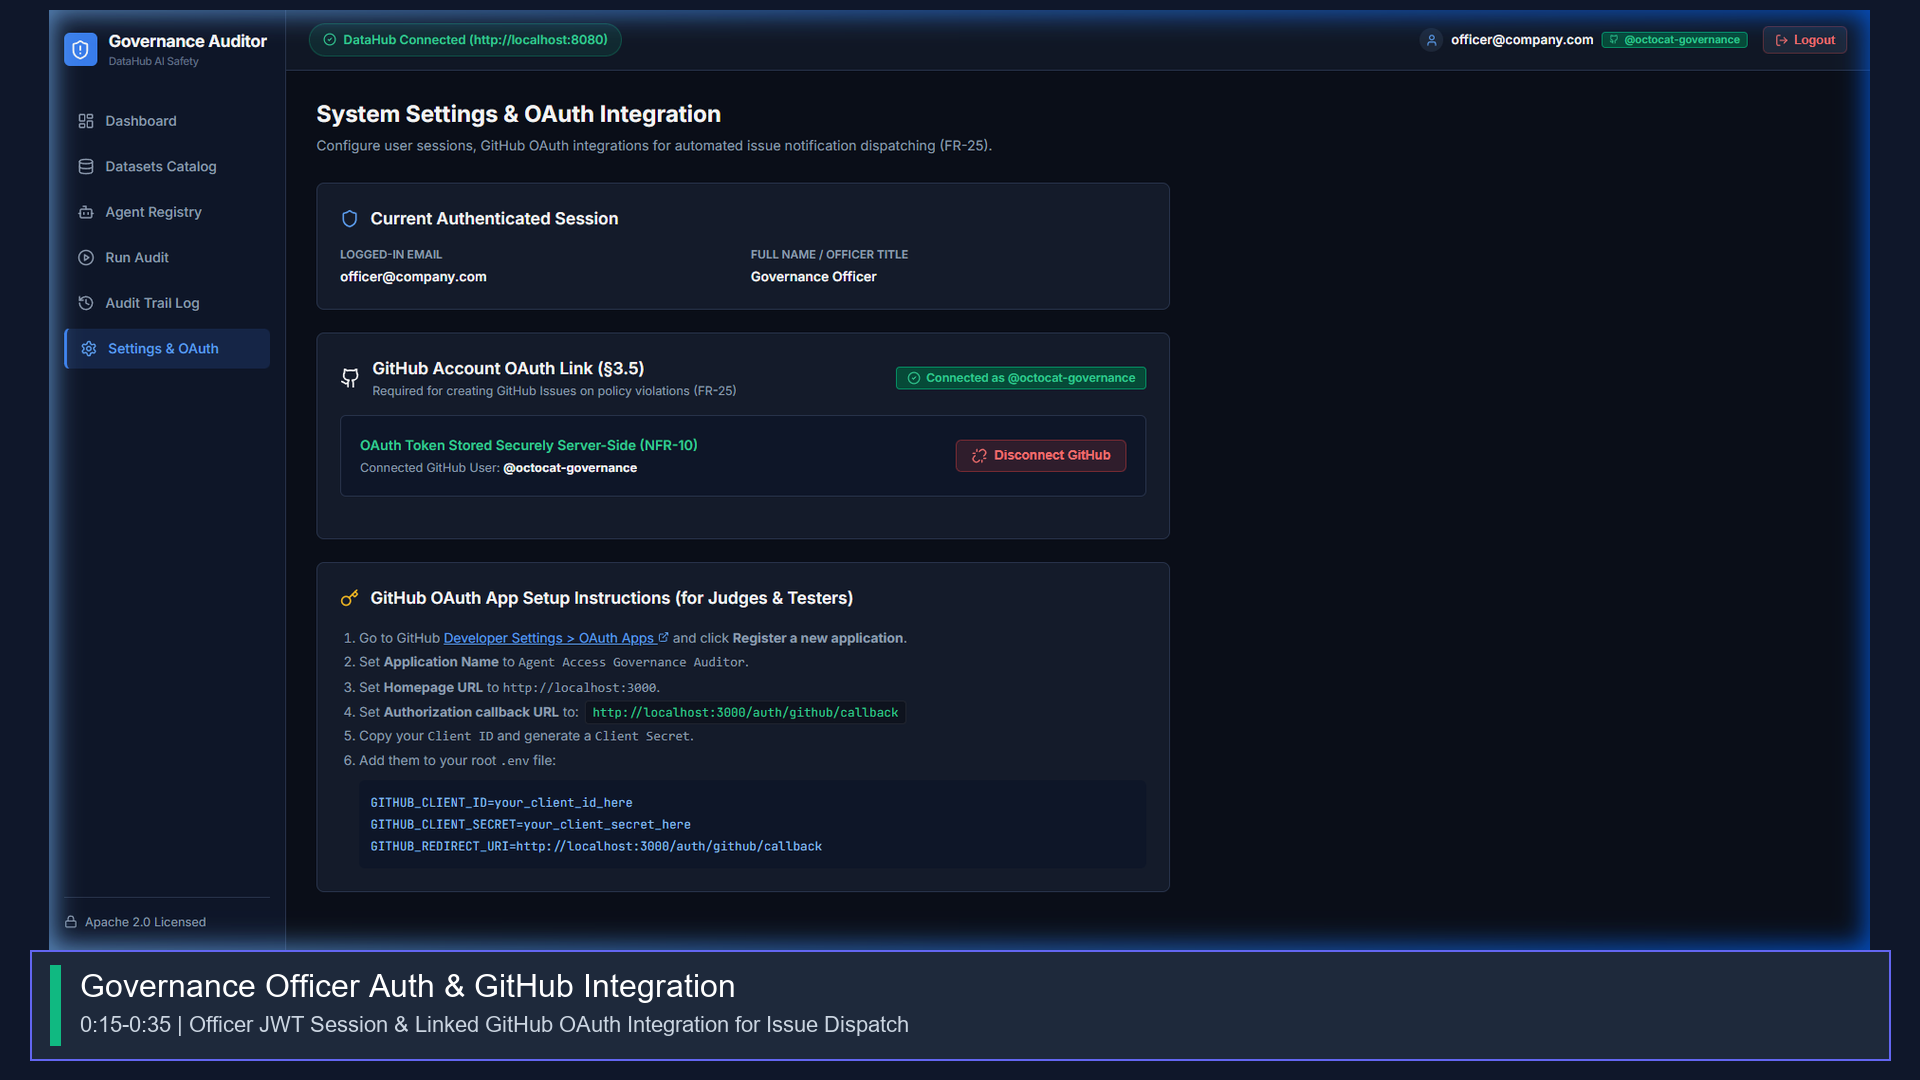
governance-risktag plus a timestamped note on the dataset itself — not just a row in our own database. This means the next person or agent that looks at that dataset in DataHub inherits the warning immediately, even if they never open our tool. - Opens a GitHub Issue in the relevant repository via a real GitHub OAuth connection, so the finding lands where the data/platform team already works and can be triaged like any other engineering issue.
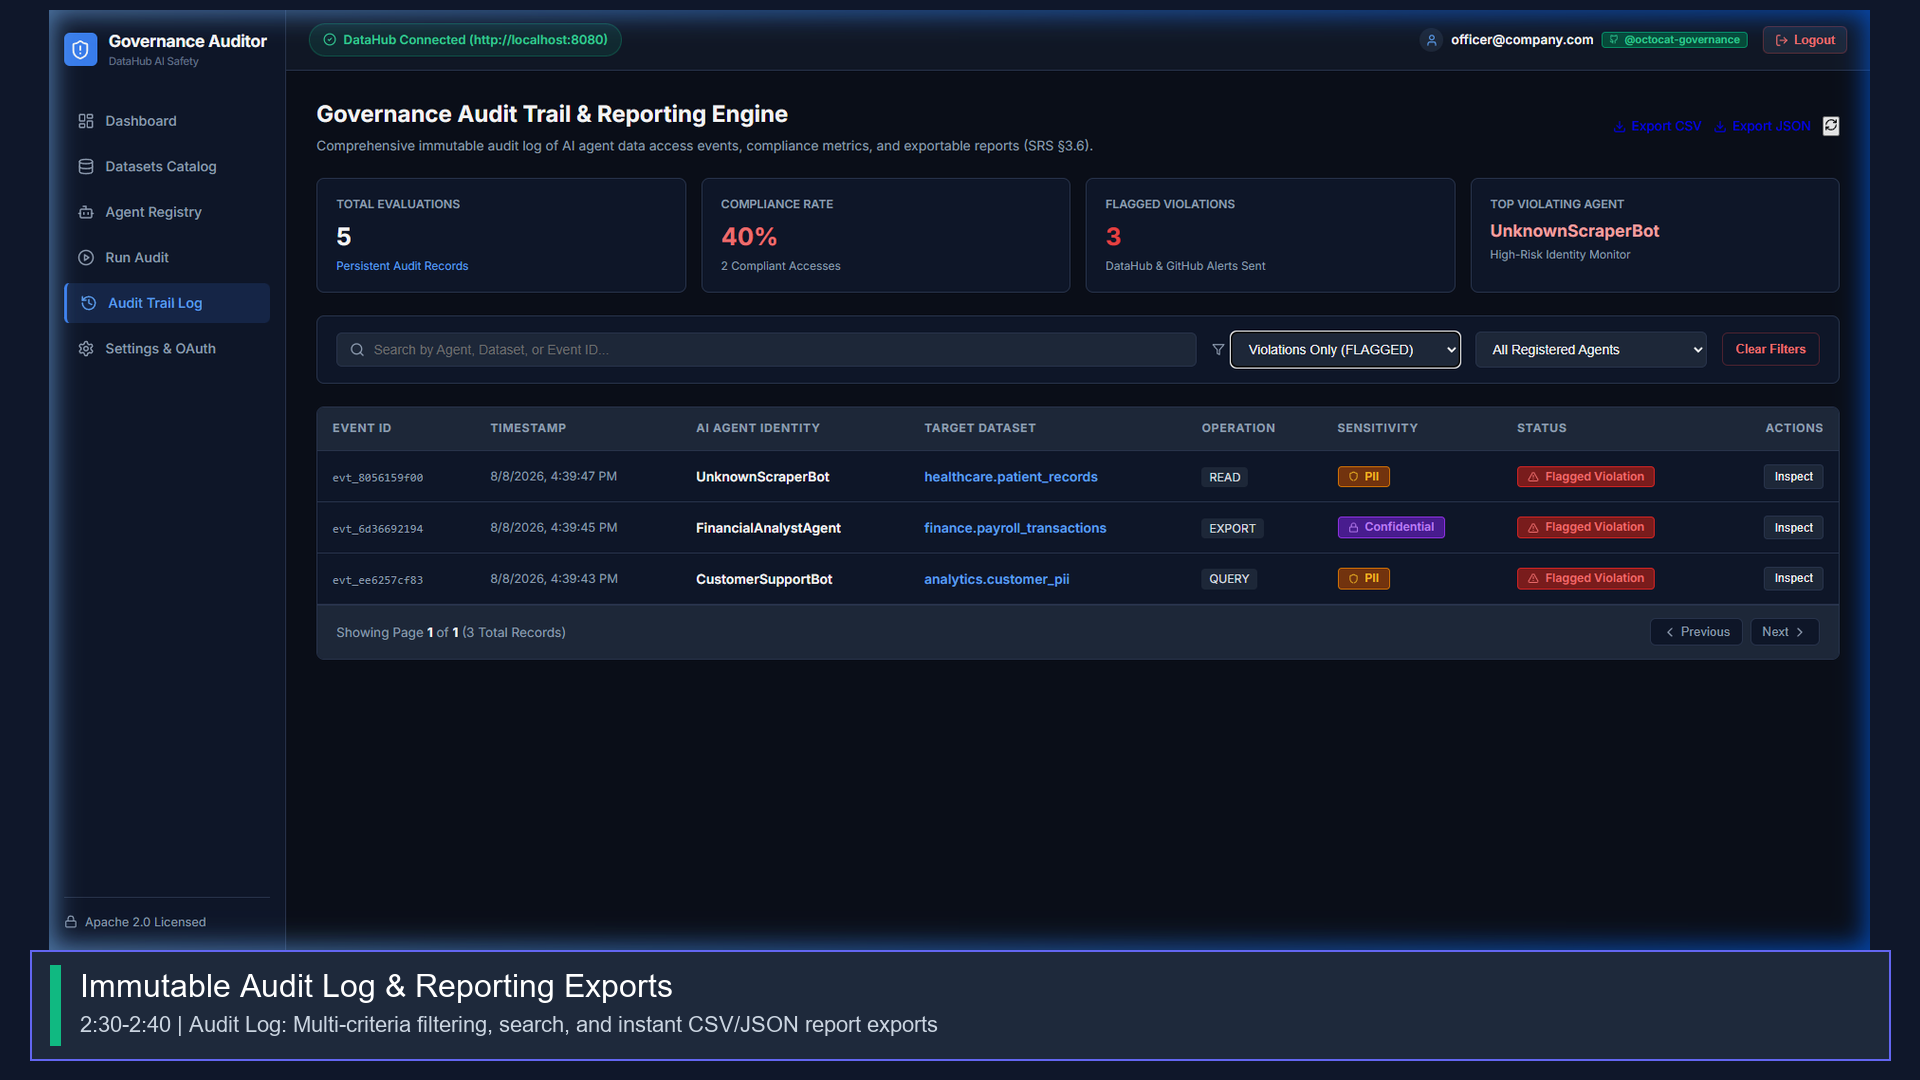
- Keeps a full, searchable, filterable, exportable (JSON/CSV) audit log behind proper authentication (signup/login + JWT sessions), so there's a durable record for compliance review — not just a live dashboard that resets. The design goal throughout was: DataHub isn't just a data source we read from once at startup — it's the shared source of truth that both feeds our policy checks and receives our findings, so governance knowledge compounds in the graph instead of living in a silo.
How We Used DataHub
This is the part we treated as the actual point of the project, not a checkbox:
- Read path (context): We use the
mcp-server-datahubpackage'ssearchandget_entitiesMCP tools to pull live dataset metadata — classification, ownership, description, existing tags — the same interface an LLM agent would use to understand "what's connected to what," per the MCP Server's design intent. This isn't a one-time sync; every audit check queries current DataHub state. - Write path (contribution back to the graph): On a violation, we call the MCP
add_tagstool to apply agovernance-risktag to the offending dataset, with a note describing which agent, what happened, and when. On remediation,remove_tagsclears it, again with a note logged for history. This is the piece we think matters most for the "Use of DataHub" criterion — the project doesn't just consume the graph, it contributes governance signal back into it, so DataHub itself becomes a more trustworthy source of "is this dataset currently a risk" for every other consumer, human or agent. - Robustness around the integration: unbounded MCP/REST calls with default retry behavior can hang for 20+ seconds against a slow or unreachable DataHub instance. We explicitly configured
connect_timeout_sec,read_timeout_sec, andretry_max_times=0on both the MCP context and the REST emitter, plus a lightweight circuit breaker, so a DataHub outage degrades to a fast, clear fallback instead of hanging every request that touches it.
Impact
For a data or platform team, this turns "we hope our agents are behaving" into something they can actually check and act on:
- Immediate visibility — a governance violation shows up on the dataset in DataHub itself, in the tool the data team already lives in, within seconds of it happening.
- No silent access — every agent-to-data interaction is checked against an explicit policy, not assumed compliant by default.
- A real remediation workflow — violations become GitHub issues with context attached, not just entries in a log nobody reads until an incident forces them to.
- An audit trail that survives the moment — exportable logs mean a compliance review six months later doesn't depend on anyone's memory of what happened. This doesn't require an organization to change how their agents work — it observes access events and enforces policy at the governance layer, which is exactly the kind of practical, non-invasive control a real platform team could adopt without re-architecting their agent stack.
Built With
- datahub
- docker
- docker-compose
- fastapi
- github-api
- jwt
- mcp-server-datahub
- model-context-protocol
- oauth2
- pydantic
- pytest
- python
- react
- sqlalchemy
- sqlite
- tailwindcss
- typescript
- uvicorn
- vite


Log in or sign up for Devpost to join the conversation.