-
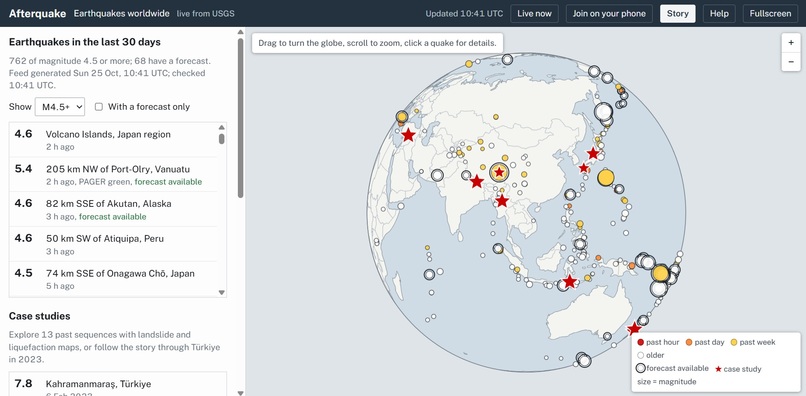
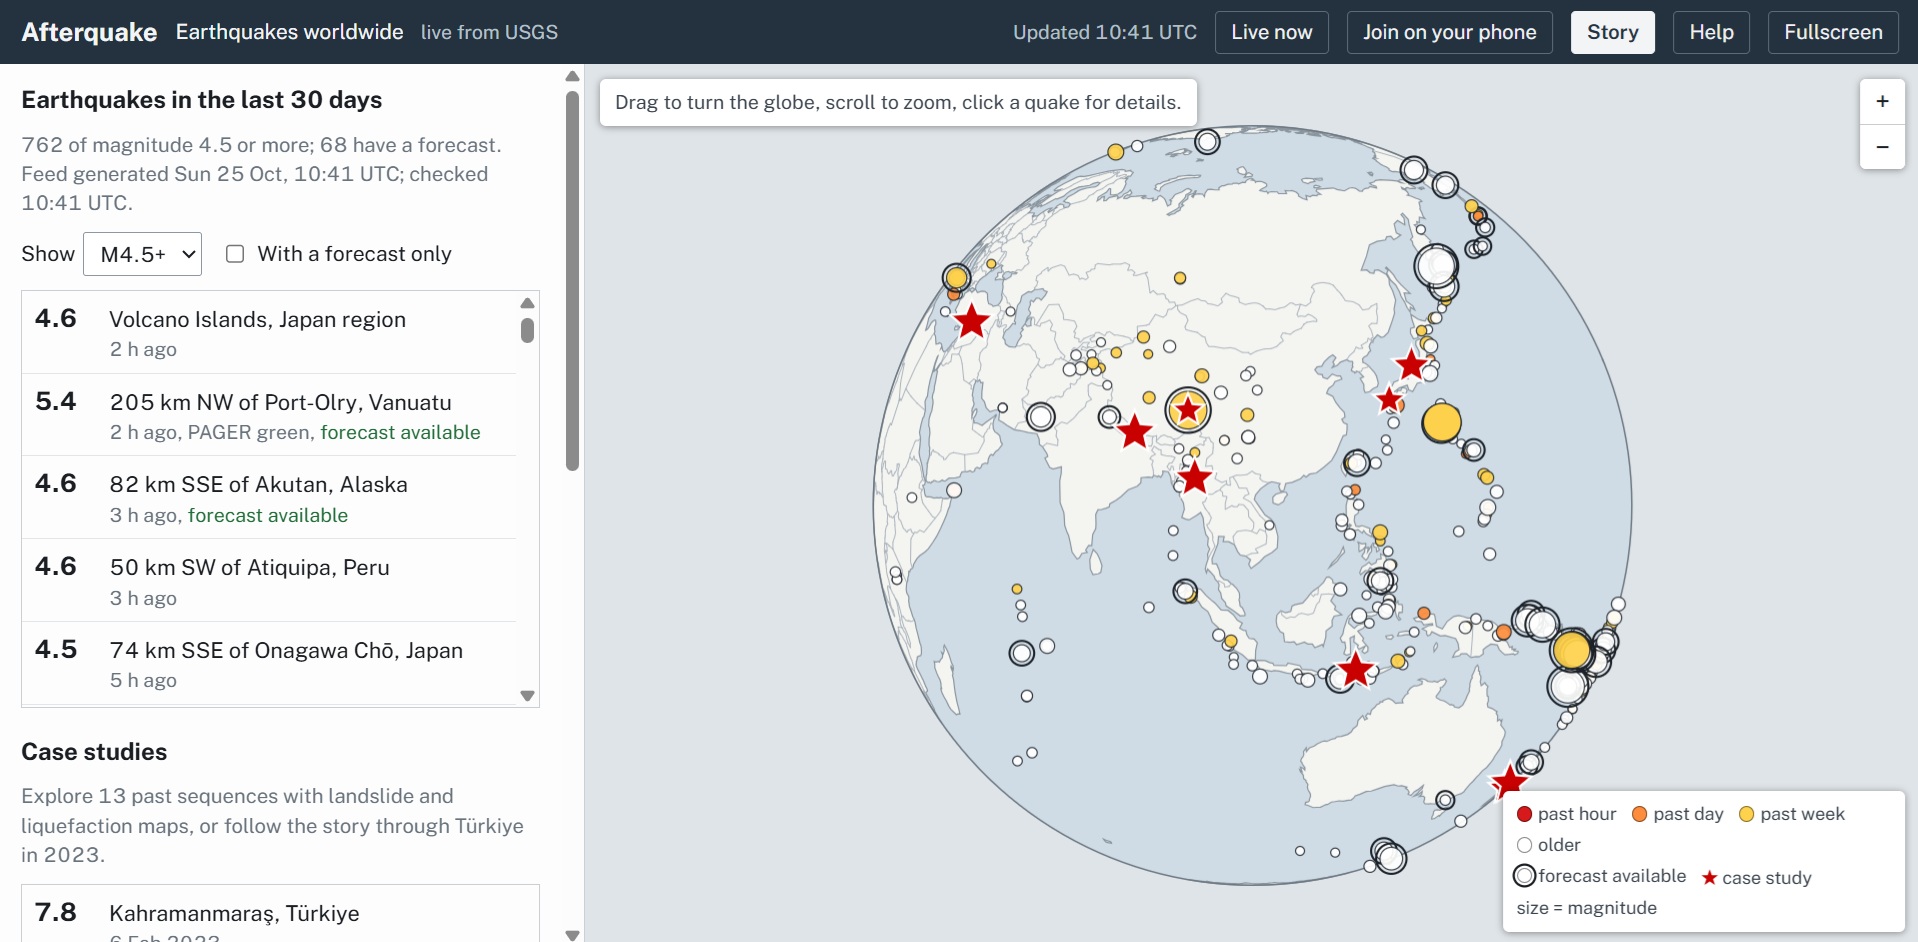
Interactive World Map
-
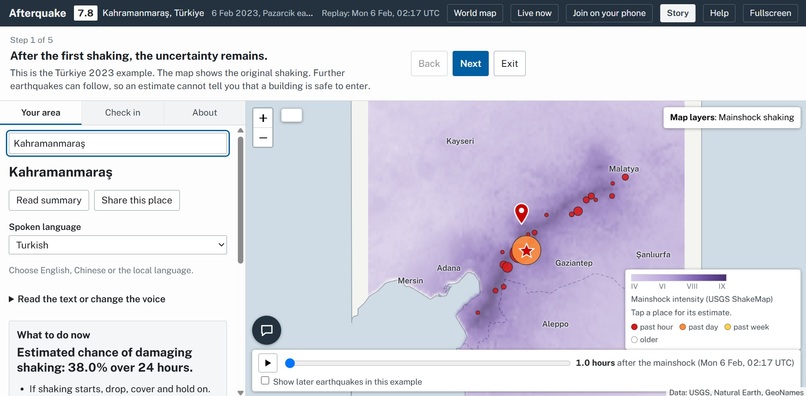
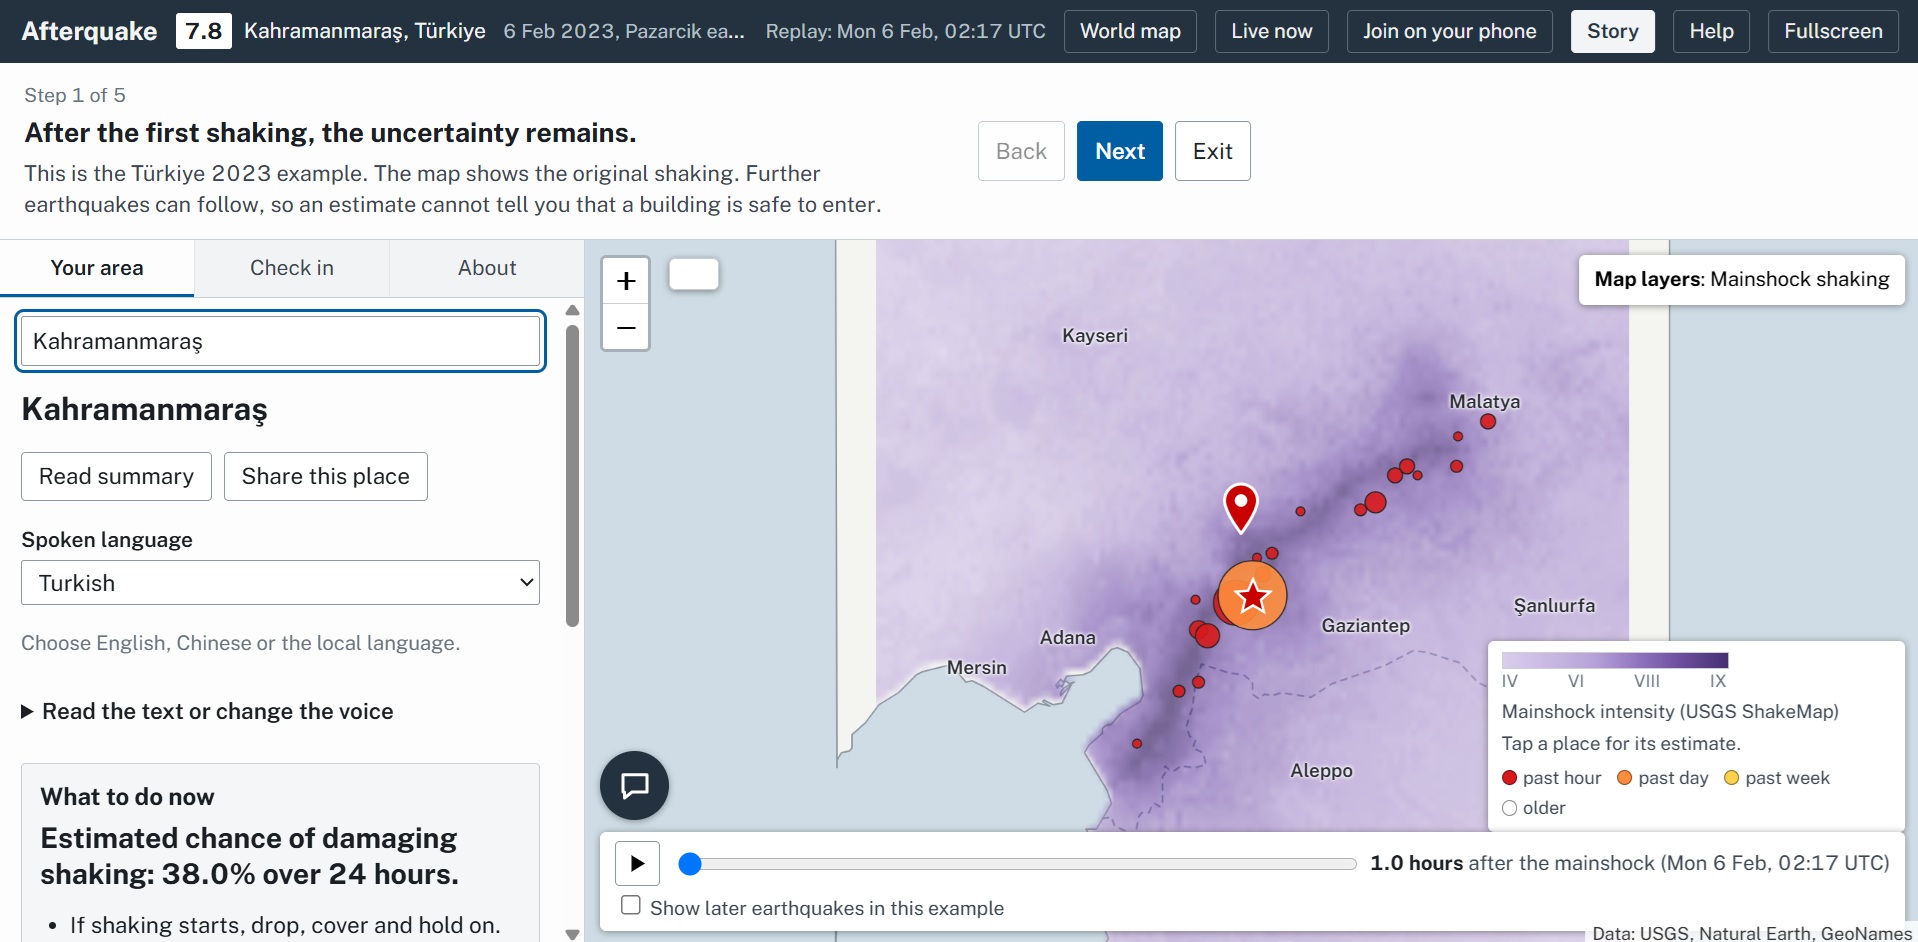
Story, showcasing our features
Inspiration
In September 2010, an M7.0 earthquake hit near Christchurch, New Zealand. Two people died. Five months later, a smaller M6.1 aftershock hit the city again. This time, 185 people died. It was smaller, but far deadlier because it hit buildings that were already damaged and people were unaware of the danger they posed.
News outlets scramble to report earthquakes. But nobody tells the survivors when it's actually safe to go home. Google tells you aftershocks "may occur", AfterQuake gives you the real answer.
What it does
Our user chooses their location on a map and the risk levels that they are comfortable to take to evacuate promptly; AfterQuake does the rest. AfterQuake doesn't just tell you you're in danger. Pick a spot on the map and it works out the chance of damaging aftershock shaking there, then turns it into a time where it's safe enough for the user to head to their nearest safe shelter. AfterQuake is dynamic, inclusive, and accurate: it runs on live USGS data for any recent earthquake, speaks the result in over 30 languages, answers questions without making numbers up, and lets people check in as safe or needing help from those around them.
How the app processes the data
We used data from public USGS data: the earthquake catalogue (every aftershock so far), ShakeMaps (how hard each spot shook and how soft the ground is), ground-failure maps (landslides and liquefaction) and PAGER (how buildings in each country hold up). 13 past earthquakes are built in so the app works offline, and any recent quake with a ShakeMap loads live.
The data AfterQuake processes and the decision it leads to:
- Calculates how many aftershocks: the Reasenberg–Jones model, updated with Bayes' rule every time a new aftershock arrives.
- Where the aftershocks will be: future aftershocks cluster around past ones.
- How much the quake would impact your specific location: a published shaking equation (Allen, Wald & Worden 2012), plus a soil correction we fitted ourselves to 86,234 USGS ShakeMap measurements.
- How this would impact the user: the shaking level where buildings in that country become dangerous, lowered if your spot already shook hard or the ground liquefied. Then we turn the chance into a time - when it drops below the risk the user chooses.
Stack
A web app hosted on Vercel, with Leaflet for the map, d3 for the globe, and with serverless routes for the three sponsor tools:
- Gemini answers questions through function calling. It has to call the page's own forecast tools before answering, so every number comes from our custom machine-learning model. It also translates the spoken summary, and a translation is rejected if any number changes.
- ElevenLabs (Flash v2.5) reads the summary aloud in over 30 languages.
- Tiger Data stores every USGS earthquake in a TimescaleDB hypertable. An hourly continuous aggregate draws the real aftershock rate against the model's prediction, and check-ins are stored as a second time series.
Challenges we ran into
- Making the data relevant to the user - "A 35% chance of an M6.2" means nothing to most people. It was important to turn probabilities into something actionable for our user: a time, at a risk level they choose.
- A bug that hid the risk. An early version kept only the 160 most likely model settings, which cut off the rare but dangerous scenarios. Fixing it moved Kahramanmaraş, seven hours in, to 9.2%.
- Live data is often not complete. When a quake as just occurred, its ShakeMap or PAGER report is often missing or a rough first version. The app retries, falls back to the next quake, and says when data couldn't load instead of showing the wrong answer.
Accomplishments that we're proud of
- This was the first overnight hackathon of two of our team members!!
- It works on live earthquakes. Any recent quake with a USGS ShakeMap gets a forecast in seconds, and it's scored live against what happens next.
- Our product has the potential to save lives. Two hours before the 2023 M7.5 in Türkiye, the model gave it 1.6%: unlikely, but not zero. That's why AfterQuake updates with every quake.
- It reaches people in their own language. Over 30 languages by voice, so the forecast gets to people whatever language they speak.
What we learned
- Most of the technologies we used in this project were new to us.
- We learnt to stop bombarding people with data. Nobody knows what 6.8 on the Richter scale means. Instead, translate that data into actionable, concrete instructions that people need when they feel the most scared and helpless.
- AI works best as a front end to a model, not a replacement for one. Making Gemini check our forecast before every answer stopped it inventing figures.
What's next for AfterQuake
- Other natural disasters: We would apply the same idea of turning data into a time to act on to hazards that come in waves, like flash floods and landslides after heavy rain, volcanic eruptions, and wildfires or storms.
- Alerts: We would send notifications when your re-entry time arrives, or when a new quake pushes it back.
- Better local data: We would integrate city soil maps and real building types from OpenStreetMap instead of a country average.
- Working with responders: We would link with emergency teams to turn the check-in board into a tool they can use to see who needs help and where they are.

Log in or sign up for Devpost to join the conversation.