Inspiration
I wanted to understand what happens to an entire city when we clear a path for one ambulance. Getting it to the hospital faster matters, but the queues left behind matter too.
AFTERLIGHT grew from wanting to make that tradeoff visible. You should be able to watch a response, inspect the signals and see who benefits and who waits longer.
What it does
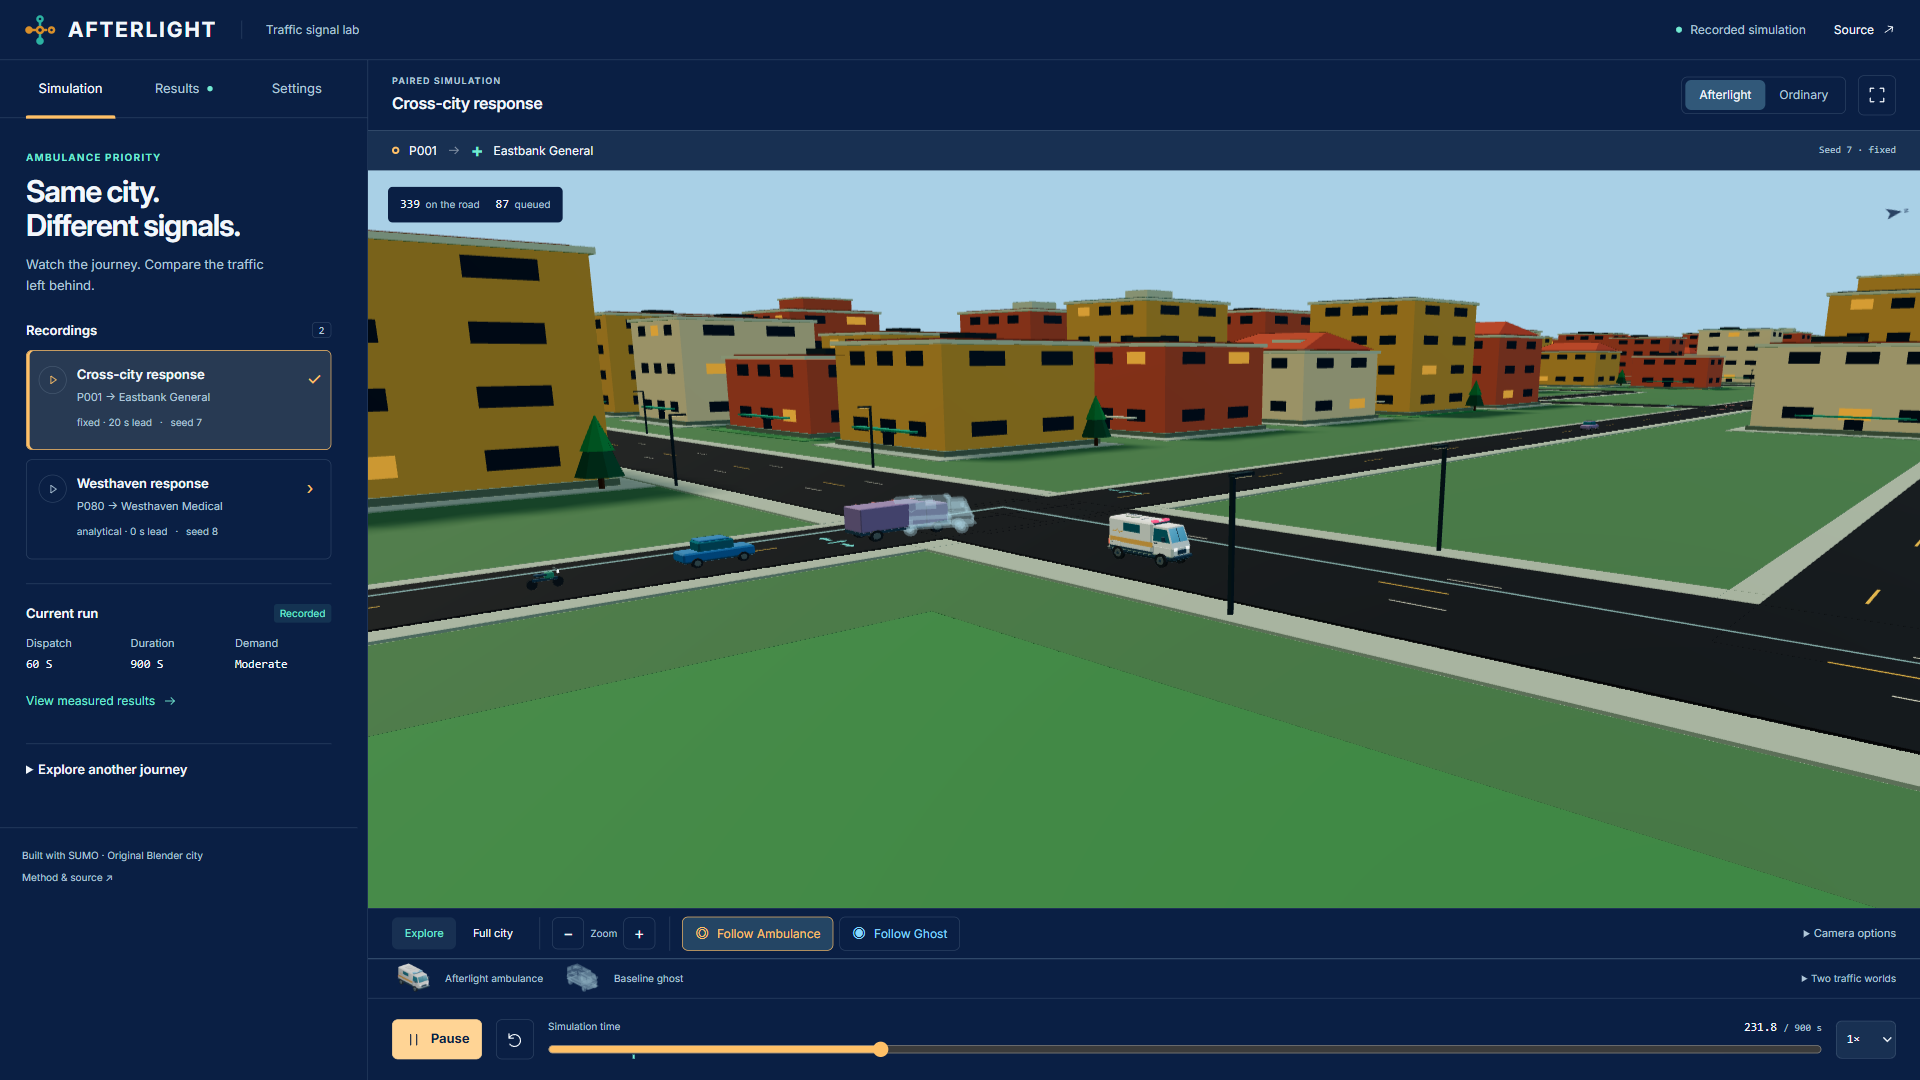
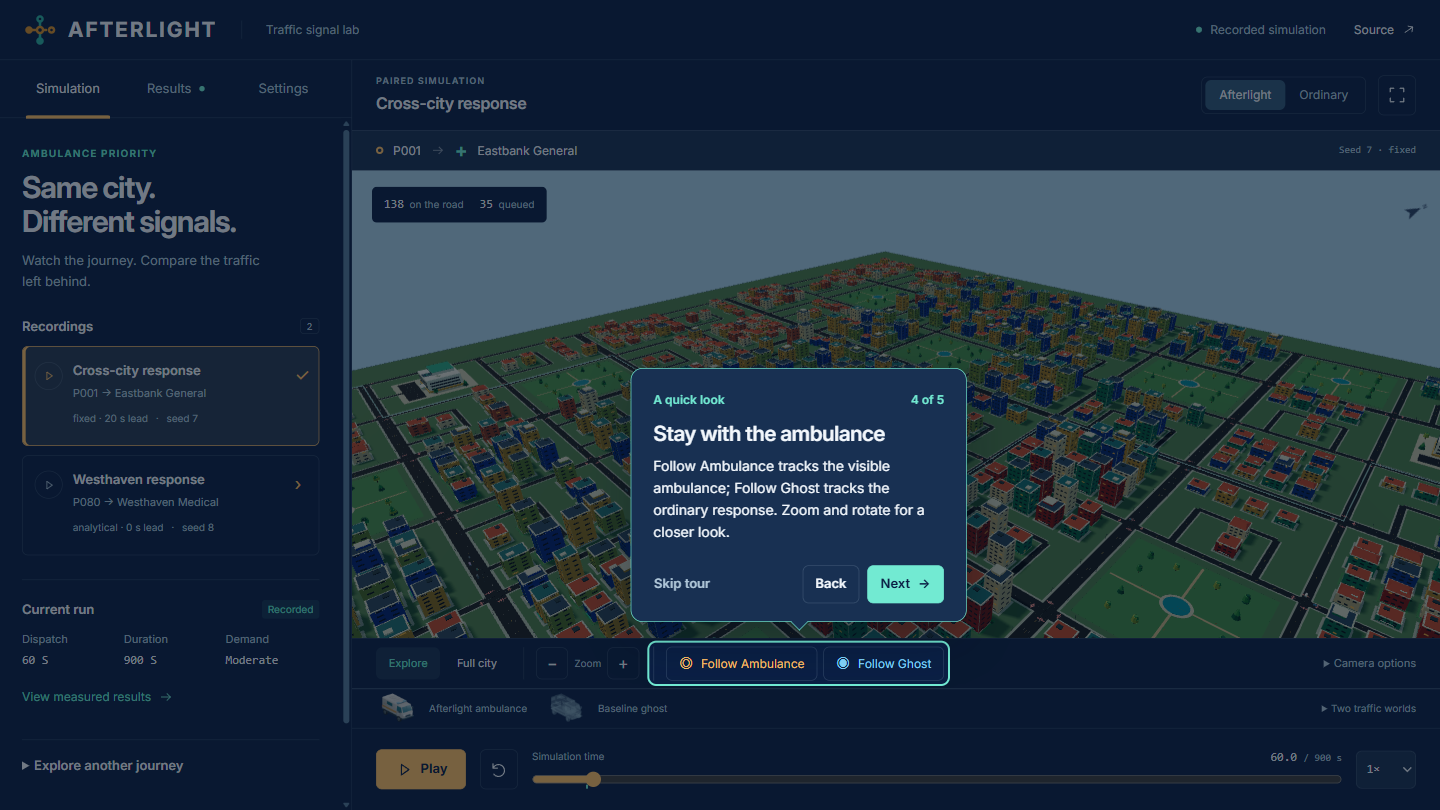
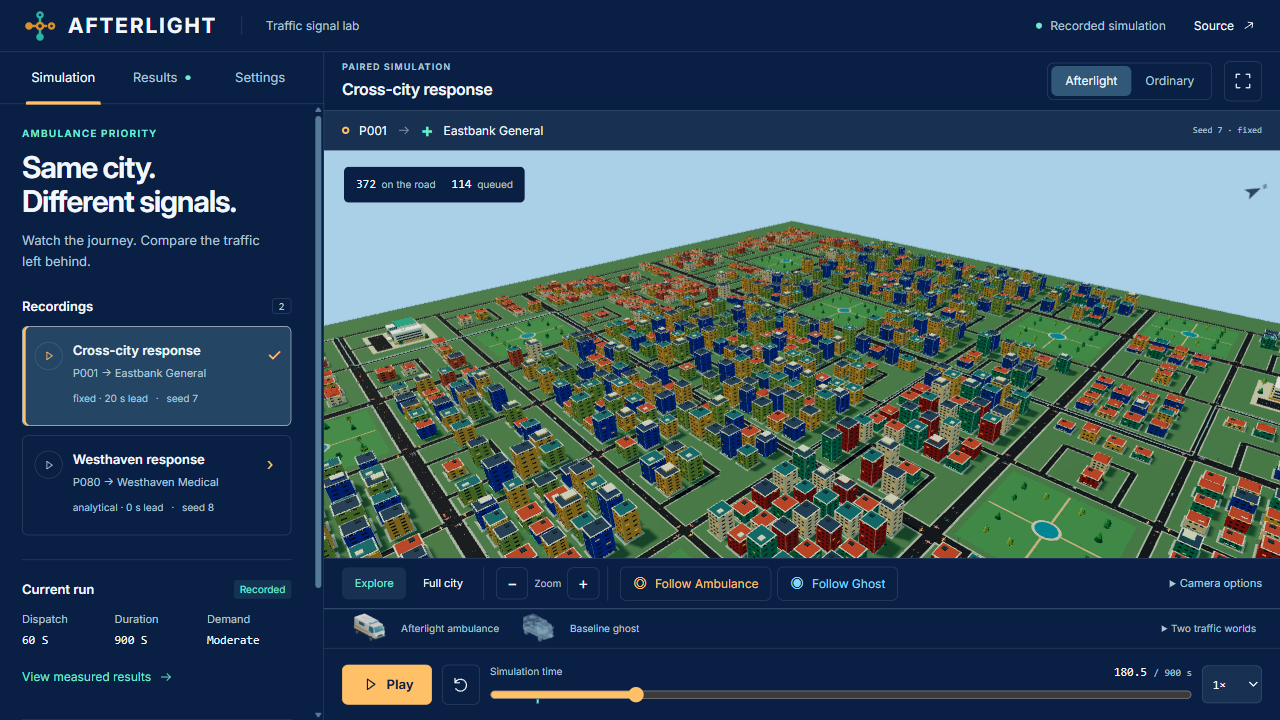
AFTERLIGHT is a desktop traffic signal lab that lets you follow an ambulance through two versions of the same city: ordinary signals and ambulance priority.
Each comparison shares the same scheduled traffic and ambulance route. The worlds develop independent queues and delays, while a translucent ghost shows the ordinary-world ambulance on the same clock.
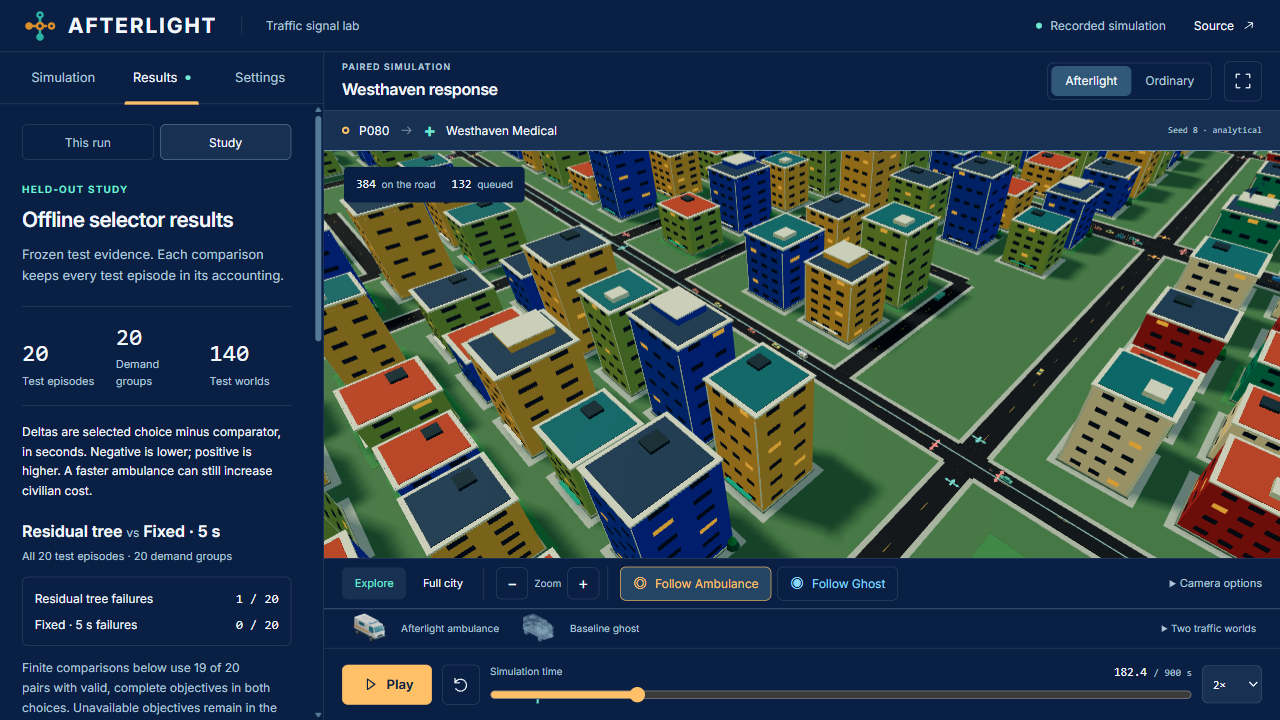
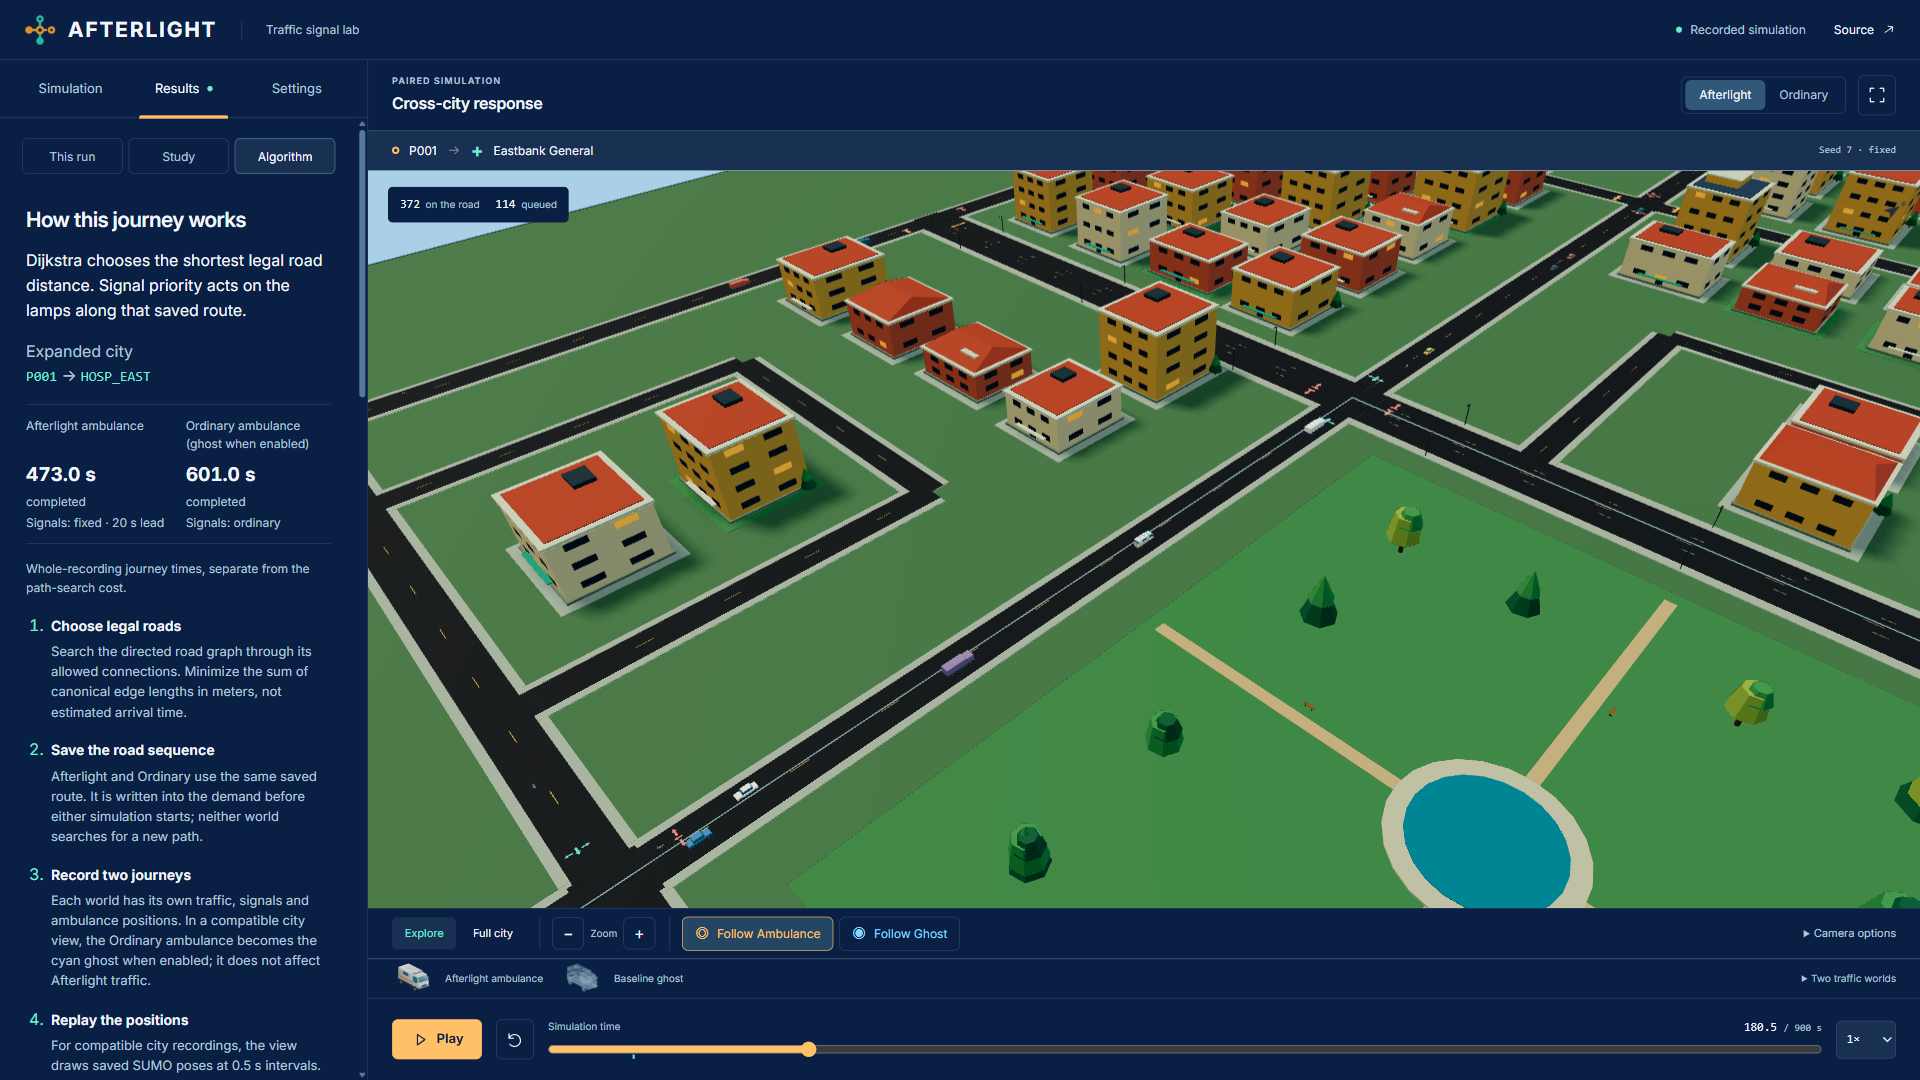
The city spans 4.1004 km², with 81 primary intersections, 826 buildings, mixed traffic and two hospitals. Users can follow either ambulance, inspect signals, pause, scrub and compare outcomes. The Algorithm view explains the exact route and how the recorded journey reaches the screen.
How I built it
I built the simulation pipeline with Python, SUMO and TraCI, and the browser viewer with React, TypeScript and Three.js.
A shared network definition keeps road geometry consistent between simulation and rendering. Distance-based Dijkstra finds permitted routes, while a constrained scheduler handles signal priority and phase transitions.
Created original assets in Blender through Blender MCP, developed the identity with Canva, and deployed on Vercel. ChatGPT/Codex assisted with implementation, procedural assets, testing and analysis tooling.
The public site replays audited recordings. Simulation, model training and evaluation run separately from the browser.
Challenges I ran into
Keeping the visualization trustworthy took substantial work. Vehicle positions, road surfaces, signals and playback time had to agree. The ghost needed to remain clearly identifiable as a vehicle from a separate traffic world.
Camera movement also exposed flickering road surfaces. I corrected depth handling and overlapping geometry, then checked 18 repeated paused-camera image pairs across two desktop profiles.
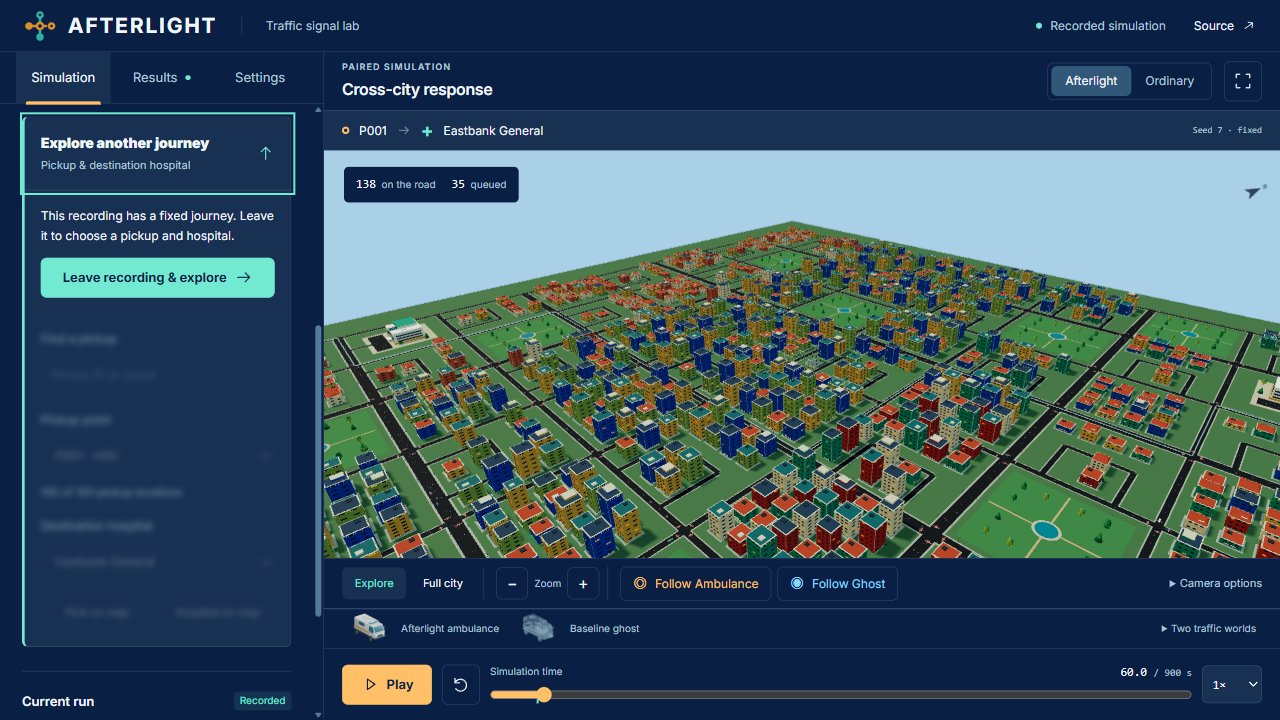
The interface needed several revisions. I kept playback and camera controls visible beside the map, added first-visit onboarding, and made recording-specific journey controls visibly locked until users choose to explore.
Accomplishments that I'm proud of
- Measurable examples: the cross-city recording reduced ambulance journey time from 601 to 473 seconds, with mean civilian excess travel time increasing 2.19 seconds. Westhaven saved 104 seconds, with a 1.14-second increase. These are exploratory examples.
- A complete desktop product: the release fits within 46.97 MB, including models, recordings, evidence and a walkthrough.
- Measured rendering performance: separate 30-second windows recorded 152.5 FPS overview and 129.7 FPS close follow on the tested Ryzen 9 5900HX desktop with integrated AMD graphics.
- Inspectable evidence: source checks passed 811 automated tests, with five explicit skips. Published results include per-case outcomes and an independently verifiable proof pack.
What I learned
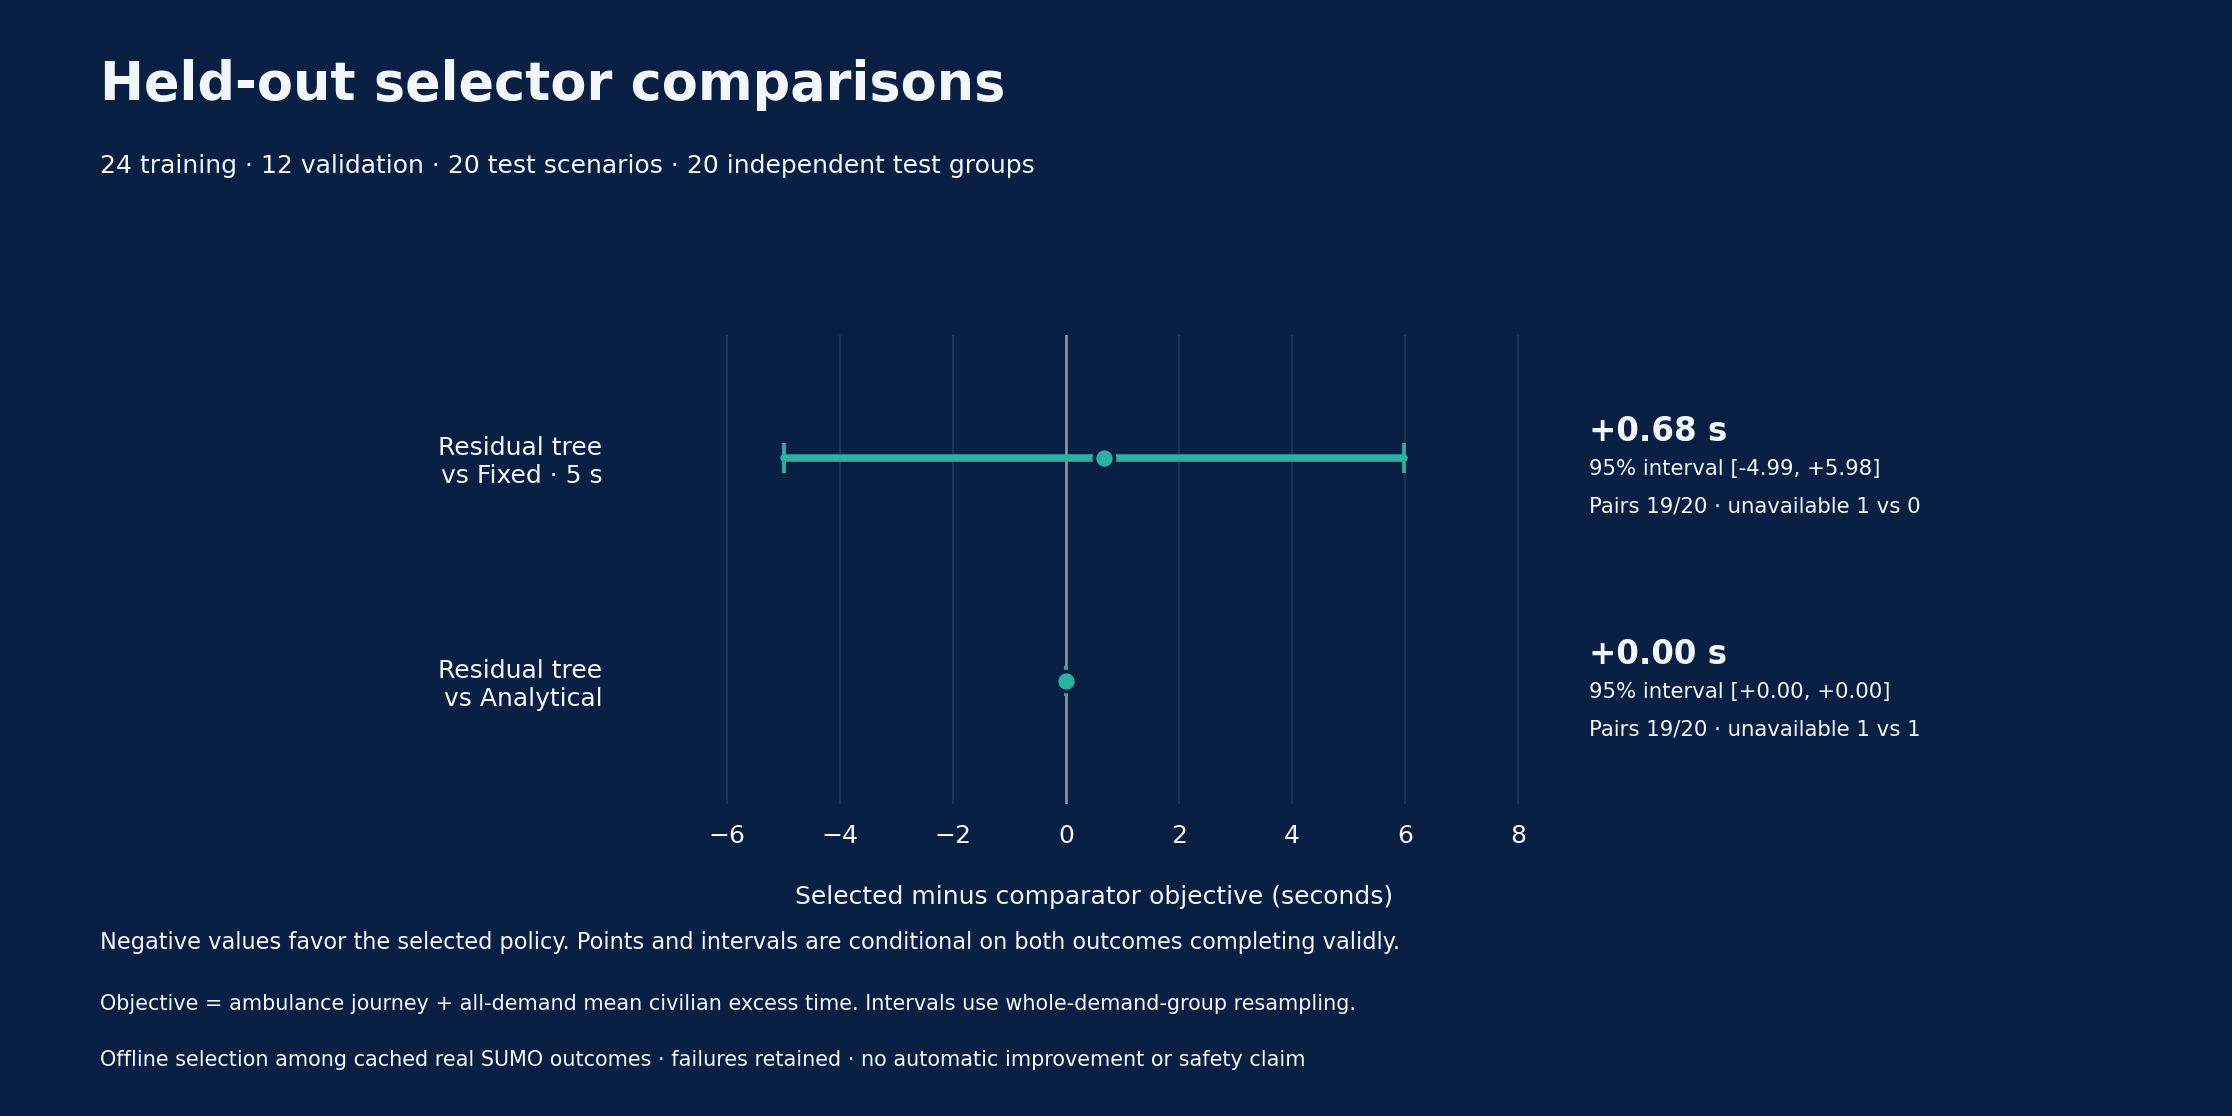
The frozen study used 24 training, 12 validation and 20 test episodes. The learned selector chose the same actions as the analytical method in all 20 test episodes. Against the tuned fixed-lead comparator, it had one failure versus zero.
That result shaped the project. We learned to separate software correctness, visually compelling examples and evidence of policy improvement. Failed runs remain visible, and the product explains what its measurements support.
What's next for Afterlight
I want to evaluate priority strategies across more varied road networks, traffic conditions and emergency routes through new, separately defined studies.
I also want to improve queue inspection and comparison tools so users can understand where delays move after an ambulance passes. Any future learned controller should earn its place through measured improvements against strong baselines.
