-
-
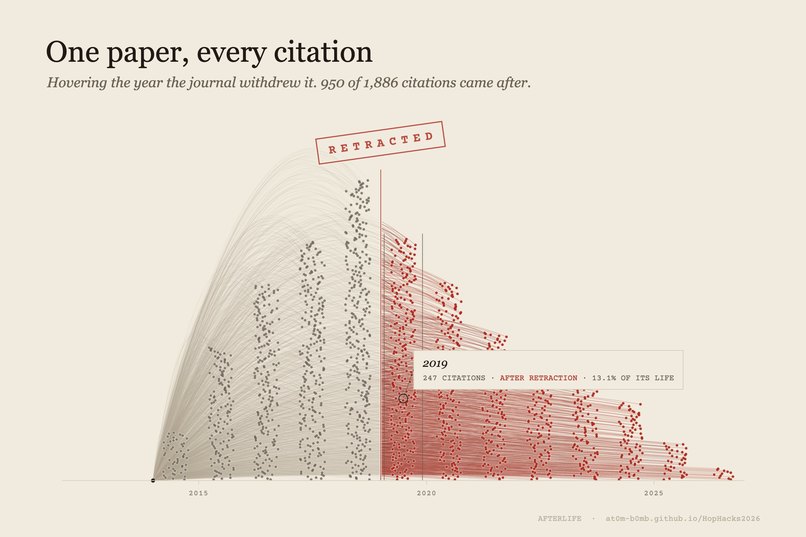
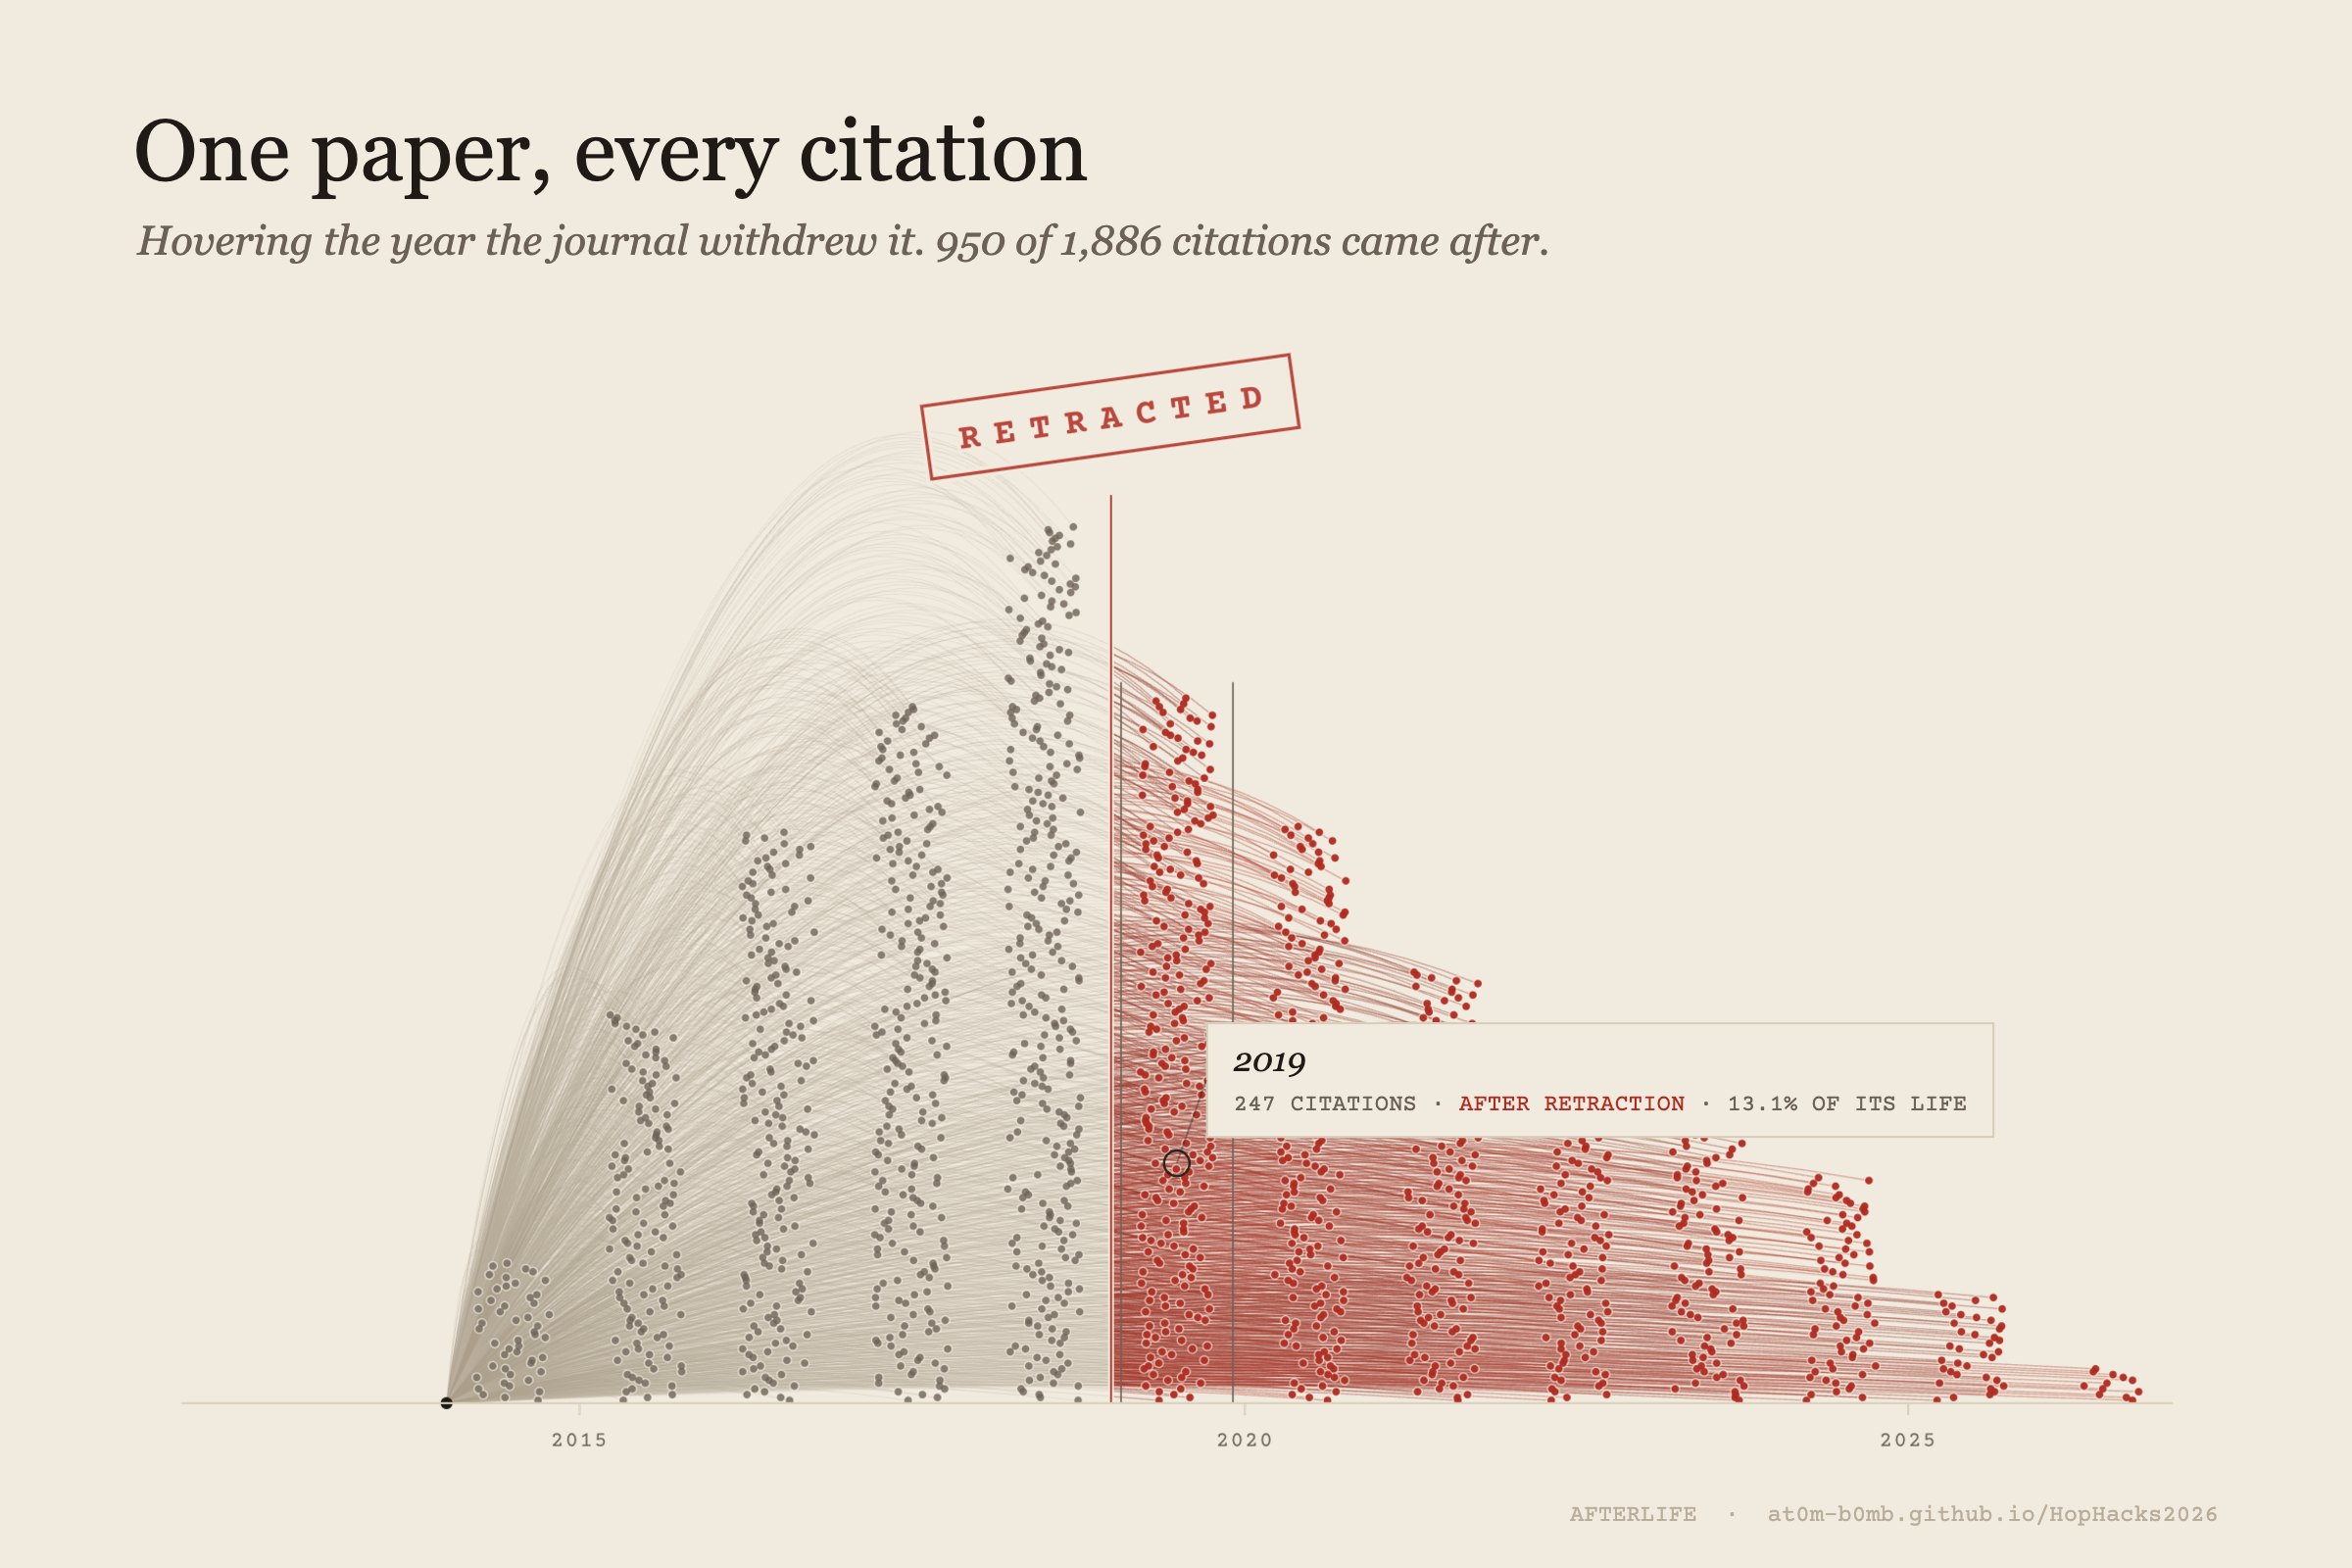
Every line is one real citation. Grey landed while the paper still stood, red after. Hovering any year reads out that year's count.
-
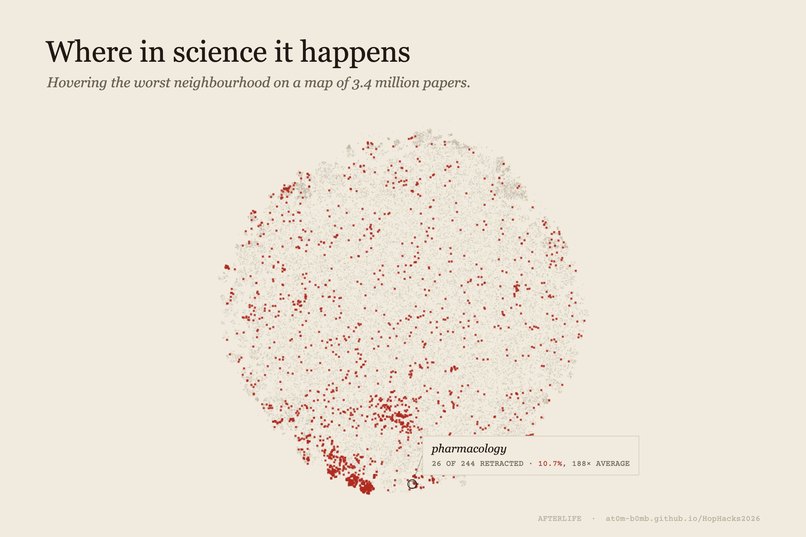
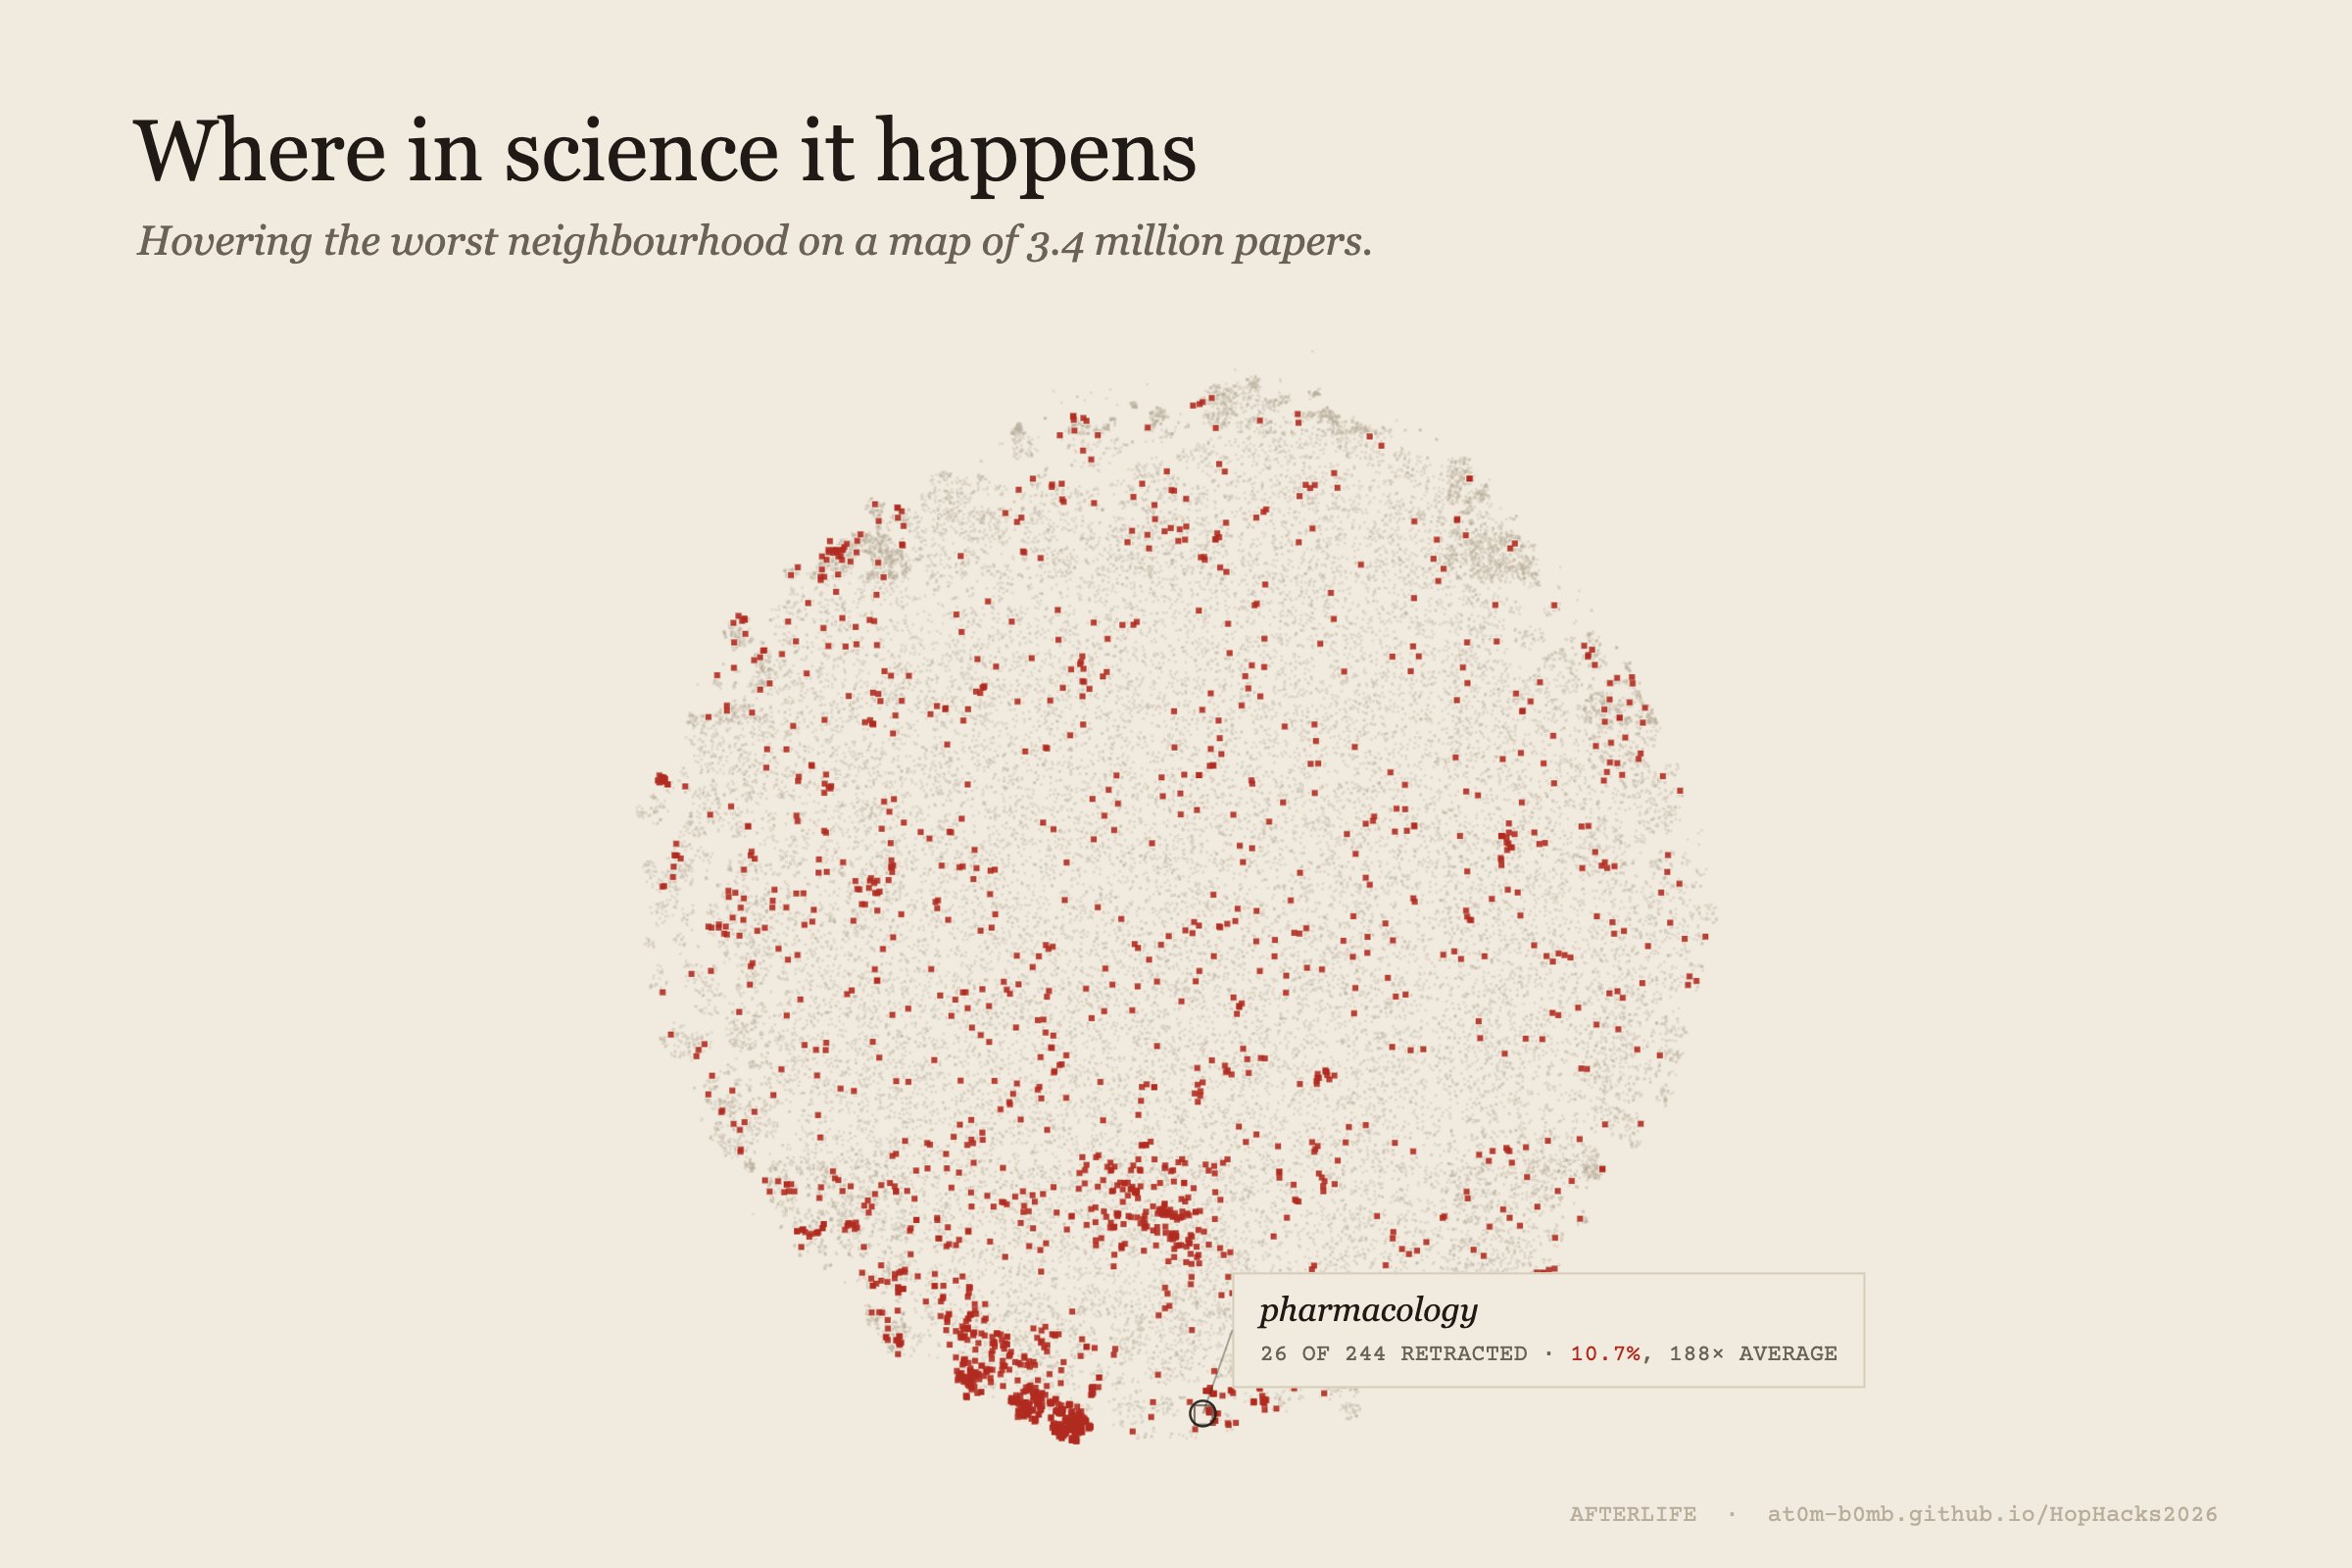
Every point is a paper, positioned by subject. Hovering a neighbourhood names it and gives its retraction rate against the baseline.
-
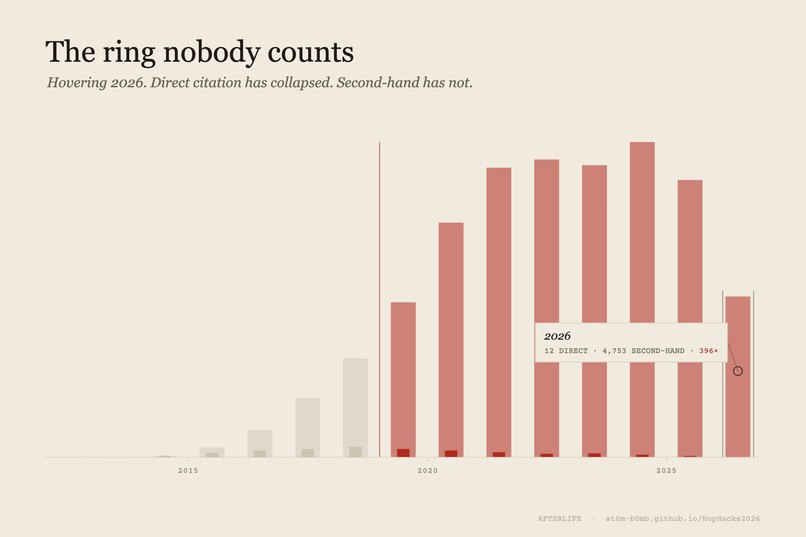
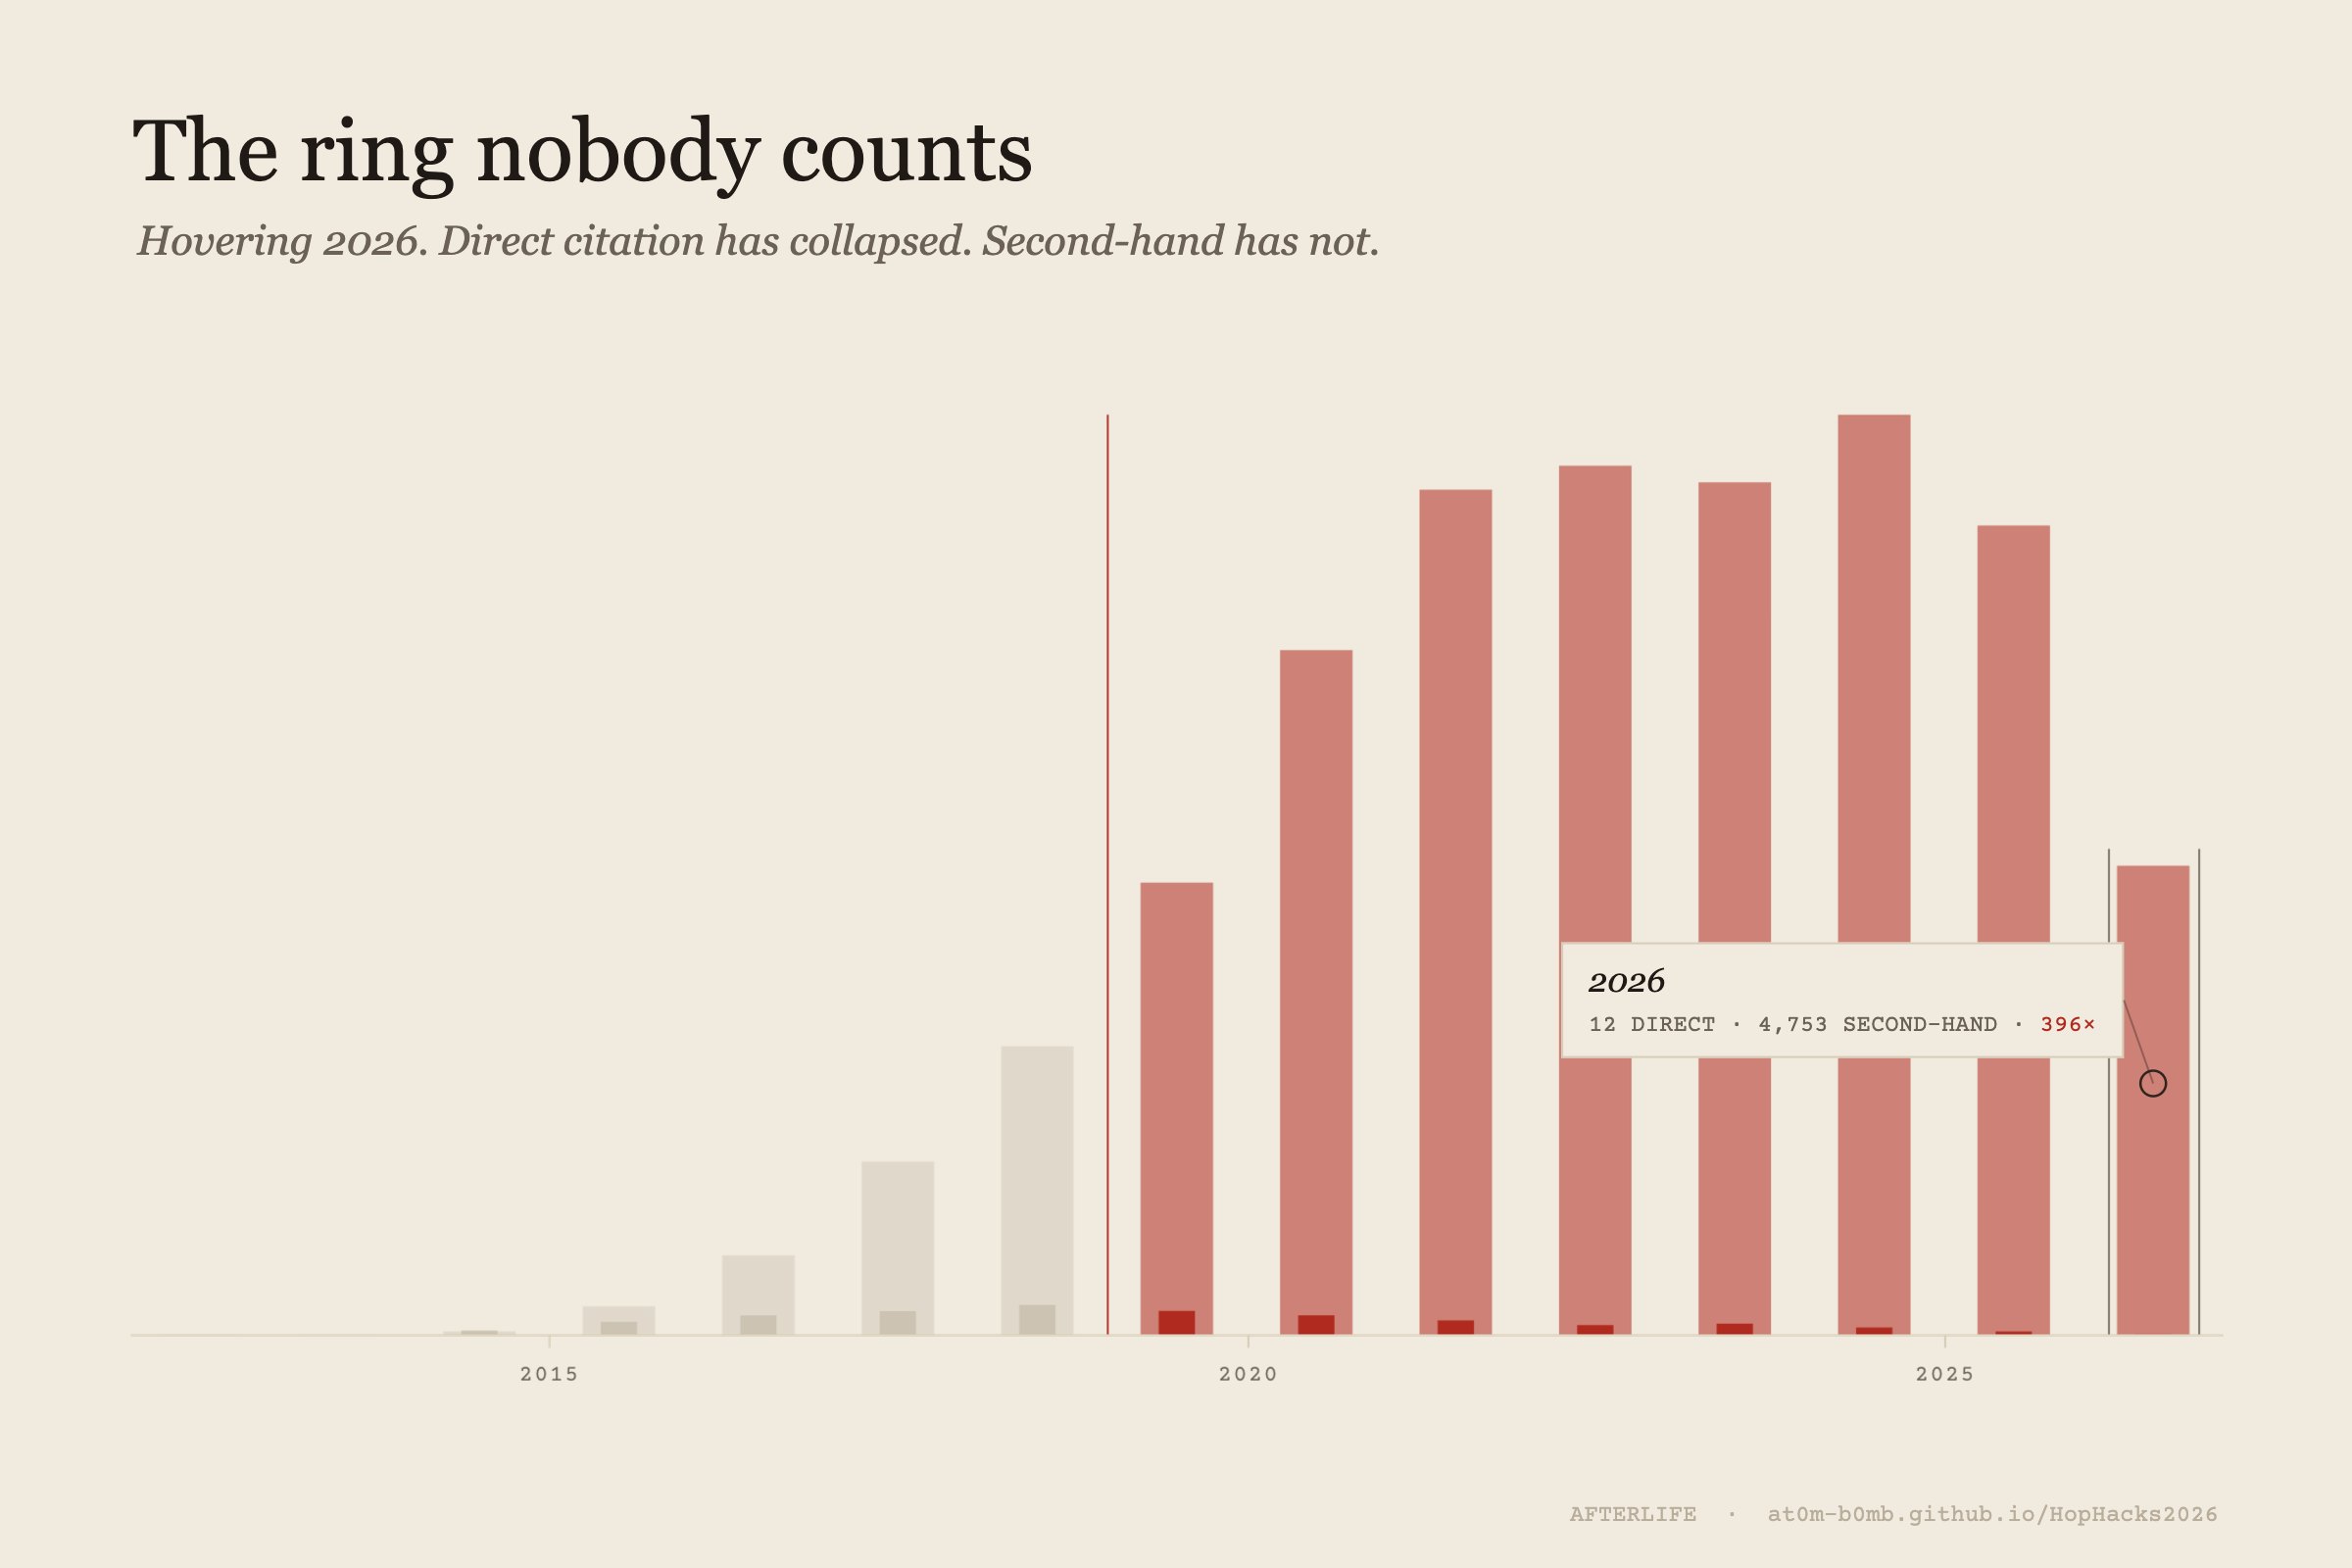
Pale bars are papers citing a paper that cited it. Dark slivers are direct citations. Hovering gives both counts and the ratio.
-
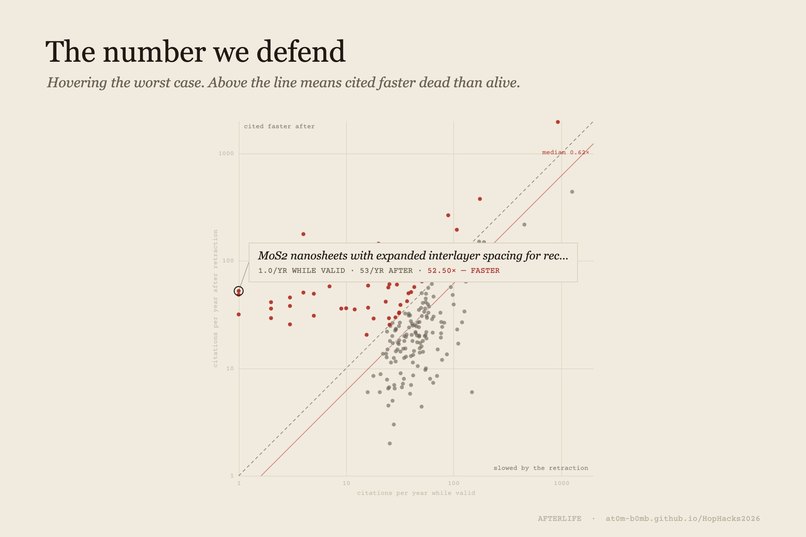
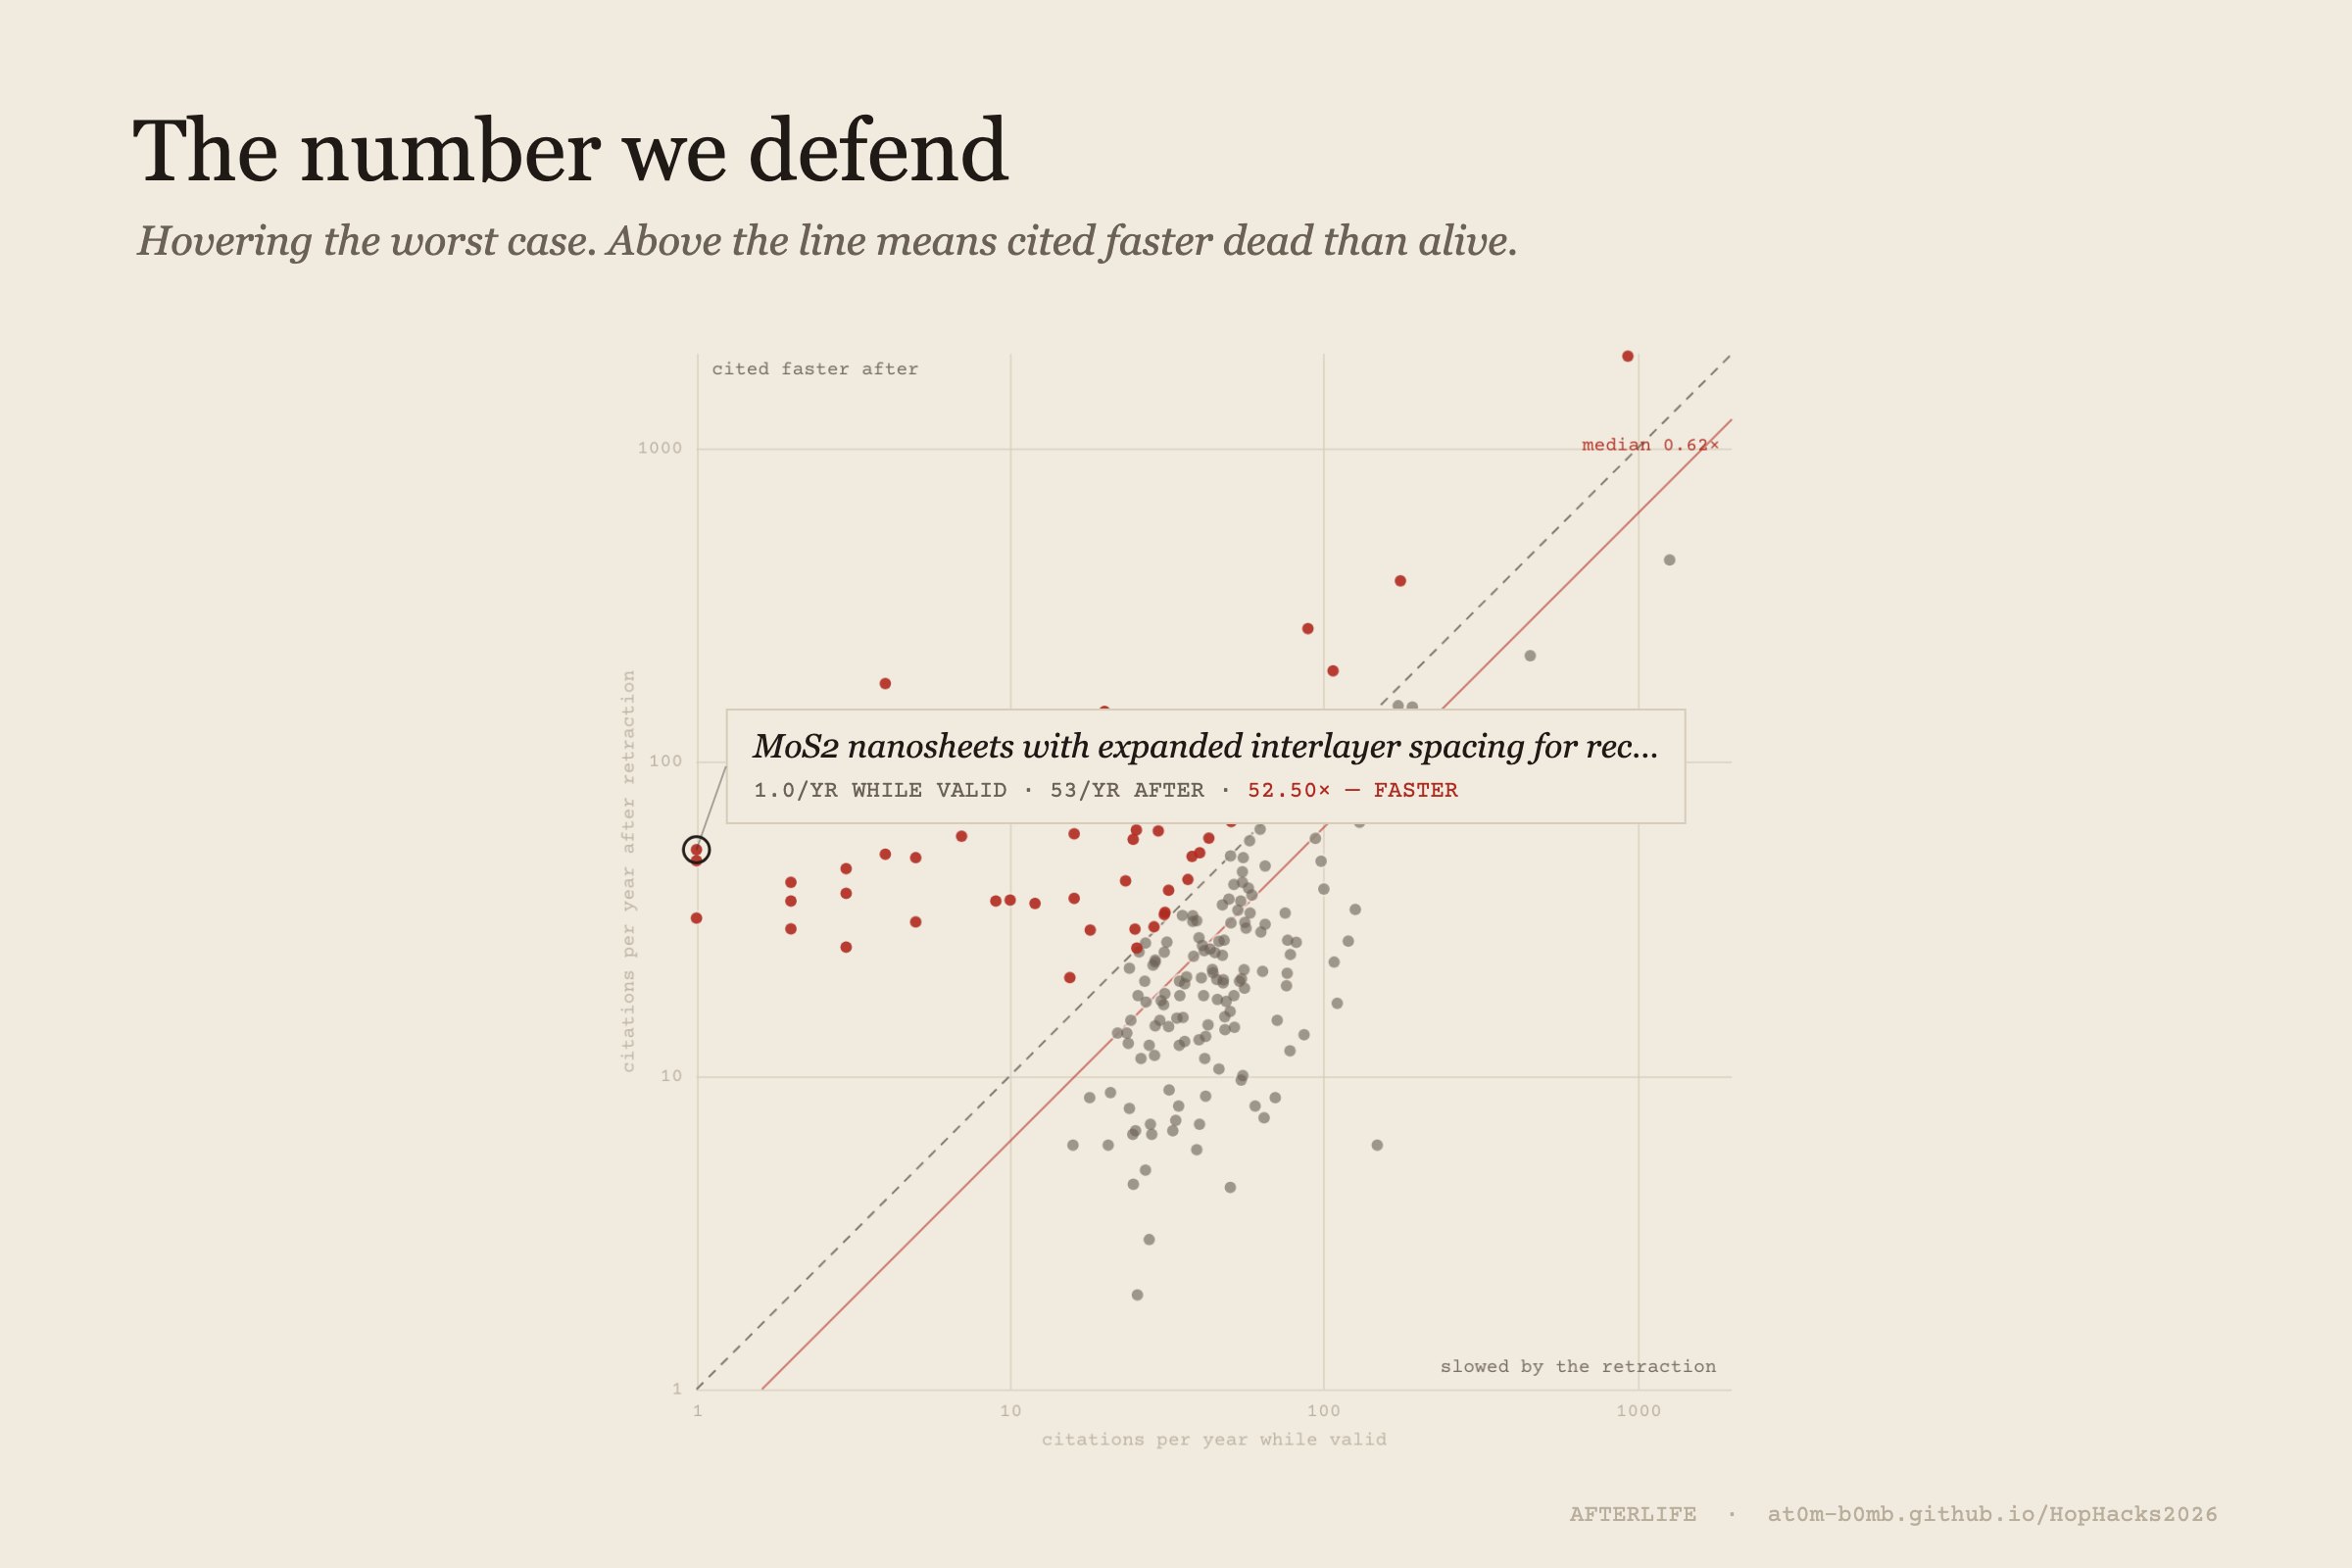
Rate before retraction across, rate after up, log axes. Dashed line is no change, red line the 0.62x median. Hover names the paper.
Inspiration
A retraction is one of the few times science says, with a date on it, that a result is no longer knowledge. It's public and it isn't ambiguous. That makes it a good natural experiment for memetics: an idea with a death certificate, and you can measure what happens to it afterwards.
We expected to find that retracted papers keep getting cited. Everyone knows that already. What we wanted was the actual number, and then whatever was hiding behind it.
What it does
Afterlife is a scrolling data visualisation with four views. Each one answers the question the last one raises. It can also read itself out loud.
One paper. Every citation to a real retracted paper is one line, arriving in the year it actually arrived. Nothing is capped or rescaled to fit. The RETRACTED stamp lands, everything past it turns red, and a counter adds them up. 950 of this paper's 1,886 citations came after it was withdrawn. That's more than the 936 it got while it was still considered true. You can step through all 300 papers, so it's never one cherry-picked example.
Is it everywhere, or somewhere? 3.4 million biomedical papers, placed by what they're about. Retractions aren't spread evenly. Against a baseline of 0.057%, the worst neighbourhood runs at 10.7%, which is 188 times the average. Half of all retractions sit in 4.3% of the map. Hover it and it tells you the subject: pharmacology.
The ring nobody counts. Papers citing the retracted paper, and then papers citing those. After retraction, direct citation falls from 307 a year to 12. Second-hand citation climbs from 2,926 to 9,318. The year before the retraction there were 10 second-hand citations for every direct one. By 2026 there are 396. The correction reaches the first ring. It never reaches the second.
The number we defend. Every paper as one dot: how fast it was cited before retraction against how fast it has been cited since, with a diagonal line where nothing changed. Most papers sit below it. The median lands at 0.62 times the old rate, and 63 papers sit above the line. There's more on this at the bottom, because it's the number we'd want a judge to remember.
How we built it
One HTML file. Vanilla JavaScript, canvas for the marks, real DOM for the text. No framework, no build step, and no API calls while you're looking at it. Scroll position is the only thing that changes the view, so the words and the picture can't disagree.
The data was the hard part, and it took three sources joined together:
- OpenAlex, for which papers are retracted and how many citations each one got per year.
- Crossref and Retraction Watch, for when each paper was retracted. OpenAlex has no retraction date field at all. Without a date there's no before and no after, and the project doesn't exist.
- Nomic's PubMed landscape, 20.7 million papers embedded in 2D, which we crawled as a quadtree of Arrow tiles to ask where in science this happens.
The narration is five recordings, one per view, made with ElevenLabs from text committed to the repo, so the audio is reproducible like everything else.
Challenges we ran into
OpenAlex only reports citations for roughly the last 15 years. We found one paper missing 1,159 citations, and every single one of them was from before its retraction. Keeping papers like that would have inflated our own headline, so the pipeline refuses any paper published before the window opens, then checks that each surviving paper's yearly counts add up to its headline total.
Deduplicating the second ring took some care. Adding up per-batch counts would count a work once for every first-ring paper it happens to cite. We built the ring as a set of work ids instead. The gap between the two numbers is big enough that we keep them apart everywhere: 65,736 transmission paths, 57,765 distinct works.
Our first sampling was wrong. We truncated after sorting chronologically, which quietly picked the earliest-retracted papers and gave us a 76% headline. Swapping the order of two operations brought it down to 63%. We found it ourselves and shipped the lower number.
We also audited our own page and found a mistake in it. One caption worked out "half of all retractions sit in X% of the map" by sorting neighbourhoods by rate instead of by count, so it printed 5.2% directly above a paragraph that said 4.3%. Sorting by count is what that sentence actually claims. We fixed it, along with a chart that was silently dropping 47% of its columns for certain papers.
Accomplishments that we're proud of
The second ring. Every published figure we could find counts the works that cite a retracted paper directly. Nobody seems to have measured the ring past that, where the authors have no reason to know a retraction is anywhere in their reference chain. That's the difference between a claim sticking around and a claim spreading, and it's where the memetics actually is.
Every number on the page is computed from the data files in the repo. None of them are typed in by hand.
What we learned
The interesting result was one level down from the obvious one, and the obvious one turned out to be partly an artefact of how long each paper had been dead.
We also learned that being clear about what you're not claiming makes the thing you are claiming much easier to believe.
What's next for Afterlife
Coauthorship instead of topic, so we can ask whether the risky neighbourhoods are subjects or groups of people. And a third ring.
The number we defend
63% of citations arriving after retraction is the headline, and it's partly an artefact. The median paper here spent two years valid and four years retracted, so it simply had longer to collect them.
So we divided by the time available. The median paper's citation rate drops to 0.62 times what it was. Retraction cuts the rate by about a third. It doesn't stop it. And 63 of the 205 papers we can measure are cited faster dead than alive.
We lead with 0.62x instead of 63% because that's the version that holds up when someone pushes back.
What we don't claim
Retracted isn't the same as fraudulent. Some of these are honest error. The data records a withdrawal, not a verdict on the authors.
A second-hand citation is reachability, not influence. A paper citing a paper that cited a retracted one might be citing its source for something completely unrelated. The second ring is also structurally later in time, so some of its posthumous share is lag rather than contagion.
The map is topical, not social. It shows that some subjects are riskier than others, not that some research groups are. Those are different graphs.
And the 300 are the most-cited retracted papers, not a random draw. Papers nobody cited either way carry no signal, but it's a sampling choice and not a neutral one.
Try it
Live: https://at0m-b0mb.github.io/HopHacks2026/
Code and data: https://github.com/at0m-b0mb/HopHacks2026

Log in or sign up for Devpost to join the conversation.