


Inspiration
I have always heard the constant trope made by opponents of new affordable housing communities in many cities say that they decrease the home value of nearby properties. Often I'd see residents of wealthy neighborhoods in cities that lack affordable housing oppose new developments on these grounds, and I always wanted to know if that had any merit.
What it does
In this notebook, I look at new low-income housing developments funded by the Department of Housing and Urban Development and measure the impact on nearby property sales. This can be seen through graphical and statistical analysis.
Fast Facts we found
- The top 50% performing districts in terms of rising property values contain 62% of all new affordable housing unit
- Property values increased on average 20% each year
- Despite these facts the wealthiest of the districts built no new affordable housing
How we built it
With the D.C. property sales data provided by Costar and Low-Income Housing Tax Credit locations, I combined the datasets in a way that created time-series location-based housing data. Then I used pythonic libraries to display this information to strengthen my hypothesis.
Challenges we ran into
My main challenge with this project was that I was unsure how to visualize and convince the reader that affordable housing does not lower property values. I originally wanted to create a scrollytelling D3 based persuasive webpage, but that proved too time-consuming in such a short time.
Accomplishments that we're proud of
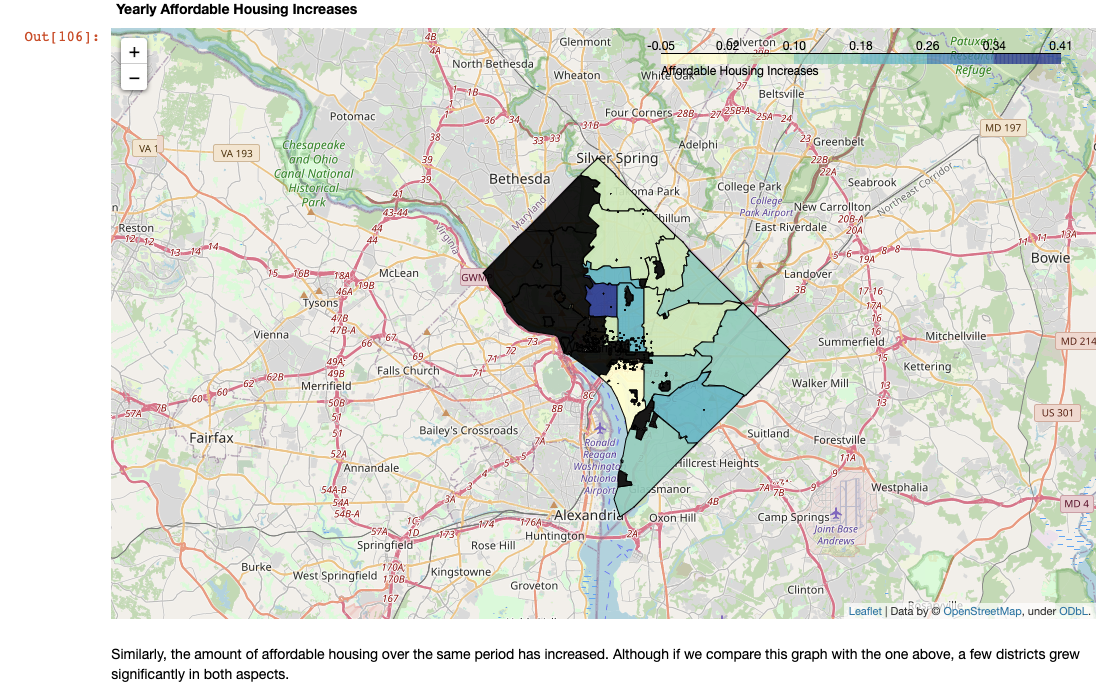
I think I made a pretty good case that in Washington D.C., property sales increased in every district regardless of the new affordable housing. In about half of those areas, the value of properties outpaced the growth of new affordable housing communities.
Built With
- folium
- python


Log in or sign up for Devpost to join the conversation.