-
-
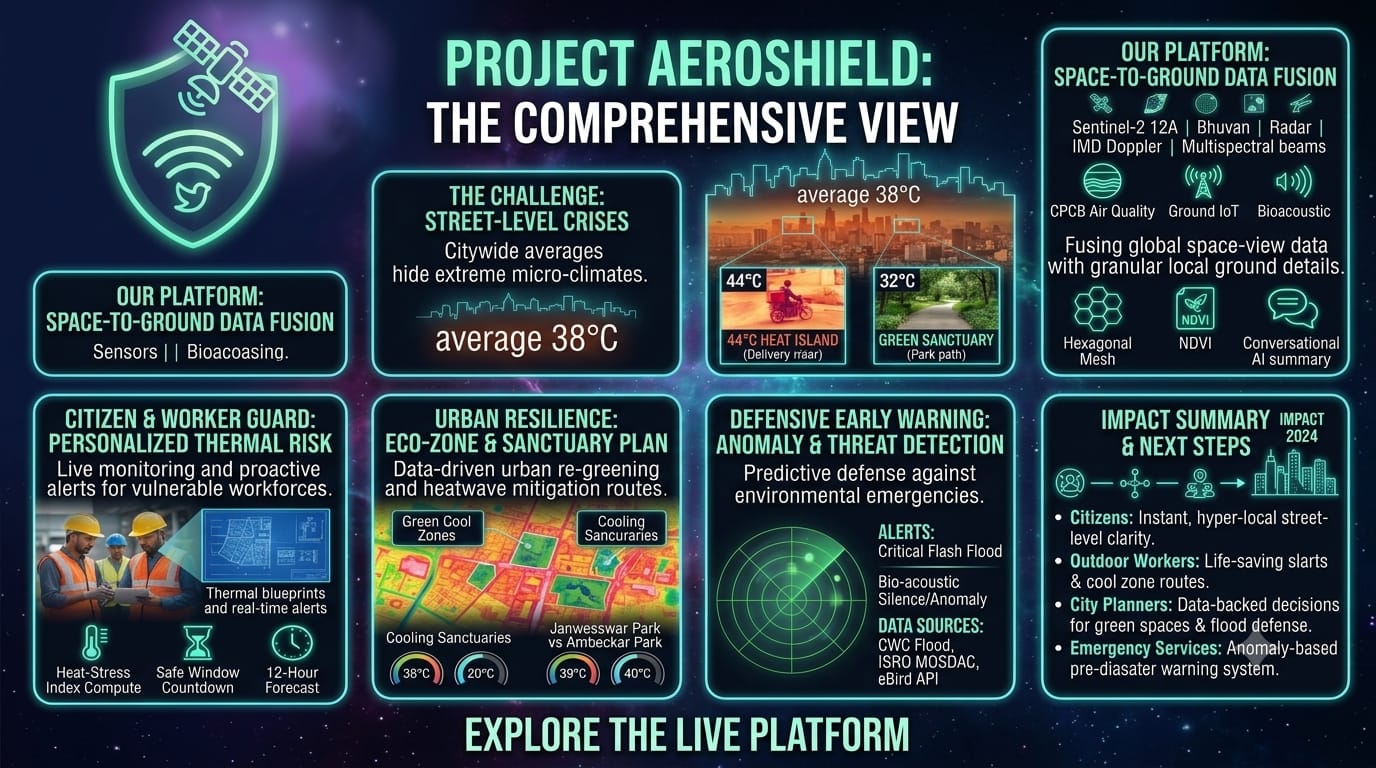
The Comprehensive View
-
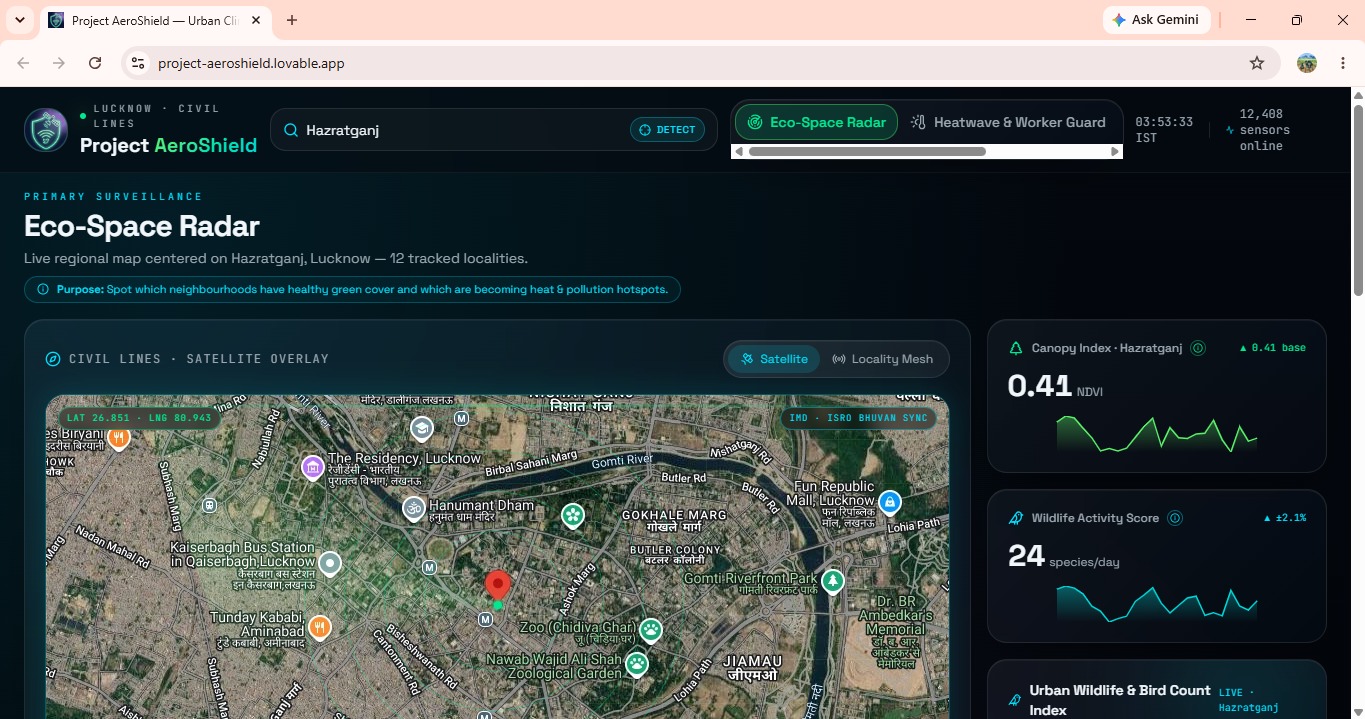
Eco-Space Radar
-
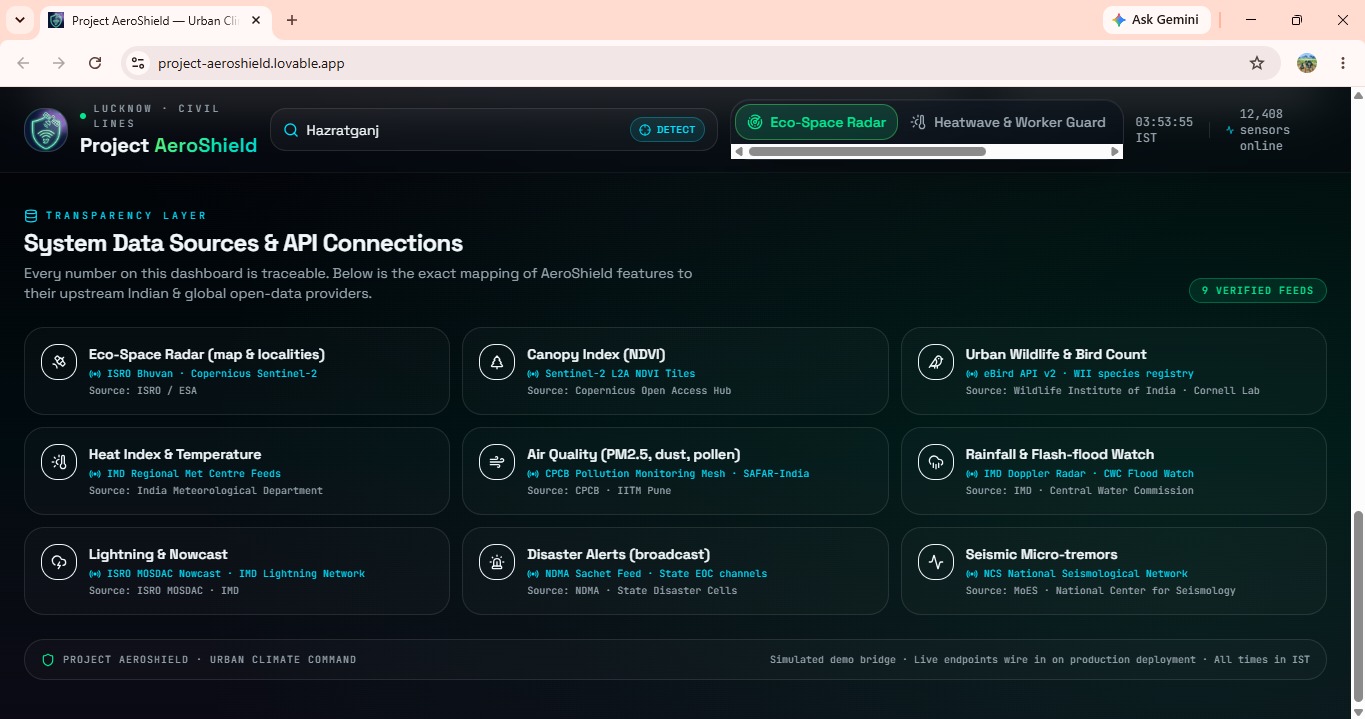
System Data Sources & API Connections
-
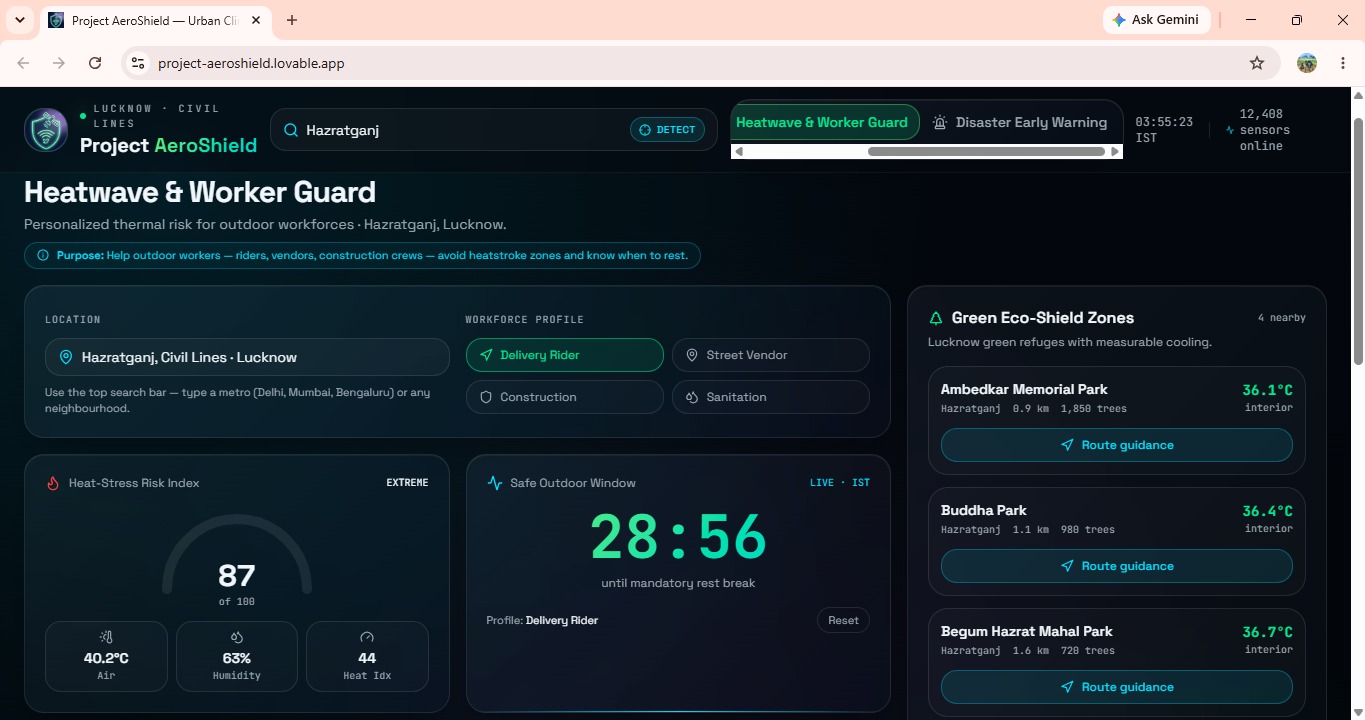
Heatwave and Worker Guard
-
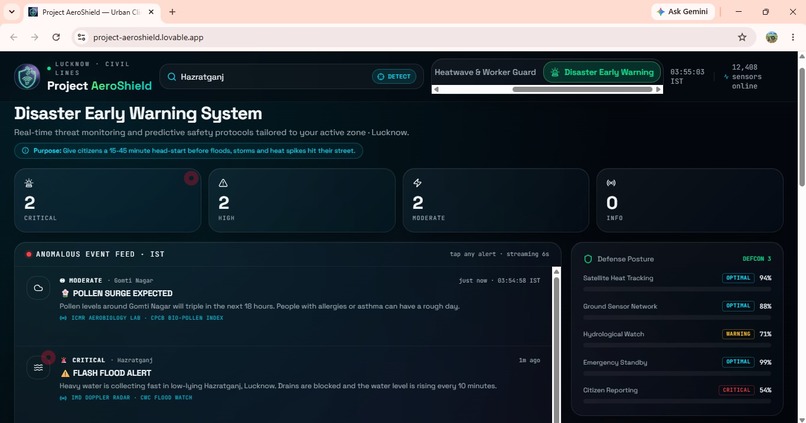
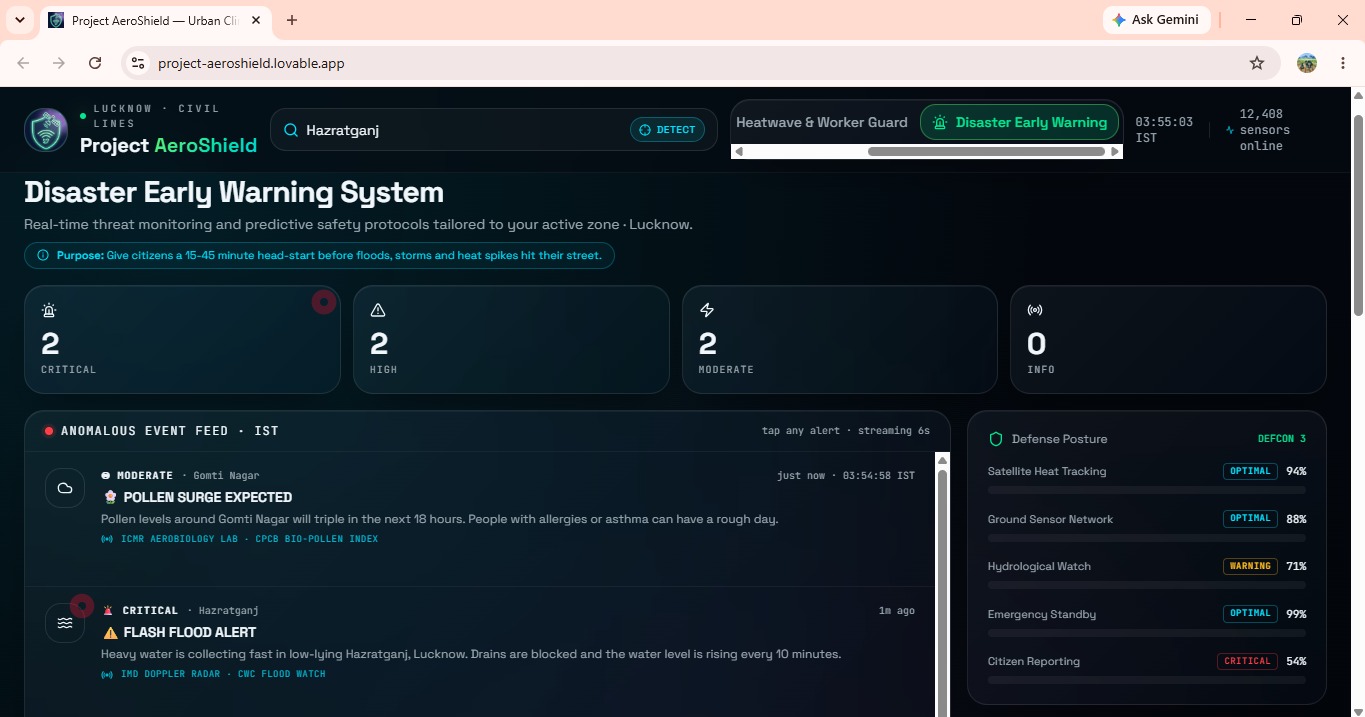
Disaster Early Warning System
Inspiration
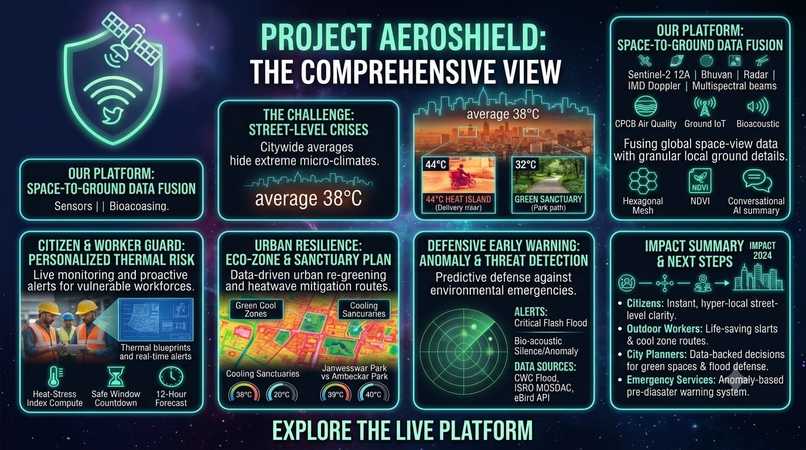
Standard citywide weather apps give one generic average temperature for a whole city, but that doesn't show what's happening on the ground. A concrete-heavy market road can easily hit 8–12 degree higher than a nearby park. On top of that, satellite data and environmental metrics are usually buried in heavy academic jargon that regular citizens or outdoor workers can't quickly use. I built AeroShield to fix this. It brings satellite imagery, weather radar, and ground-level signals together into a simple hexagonal grid map that gives real-time heat alerts, worker safeguards, and early disaster warnings in plain language.
What it does
- Space-to-Ground Data Fusion: Combines satellite telemetry, Doppler radar, air quality, and ground bioacoustics into a live spatial grid.
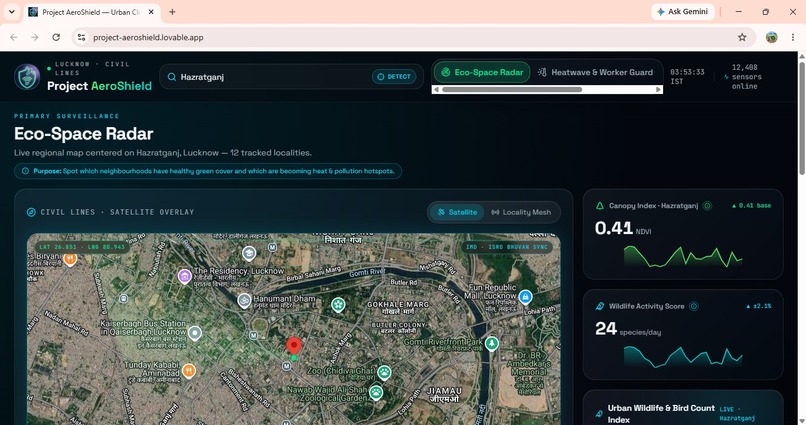
- Locality Health & Canopy Index: Tracks ward-level temperature stress and uses Sentinel-2 vegetation trends to highlight urban heat islands.
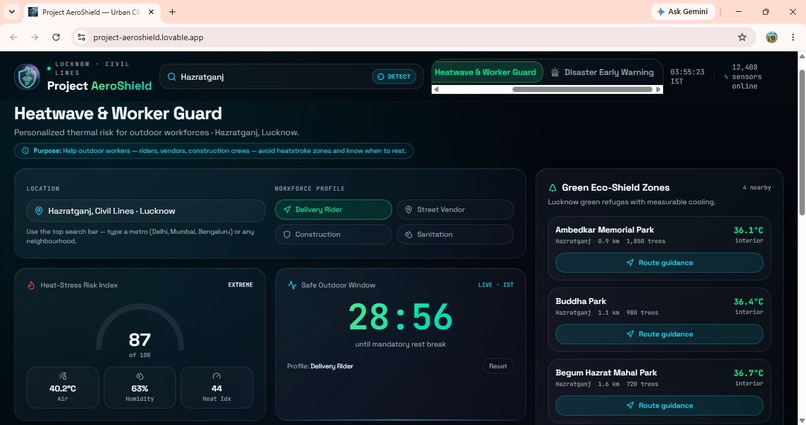
- Worker Heat Safeguard: Calculates real-time heat strain for outdoor workers like delivery riders and street vendors, complete with countdown rest timers.
- Bioacoustic Early Warning Mesh: Listens to regional bird activity data to catch sudden biodiversity silences that often signal incoming severe storms.
- Green Eco-Shield Routing: Shows nearby cooling sanctuaries like parks with estimated temperature drops and navigation routes.
How we built it
- Frontend & Map UI: Built with React, TypeScript, Tailwind CSS, and Leaflet.js to handle the custom hexagonal locality overlay smoothly.
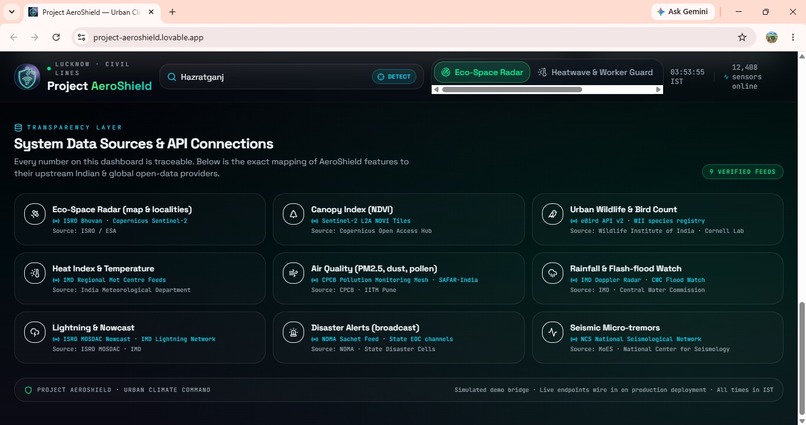
- Data Pipelines: Integrated API feeds from ISRO Bhuvan, Copernicus Sentinel-2, IMD Doppler Weather Radar, CPCB SAFAR-India, and eBird.
- Engine & Logic: Formulated custom heat index calculations and real-time processing to convert raw environmental metrics into simple risk statuses.
Challenges we ran into
- Handling Mixed Data Feeds: Pulling data from satellites and ground sensors meant dealing with totally different update frequencies and spatial scales.
- Translating Complex Metrics: Raw vegetation indices like NDVI don't mean much to everyday users, so turning those into simple actionable alerts took a lot of UI fine-tuning.
- Map Performance: Rendering dynamic spatial hexagonal layers on top of real-time map controls without making the app feel laggy.
Accomplishments that we're proud of
- Successfully unifying satellite, radar, air quality, and bioacoustic signals into one functional dashboard.
- Building a practical tool focused directly on protecting vulnerable outdoor workforces from heatstroke.
- Creating a clean, readable UI that turns complex spatial telemetry into actionable alerts.
What we learned
- How to process multi-source Earth observation feeds and display them effectively on a web map.
- How bioacoustic patterns like sudden bird silences can act as early physical indicators for micro-climate shifts.
- How crucial it is to design environmental tools around human-centric workflows rather than just raw numbers.
What's next for AeroShield
- IoT Ground Array: Setting up low-cost micro-environmental sensors in high-risk pilot wards.
- Model Calibration: Using real physical ground data to refine satellite heat island predictions.
- City-Level Integration: Expanding the platform for municipal teams to help target urban re-greening and micro-flood management.
Built With
- copernicusapi
- ebirdapi
- environment
- gis
- isrobhuvan
- leaflet.js
- mapbox
- node.js
- react
- sdg
- tailwindcss
- typescript


Log in or sign up for Devpost to join the conversation.