💡 Inspiration
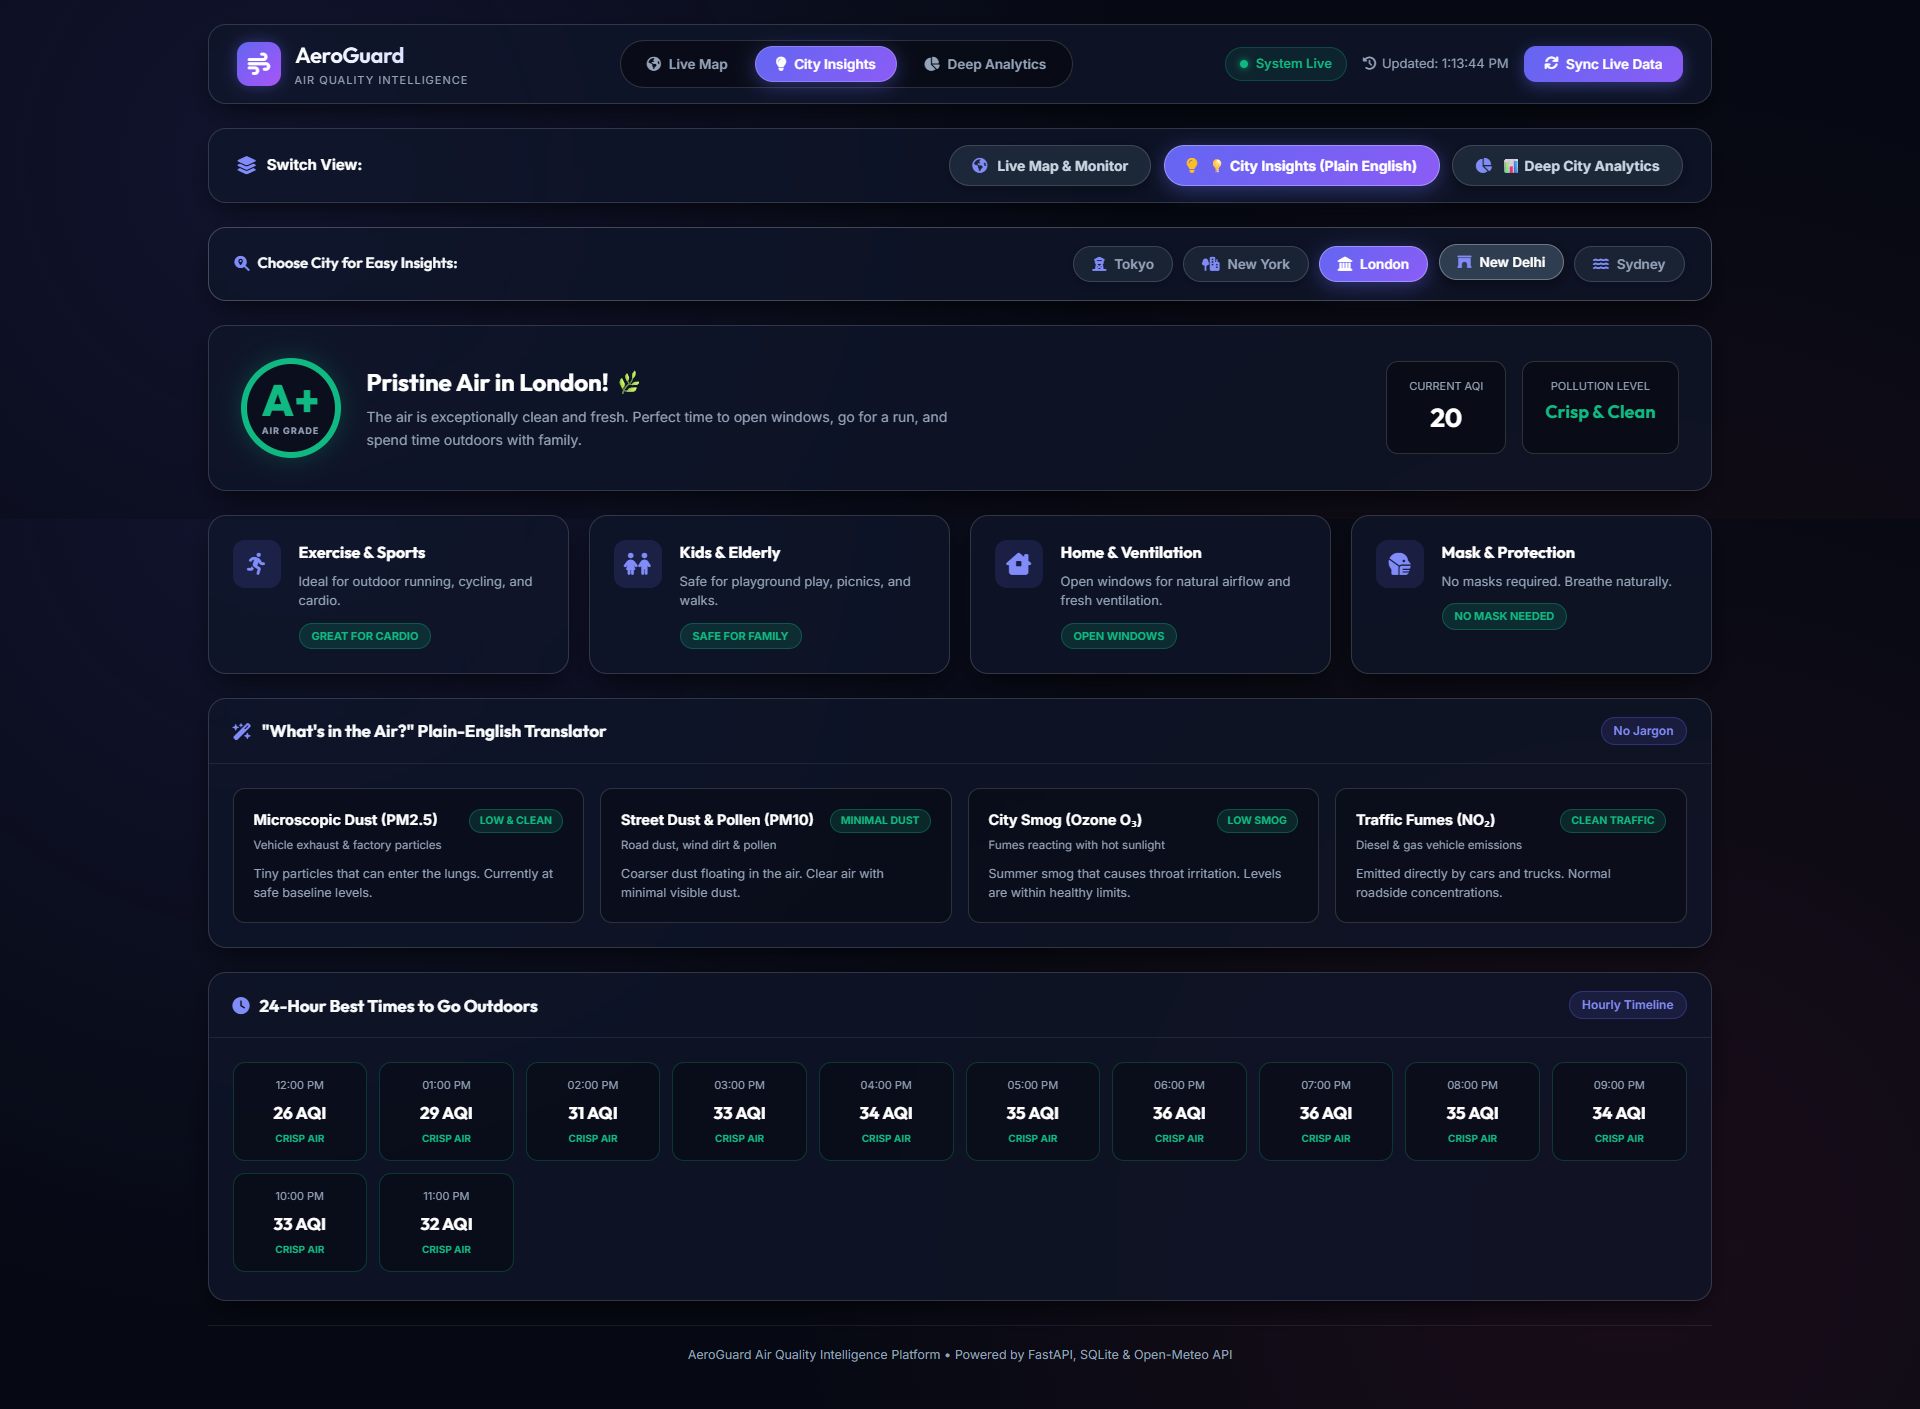
Air pollution is one of the greatest invisible threats to global health, causing millions of respiratory and cardiovascular issues worldwide every year. While environmental data is publicly recorded, it is often siloed in raw scientific feeds or hard-to-interpret tables. We built AeroGuard to transform live environmental telemetry into actionable, intuitive, and immediate visual intelligence—empowering individuals and communities to understand their local air quality at a glance and react to hazardous pollution spikes.
🌍 What It Does
AeroGuard is a full-stack, real-time air quality monitoring and alerting web application.
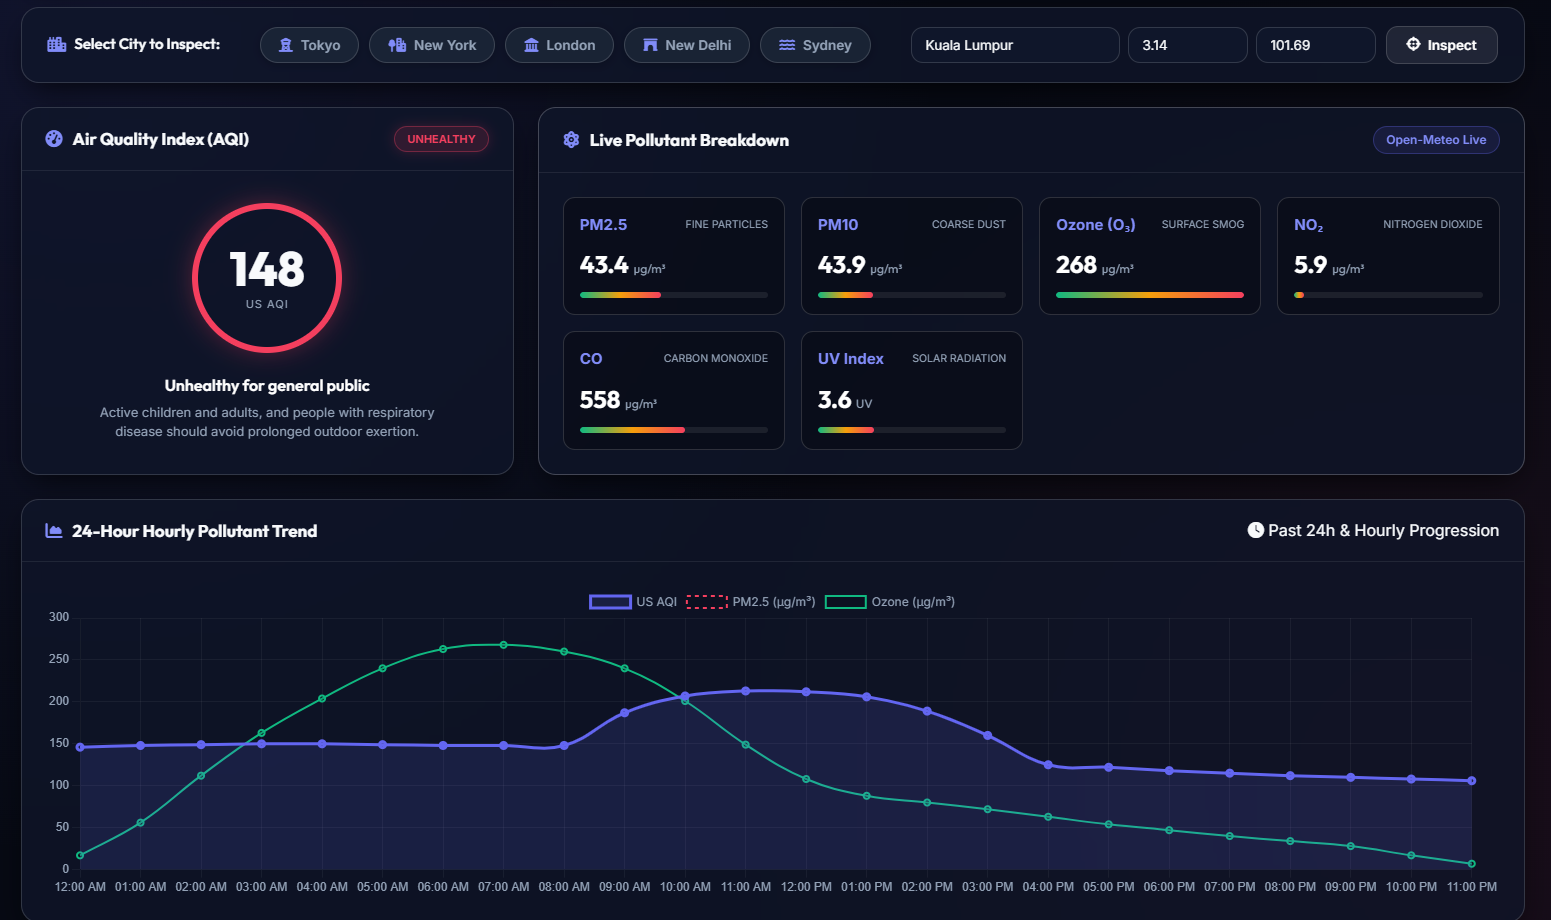
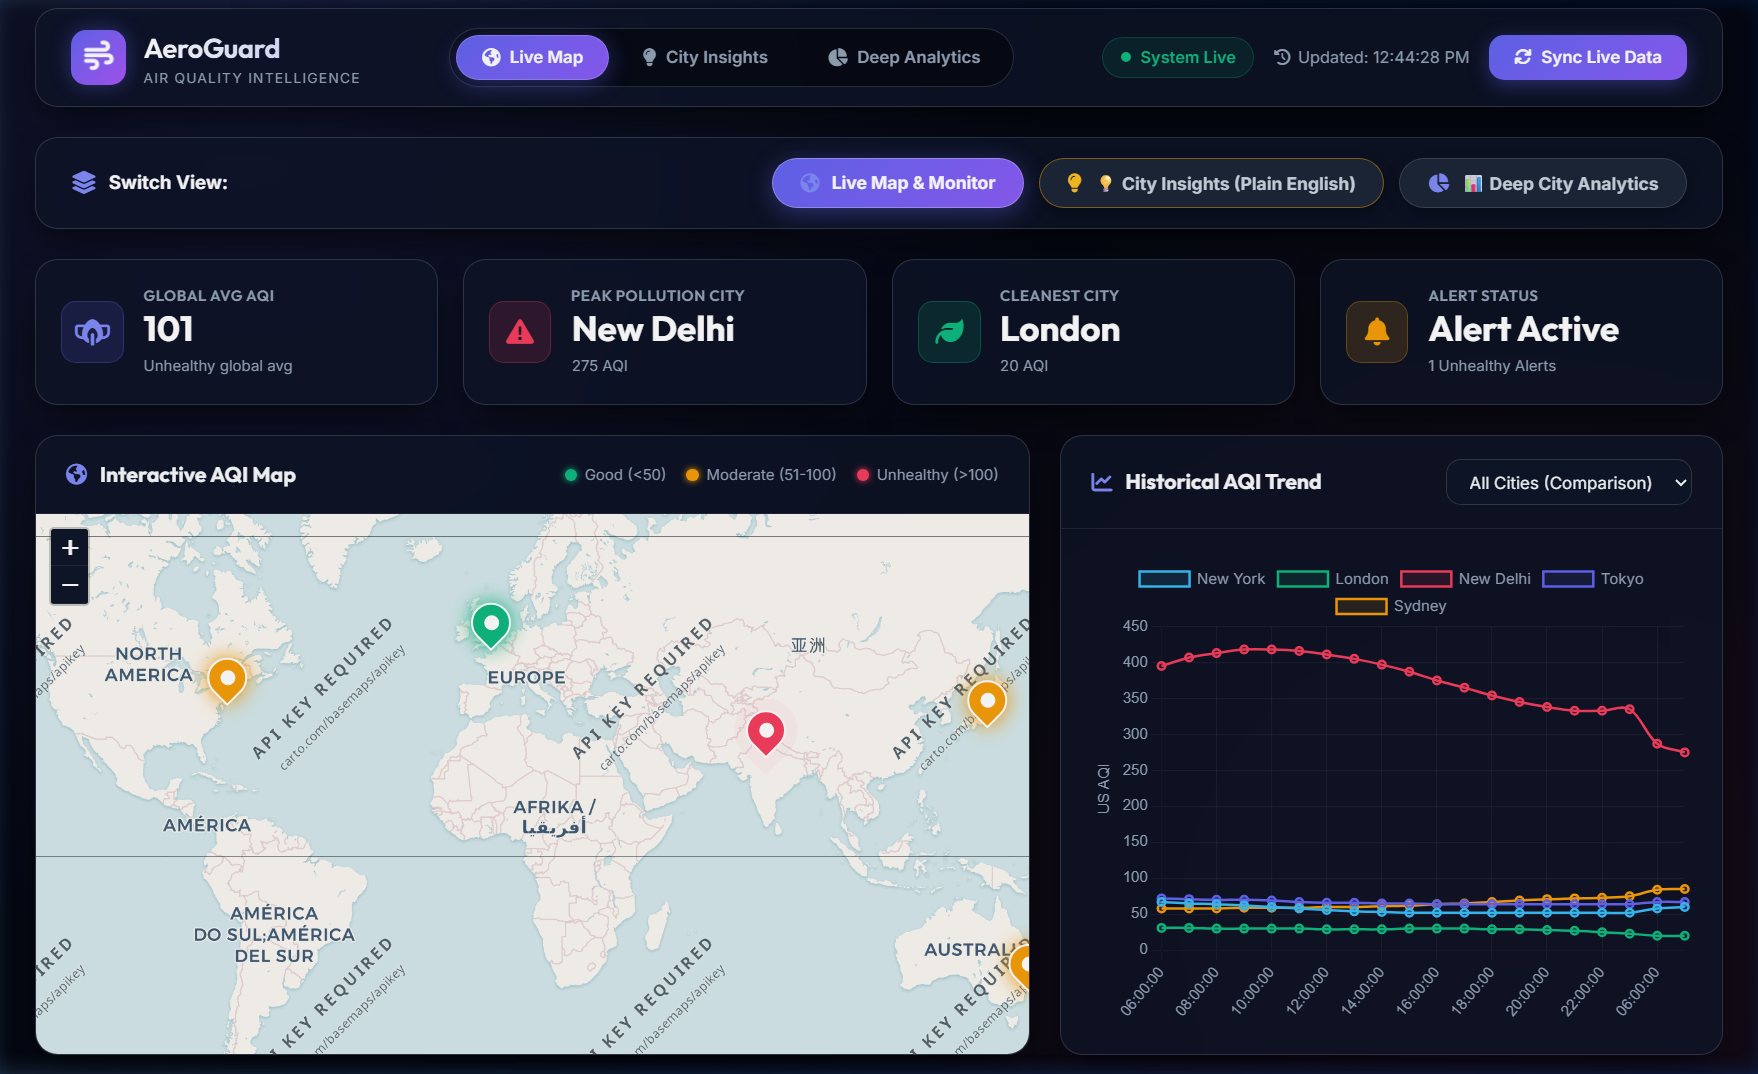
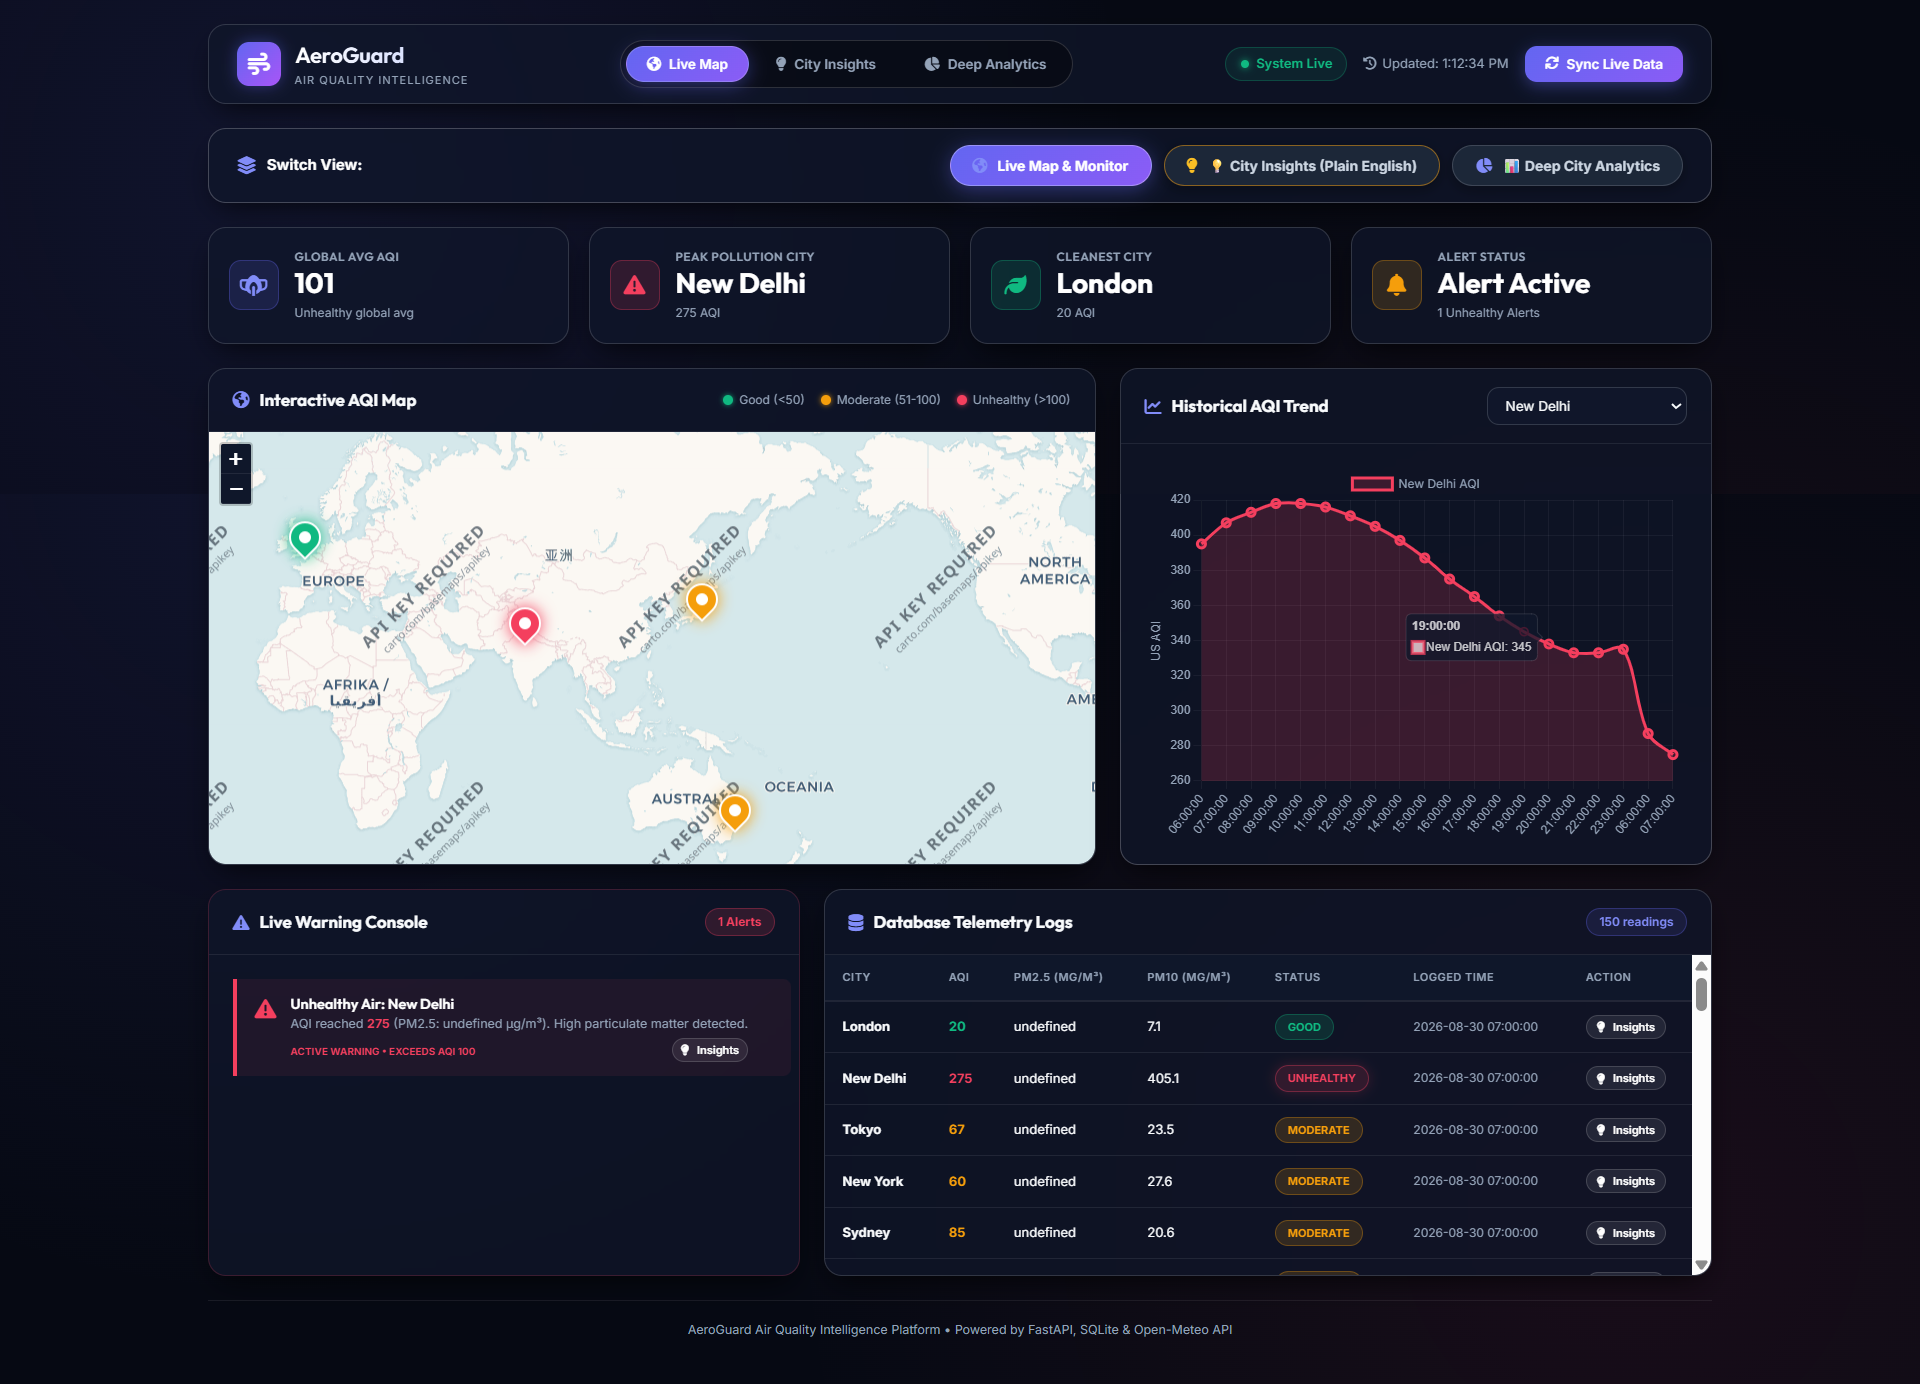
- Live Environmental Telemetry: Continuously streams live particulate matter ($PM_{2.5}$, $PM_{10}$) and Air Quality Index (US AQI) data from the Open-Meteo Air Quality API across major global hubs (Tokyo, New York, London, New Delhi, and Sydney).
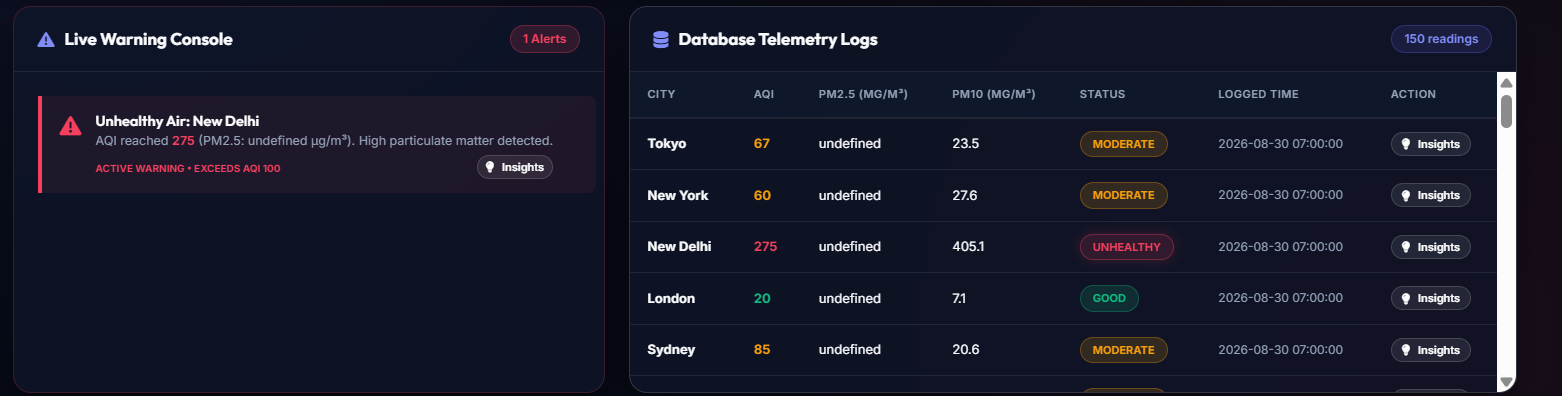
- Automated Pollution Alarms: Dynamically monitors safety thresholds—triggering instant console alarms and flagging readings as "Unhealthy" whenever $\text{AQI} > 100$.
- Geospatial Visualization: Renders an interactive Leaflet.js dark map featuring color-coded status pins:
- 🟢 Good: $\text{AQI} \le 50$
- 🟡 Moderate: $50 < \text{AQI} \le 100$
- 🔴 Unhealthy: $\text{AQI} > 100$ (with animated pulse alerts)
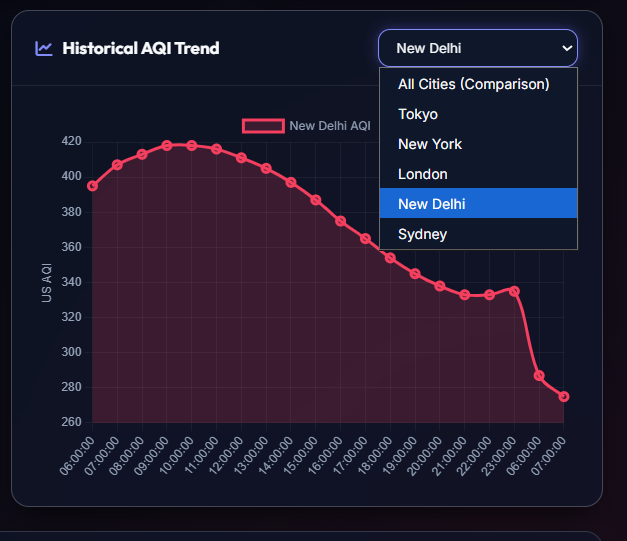
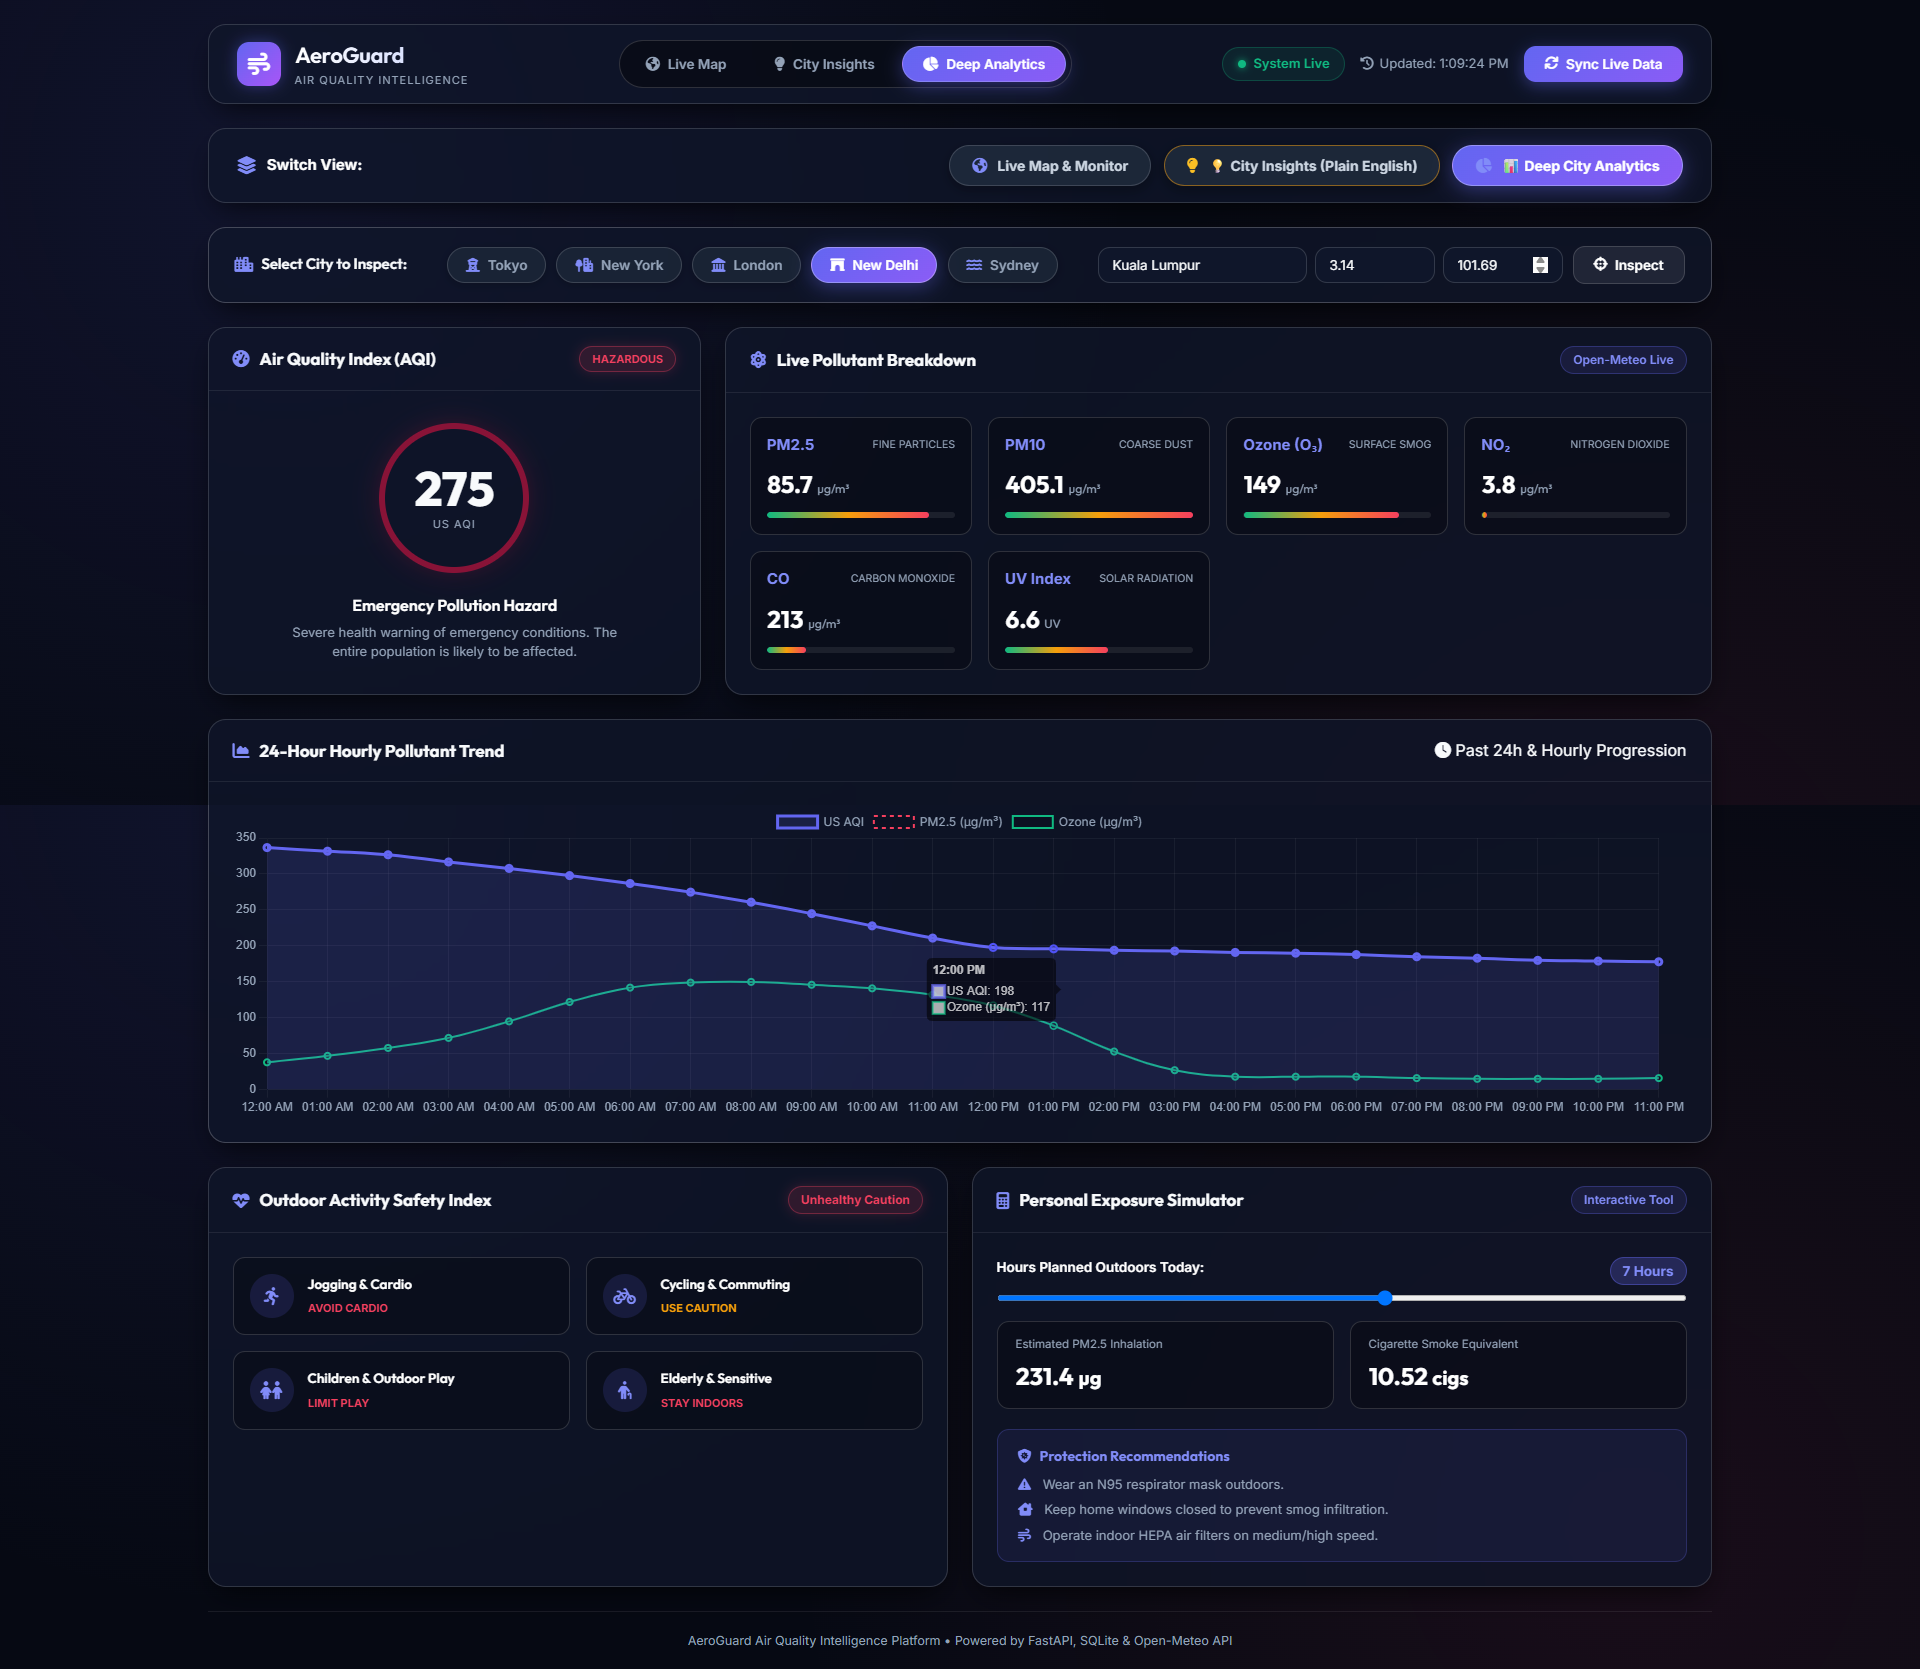
- Historical Session Trends: Uses Chart.js to plot 24-hour historical trends and real-time variations across multiple cities simultaneously, as well as single-city deep dives into $PM_{2.5}$ vs $PM_{10}$ ratios.
- Session Telemetry Persistence: Automatically persists all logs in a local SQLite database for session tracking and analytics.
- Live Sync & Polling: Runs an automatic background scheduler alongside a manual "Sync Live Data" trigger for on-demand refreshes.
🛠️ How We Built It
- Backend Architecture: Built with Python 3.13 and FastAPI, utilizing an asynchronous lifecycle scheduler that polls and seeds historical and real-time telemetry.
- Data Persistence: Integrated SQLite3 to store timestamped logs, compute moving averages, and retrieve telemetry without external database overhead.
- External Integration: Connected to the Open-Meteo Air Quality API via
httpxfor non-blocking, async multi-city fetching with zero API key dependencies. - Frontend Dashboard: Designed with Vanilla HTML5, ES6+ JavaScript, and Vanilla CSS3 utilizing a sleek glassmorphic dark theme, responsive grid layouts, and CSS keyframe animations.
- Geospatial & Charting Engines: Integrated Leaflet.js with CartoDB Dark Matter tile layers and Chart.js for smooth spline trend visualizations.
Challenges We Ran Into
- Asynchronous Polling vs. Chart Alignment: When querying multiple cities asynchronously, timestamps often differed by a fraction of a second. We redesigned the chart data aggregation pipeline in
app.jsto chronologically align datasets across all cities without missing data points or breaking line splines. - Cold-Start Trend Visualization: Fresh databases initially have zero history, resulting in flat 1-point charts. We engineered a 24-hour historical seeding mechanism during startup so that the dashboard renders full historical curves immediately upon first launch.
- Cross-Platform Console Compatibility: Resolved Windows CP1252 terminal encoding constraints during background execution by standardizing structured, ASCII-safe logging headers for alarms and telemetry.
🏆 Accomplishments That We're Proud Of
- Created an end-to-end full-stack application that works seamlessly with a single startup command (
python run.py). - Implemented real-time safety threshold triggers that instantly isolate and warn about extreme pollution levels (e.g., detecting New Delhi's AQI $> 400$).
- Built a zero-dependency, lightweight, and ultra-fast UI that looks modern, responsive, and production-ready.
What We Learned
- How to orchestrate async background workers within FastAPI lifespans.
- Best practices for rendering custom HTML/CSS markers and popup cards on interactive Leaflet.js geospatial canvases.
- Handling environmental telemetry metrics ($PM_{2.5}$ and $PM_{10}$) and standardizing them into US AQI classification tiers.
What's Next for AeroGuard
- Custom Location Search: Allow users to input any city or GPS coordinates to dynamically add custom tracking pins to the map.
- Push & SMS Alerts: Integrate Twilio / Web Push notifications to alert users on their mobile devices when their local AQI exceeds safety thresholds.
- Predictive AI Forecasting: Implement machine learning models to forecast next-day air quality based on historical wind patterns and weather conditions.
Built With
- async-io
- chart.js
- css3
- fastapi
- glassmorphism
- html5
- httpx
- javascript
- leaflet.js
- open-meteo-api
- python
- responsive-design
- sqlite
- uvicorn

Log in or sign up for Devpost to join the conversation.