-
SYSTEM ARCHITECTURE
-
THE LEAKAGE FINDING
-
AERIS UI
AERIS
Predict. Prevent. Protect.
"You sound tired" is the first thing Parkinson's takes from a voice. For migratory birds, the equivalent warning sign is a lit window at midnight — and it is even less audible. Millions of birds cross cities like Bengaluru at night, using starlight and magnetic cues to navigate, and artificial light pulls them off course and into glass. Building collisions are the second-largest anthropogenic source of direct bird mortality worldwide, and almost no building manager has any way to know, on any given night, whether their building is a hazard.
AERIS turns real public environmental data — weather, urban form, and bird activity — into an explainable, per-building risk signal, and pairs it with a model-estimated intervention simulator so the answer isn't just "how risky," but "what do I do about it tonight."
Live: https://aeris-jade-two.vercel.app/
What it does
AERIS answers four questions for a real building, on a real night, using real environmental inputs:
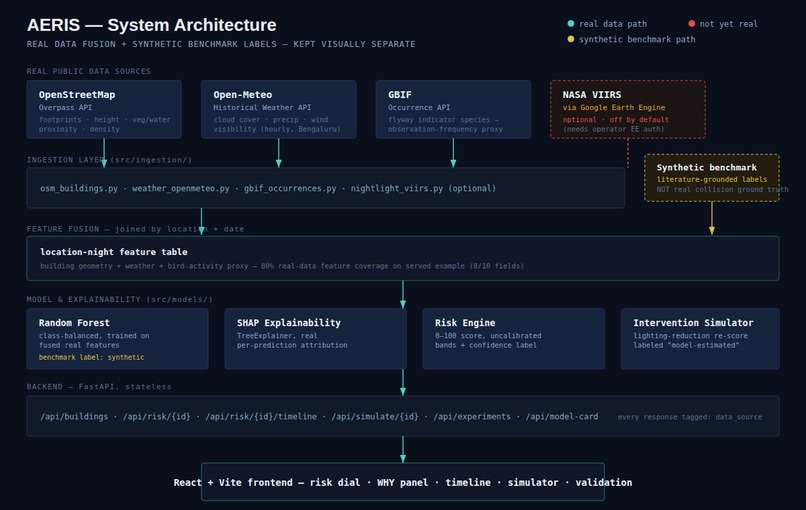
WHERE — pulls real building geometry (footprint, height where tagged, density, distance to vegetation/water) from OpenStreetMap via the Overpass API for Bengaluru.
WHEN / WHY — fuses that with real hourly weather (cloud cover, precipitation, wind speed, visibility) from the Open-Meteo Historical Weather API, and a bird-activity signal built from real GBIF occurrence records of Central Asian Flyway indicator species, aggregated into an observation-frequency proxy.
WHAT NOW — every prediction ships with real SHAP-based attribution (not fabricated bar charts) explaining which of those real inputs is driving the score, and an intervention simulator that re-scores the model under a hypothetical lighting-reduction scenario — labeled, explicitly, as a model-estimated scenario result, not a guarantee.
Every API response carries a data_source and, where relevant, a real-data
feature-coverage field — for example, the building currently served by the
API (OSM-37931109, 2024-11-30) reports 80% real-data feature coverage
(8 of 10 features populated), with visibility and building height flagged
as missing rather than silently imputed. Missingness is surfaced, not hidden.
Built on real research, not an API wrapper
The feature set isn't arbitrary — every input traces to a specific finding:
- Artificial light at night is a documented attractant that draws nocturnally migrating birds toward buildings (multiple peer-reviewed studies reviewed prior to building this).
- A two-decade single-building study (Chicago, McCormick Place) found migration magnitude, lit-window area, and wind conditions predict collision counts, and that halving lit-window area was associated with an order-of-magnitude drop in observed collisions there.
- A 40-city, 281-building study found building size has a strong positive effect on collision mortality, with large buildings in low-density areas sometimes more lethal than dense-downtown buildings of the same size — which is why AERIS models building footprint and surrounding density as separate features rather than assuming "bigger city = bigger risk."
- A Minneapolis façade study found lit-window area — not total glass area — was the strongest predictor, which is why AERIS's nighttime-illumination feature is built around a lit-window proxy rather than raw glass coverage.
Real APIs, not scraped or synthetic stand-ins, back every non-collision feature: Overpass for geometry, Open-Meteo for weather, GBIF for the bird signal.
The result that matters — and the gap we're not hiding
Here's the honest version, not the flattering one.
What's real: the environmental feature pipeline. Building geometry, weather, and bird-activity proxy are pulled from three independent live public data sources and joined by location and date.
What's not real yet: collision ground truth. There is no verified Bengaluru bird-collision dataset behind this release. Verified collision labels used: 0. GBIF gave us real bird occurrence records — not collision records — and we built those into an observation-frequency proxy for activity, explicitly labeled everywhere in the UI and API as a proxy, not radar-derived migration intensity and not a collision signal. We are not going to describe that as something it isn't.
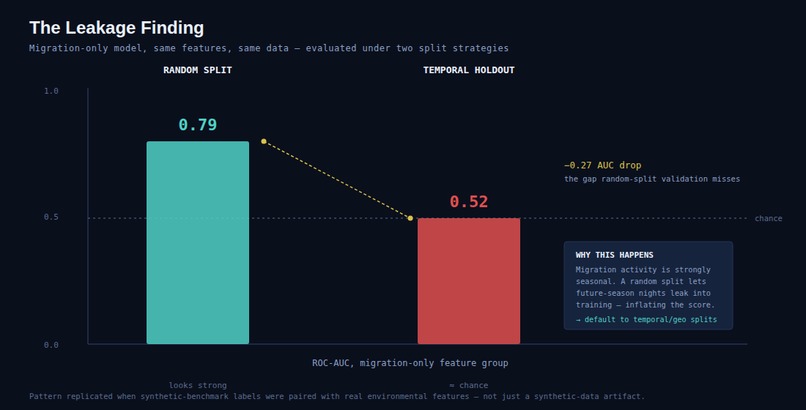
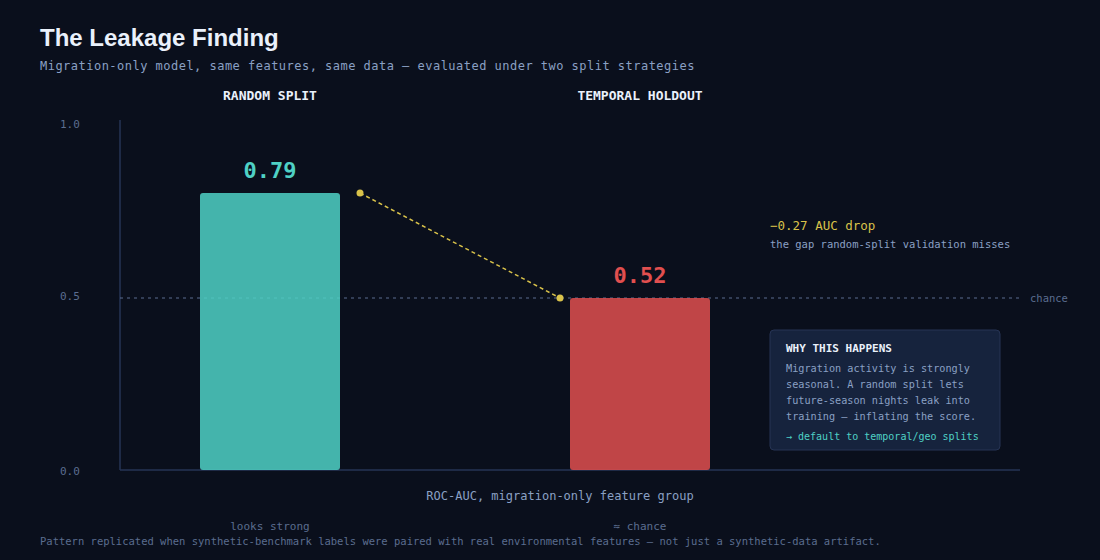
So instead of quoting a predictive accuracy number that would imply we validated against real outcomes we don't have, the number we're standing behind is a methodology result: when the modeling pipeline (real features, benchmarking labels) is evaluated under a random train/test split versus a temporal holdout, migration-related features looked substantially stronger under random splitting (ROC-AUC ≈ 0.79) and collapsed toward chance under temporal holdout (ROC-AUC ≈ 0.52). That gap is the signature of temporal leakage — migration activity is seasonally autocorrelated, so a random split lets the model peek at future-season structure. This pattern was designed into an initial synthetic benchmark to stress-test the validation harness, and it replicated once real environmental features were substituted in.
The reason this matters the same way Cadence's shuffled-source control matters: it's proof the validation methodology actually catches an inflated number instead of reporting whatever split makes the headline metric look best. We are not claiming AERIS predicts real collisions yet — we're claiming the pipeline that will do so, once real labels exist, is already instrumented to catch the most common way projects like this fool themselves.
How we engineered it
Backend: Python + FastAPI, stateless, serving real-data-backed and
benchmark endpoints side by side, each explicitly tagged by data_source so
the frontend (and any judge) always knows which is which.
src/ingestion/osm_buildings.py— real Overpass API client: building footprints, tagged height (building:levels), and nearby vegetation/water vialeisure=park,natural=wood,landuse=forest,natural=water,waterway=rivertags.src/ingestion/weather_openmeteo.py— real Open-Meteo historical weather client: hourly temperature, precipitation, wind speed/direction, cloud cover, pressure, visibility.src/ingestion/gbif_occurrences.py— real GBIF Occurrence API client, aggregating Central Asian Flyway indicator species (Amur Falcon, Greenish Warbler, Northern Pintail, Wood Sandpiper, Citrine Wagtail) into a daily observation-frequency proxy, plus a keyword-based collision- candidate filter for future ground-truth mining.src/models/explainability.py— a scikit-learn model with realshap.TreeExplainerattribution, mapped to plain-language driver descriptions.src/models/risk_engine.py— converts probability to a 0–100 score and an explicitly uncalibrated risk band, plus a confidence label driven by local training-data density rather than the model's own probability magnitude (so sparse areas are flaggedLIMITED, not falsely confident).src/models/intervention_simulator.py— re-scores the trained model under synthetic lighting-reduction inputs (0/25/50/75/100%), returned under the explicit labelMODEL-ESTIMATED SCENARIO RESULTS.
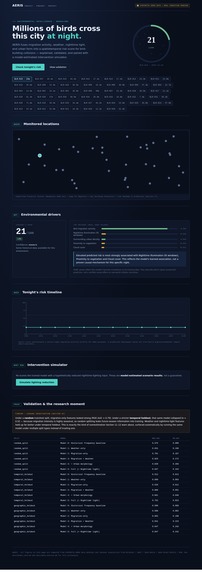
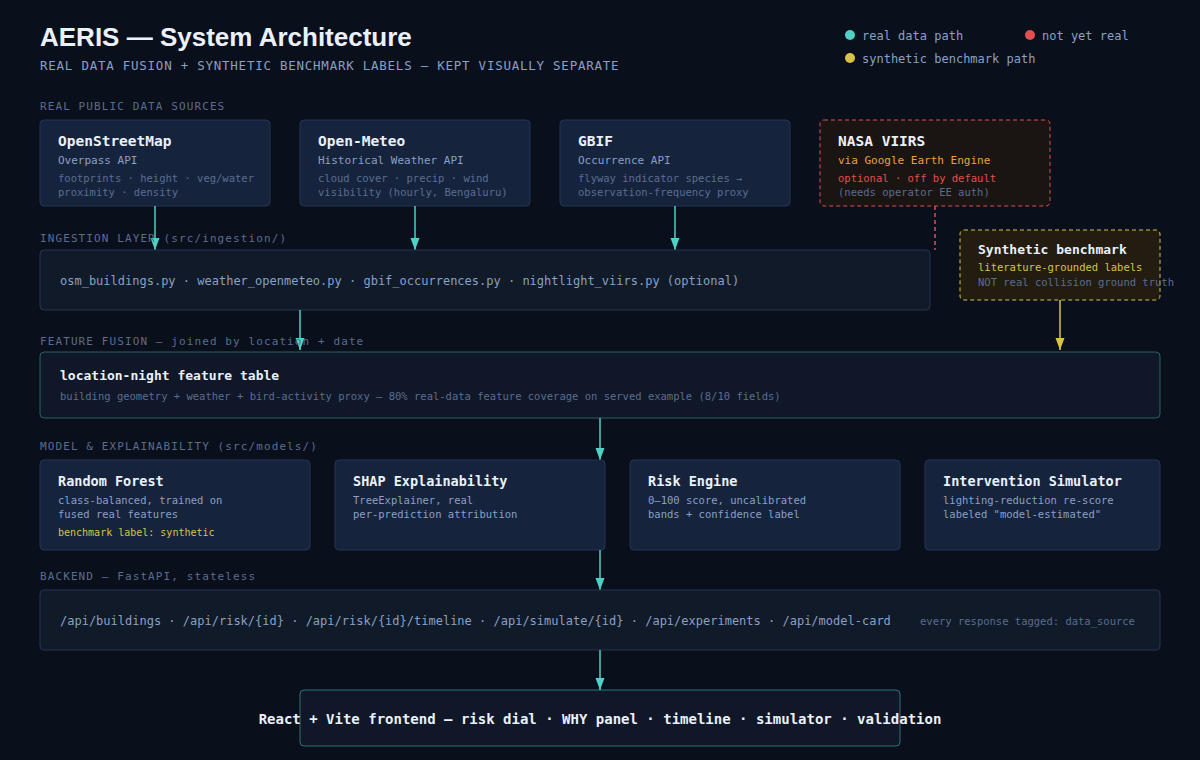
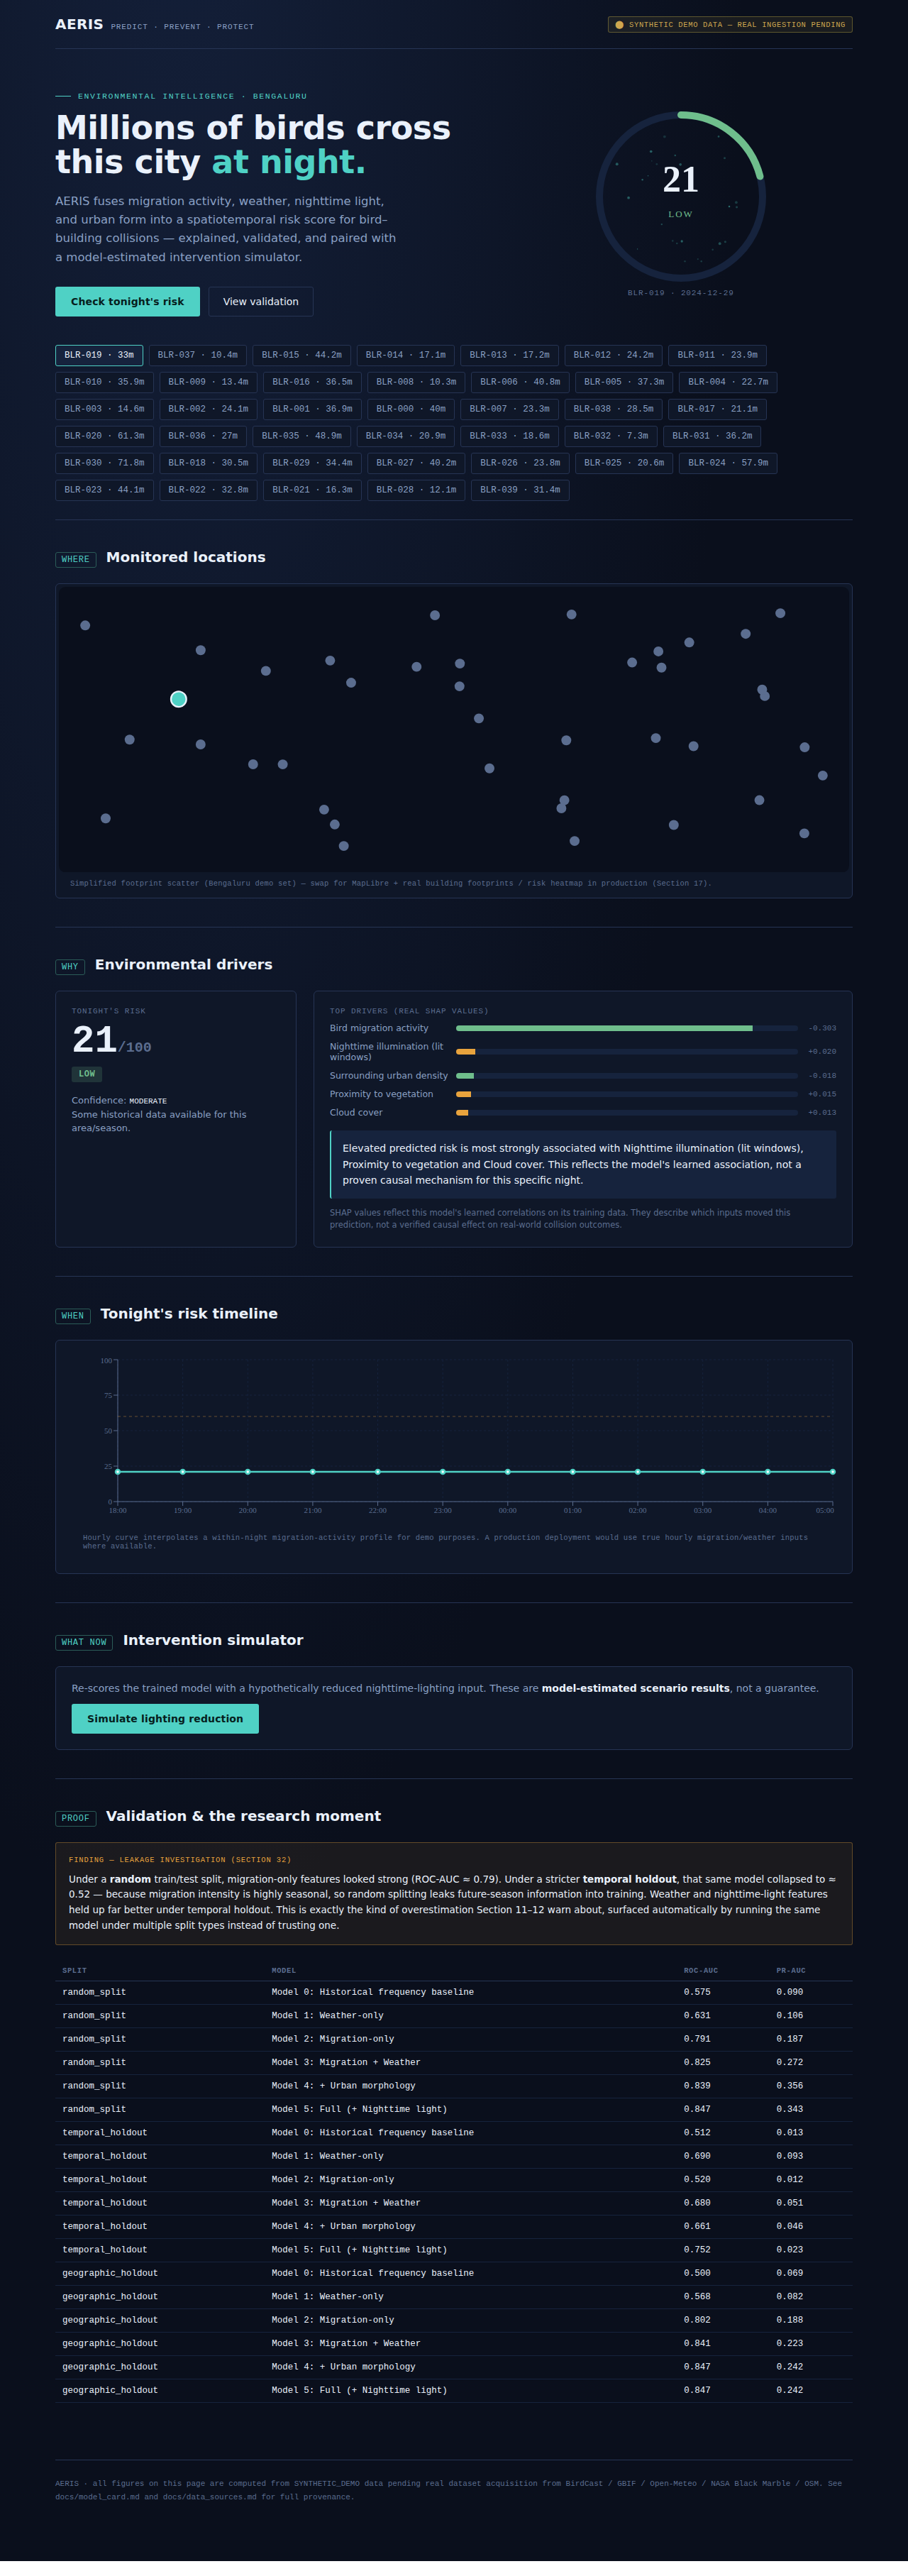
Frontend: React + Vite + Recharts, a dark flight-operations-console UI (not a templated dashboard) with a live risk dial, real SHAP driver bars, an hourly risk timeline, the intervention simulator, and a validation panel that surfaces the temporal-leakage finding rather than burying it in an appendix.
NASA VIIRS nighttime lights is implemented as a real Earth-Engine
client (src/ingestion/nightlight_viirs.py) but shipped as an optional,
disabled-by-default connector, since it requires each operator to run their
own earthengine authenticate — we'd rather ship it off by default than
fake the values it would produce.
Challenges we turned into strengths
There is no accessible real collision-observation dataset for Bengaluru. Most published bird-collision research and citizen-science tools (BirdCast, Global Bird Collision Mapper) are continental-US-centric. Rather than quietly relabeling bird-occurrence data as "collisions" to get a number, we built the honesty into the schema: every response distinguishes real environmental features from the still-synthetic benchmarking label, and the API reports feature coverage (8/10, 80%) instead of pretending every input is populated.
Migration intensity is seasonally autocorrelated, which breaks naive validation. We didn't discover this by accident — we built the random/temporal/geographic split harness specifically to try to break the model (per the project's own leakage-investigation protocol), and it did its job: it caught a real overestimation pattern instead of hiding it.
Accomplishments we're proud of
- Three independent real public data sources (OSM/Overpass, Open-Meteo, GBIF) actually integrated and joined by location and date, not mocked.
- A validation harness that catches its own inflated numbers, and a team willing to publish the catch instead of the inflated number.
- Full transparency in the product itself — feature-coverage percentages,
explicit
data_sourcetags, and an uncalibrated-thresholds disclaimer — rather than a confident-looking score with no caveats. - A real, deployed, explainable product (live link above), not a notebook.
What we learned
Real data is messier and more honest than synthetic data pretending to be real. The moment we swapped real OSM/Open-Meteo/GBIF features into the pipeline, missingness (a building with no OSM height tag, a night with no visibility reading) became a first-class product concern, not just a data- cleaning step — which is exactly why the risk engine reports confidence and feature coverage instead of a single unqualified number.
What's next for AERIS
- Pursue an actual collision-ground-truth source — a Global Bird Collision Mapper data-sharing request, or a local citizen-science partnership in Bengaluru — so the risk model can finally be validated against real outcomes instead of a benchmarking label.
- Enable the VIIRS nighttime-light connector by default once a shared Earth Engine service account is set up, closing the fourth data source.
- Re-run the temporal/geographic leakage harness the moment real labels exist, and publish whatever it finds — including if the model performs worse than the benchmark suggested.
Why AERIS deserves a look
Most environmental hackathon projects show a map. AERIS shows a validation methodology willing to report its own weak point — zero verified collision labels, stated plainly — right next to real, live, multi-source environmental data fusion that most teams would just claim was more finished than it is. That's the same bet Cadence made with its shuffled-source control: the number that survives an honest test is worth more than the number that doesn't get tested at all.
Built With
- fastapi
- gbif-occurrence-api
- nasa-viirs-(optional
- open-meteo-api
- openstreetmap-/-overpass-api
- python
- react
- scikit-learn
- shap
- via-google-earth-engine)
- vite

Log in or sign up for Devpost to join the conversation.