-
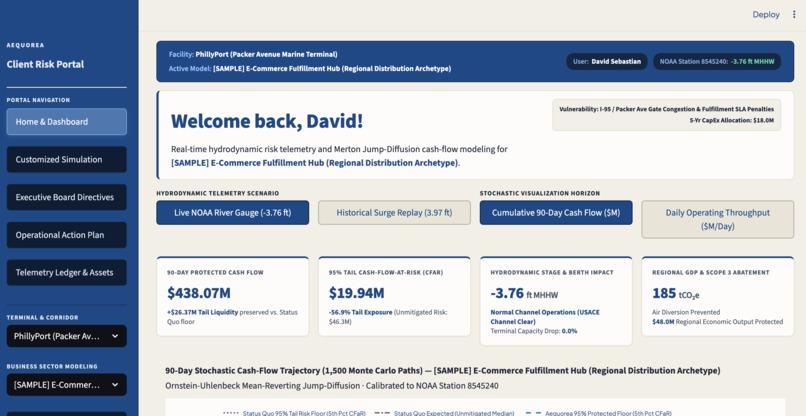
Client Portal Image 1
-
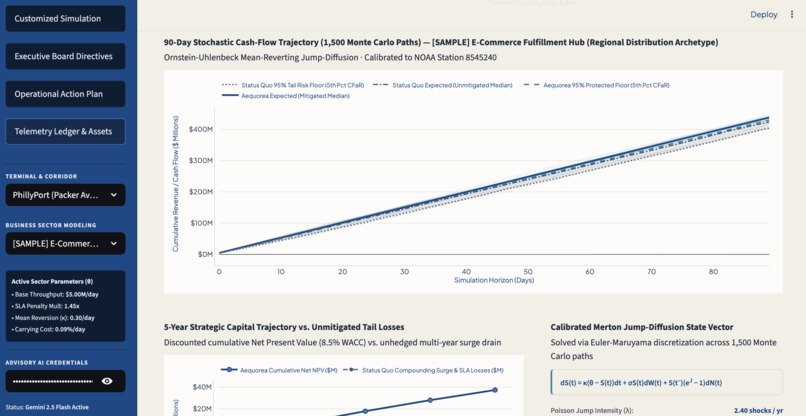
Client Portal Image 2
-
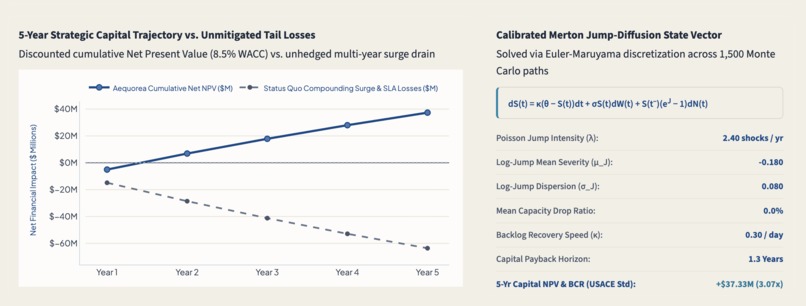
Client Portal Sample Close-Up
Named after Aequorea — a genus of bioluminescent jellyfish that illuminates ocean depths — our mission is to bring transparency to complex hydrodynamic hazards across maritime supply chains, delivering actionable financial clarity that protects both enterprise balance sheets and the planet.
Since the 1988 benchmark year for the IPCC, just 100 corporate and state entities have caused 71% of global industrial greenhouse gas emissions. Meaningful climate adaptation is routinely tabled, though, for executives and CFOs are judged on strict 90-day quarterly earnings calls. Long-term sustainability proposals that require heavy capital expenditures with 20-30 year horizons are also frequently viewed by Wall Street as immediate drags on operating profit.
Looking locally at the Delaware River maritime corridor and PhillyPort, I identified the operational failure that perpetuates this dynamic as climate-driven storm surges are shutting down coastal terminals with increasing frequency — seaborne transport. When a port locks its gates or becomes flooded, unprepared companies face late-delivery penalties and broken agreements, where to save their quarter, panic-charter emergency air freight transportation services are authorized, burning millions in both operation costs and emitting up to 50 times more CO2 per ton-kilometer than maritime shipping.
I realized that asking corporations to treat climate resilience as a corporate social responsibility initiative is extremely unrealistic. Instead, Aequorea uses live hydrodynamic data and stochastic financial modeling to prove that the status quo (inaction) is an actively losing business model, and that climate resilience is the most profitable financial decision a leadership team can make in both the 90-day quarter and the 5-year capital cycle by accounting for worsened seaborne transport as a result of worsened climate change.
Aequorea is a dual-horizon climate and financial decision engine, designed with:
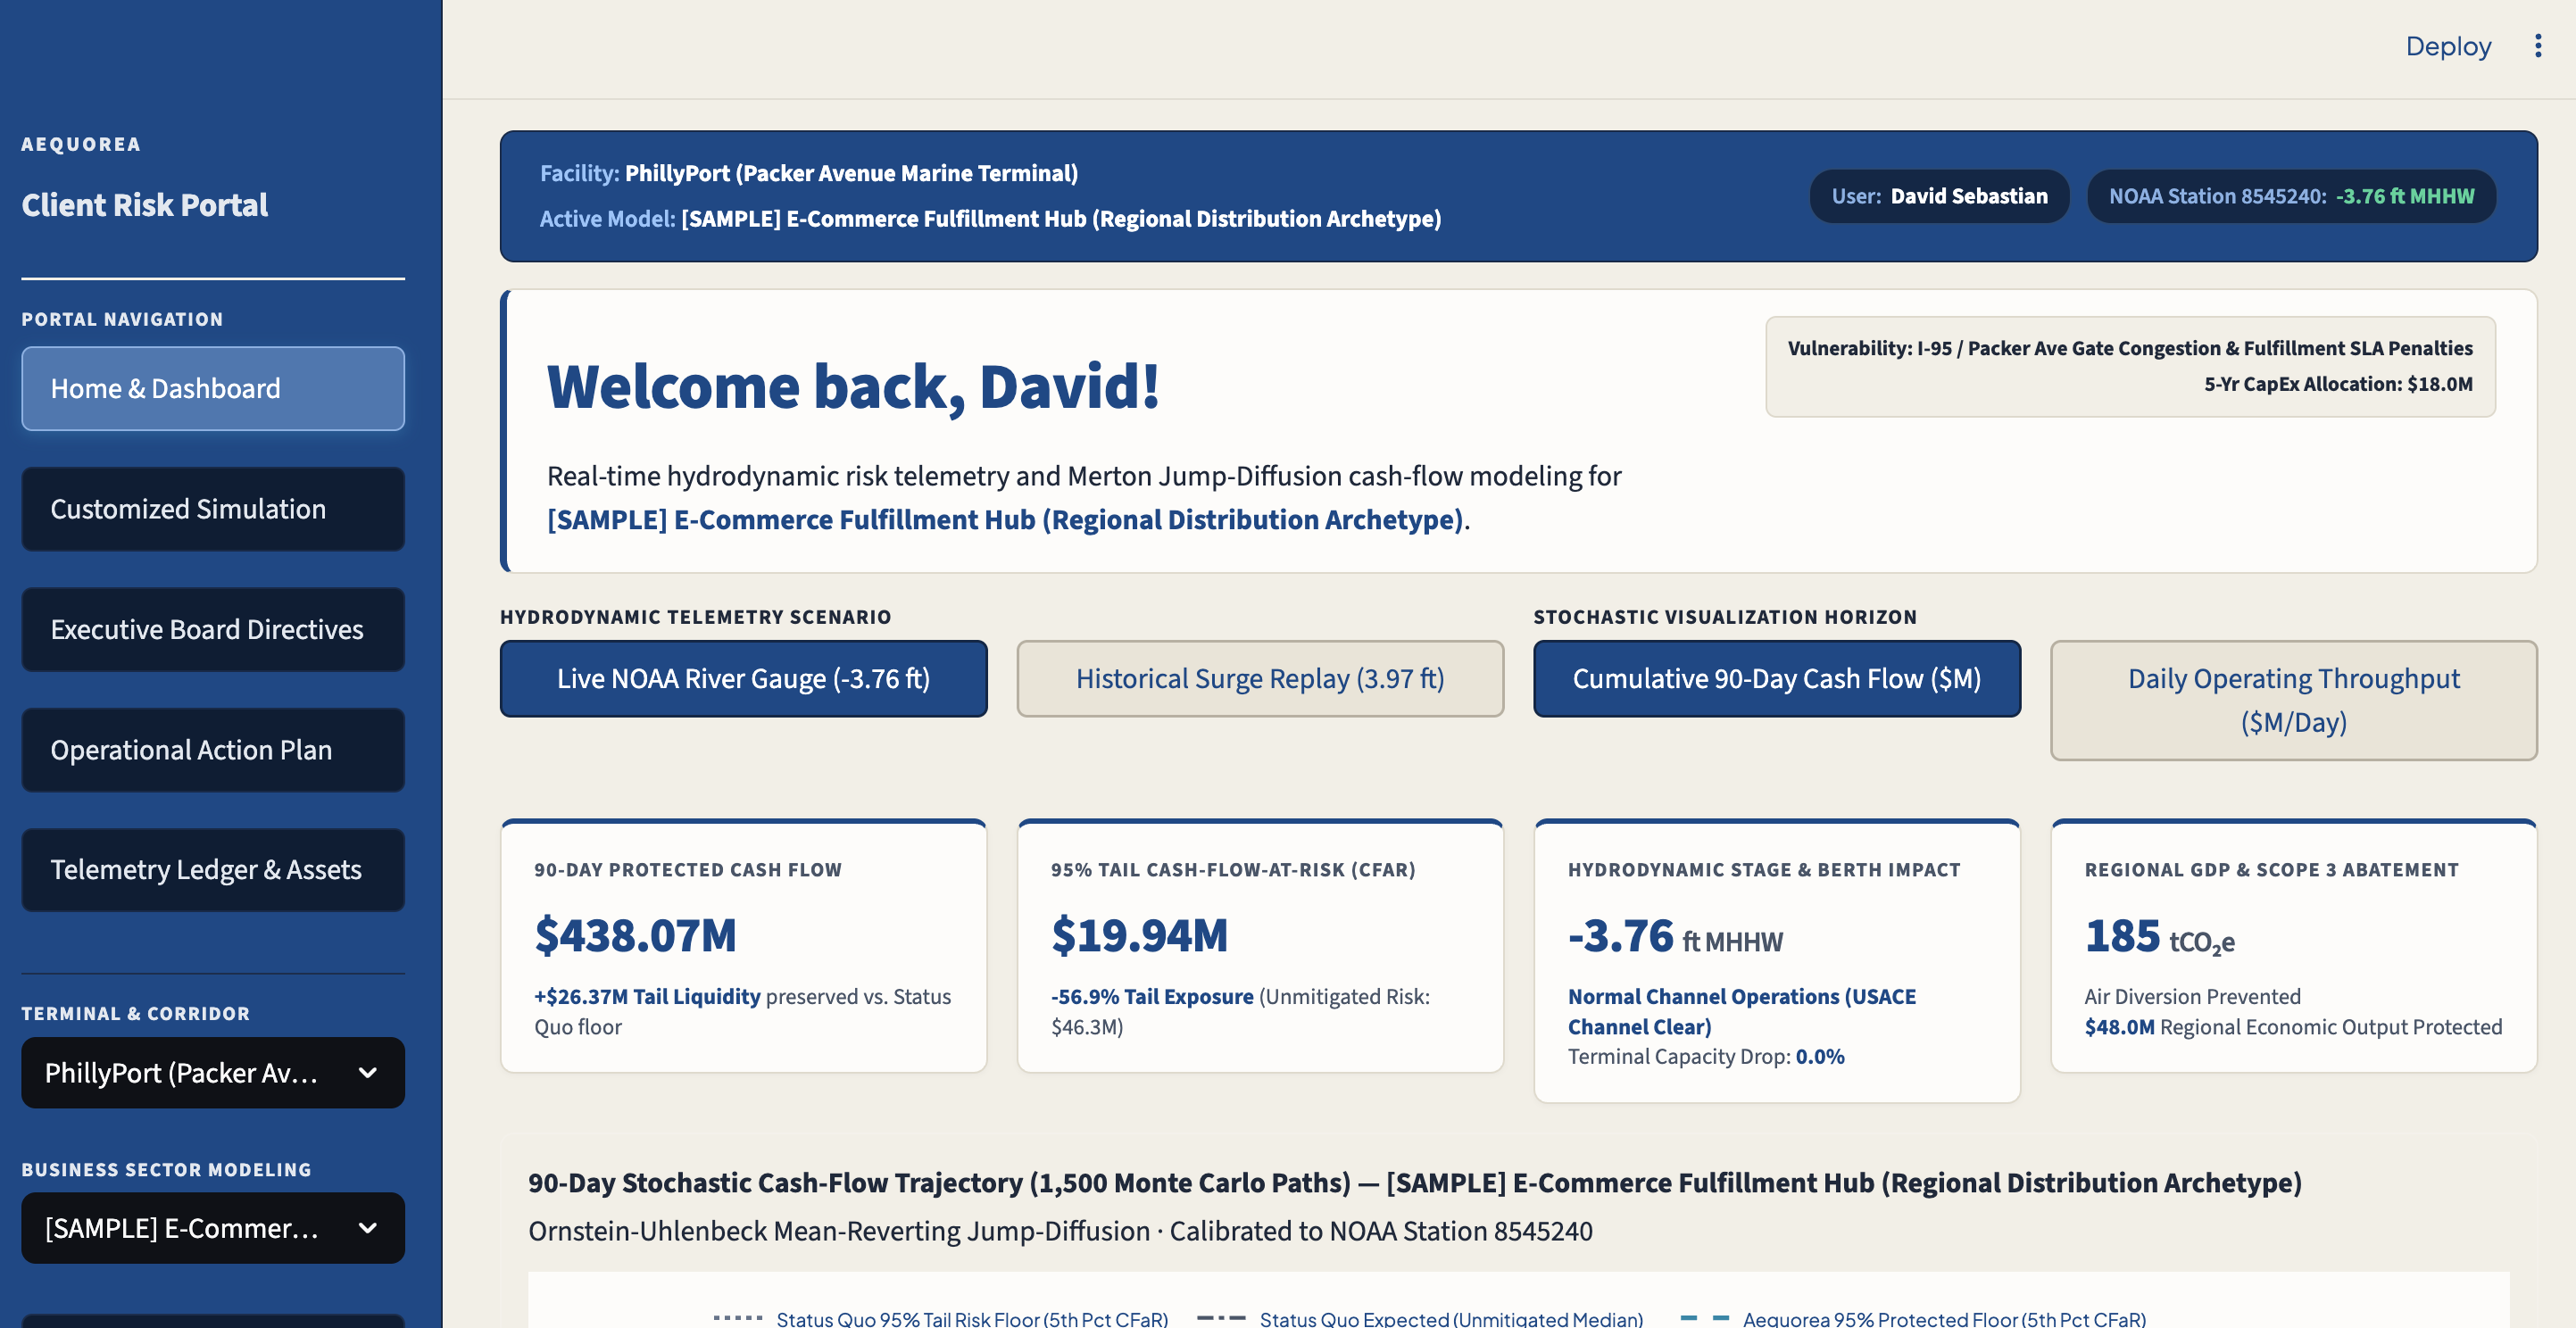
- Live Hydrodynamic Telemetry: Connects directly to NOAA stations on the Delaware River to monitor live tidal stages against National Weather Service minor and major flood "lockout" thresholds.
- Client Sandbox: Rather than relying on generic macro indices, clients can configure their, penalty breach multipliers, backlog recovery speed, and 5-year capital budgets.
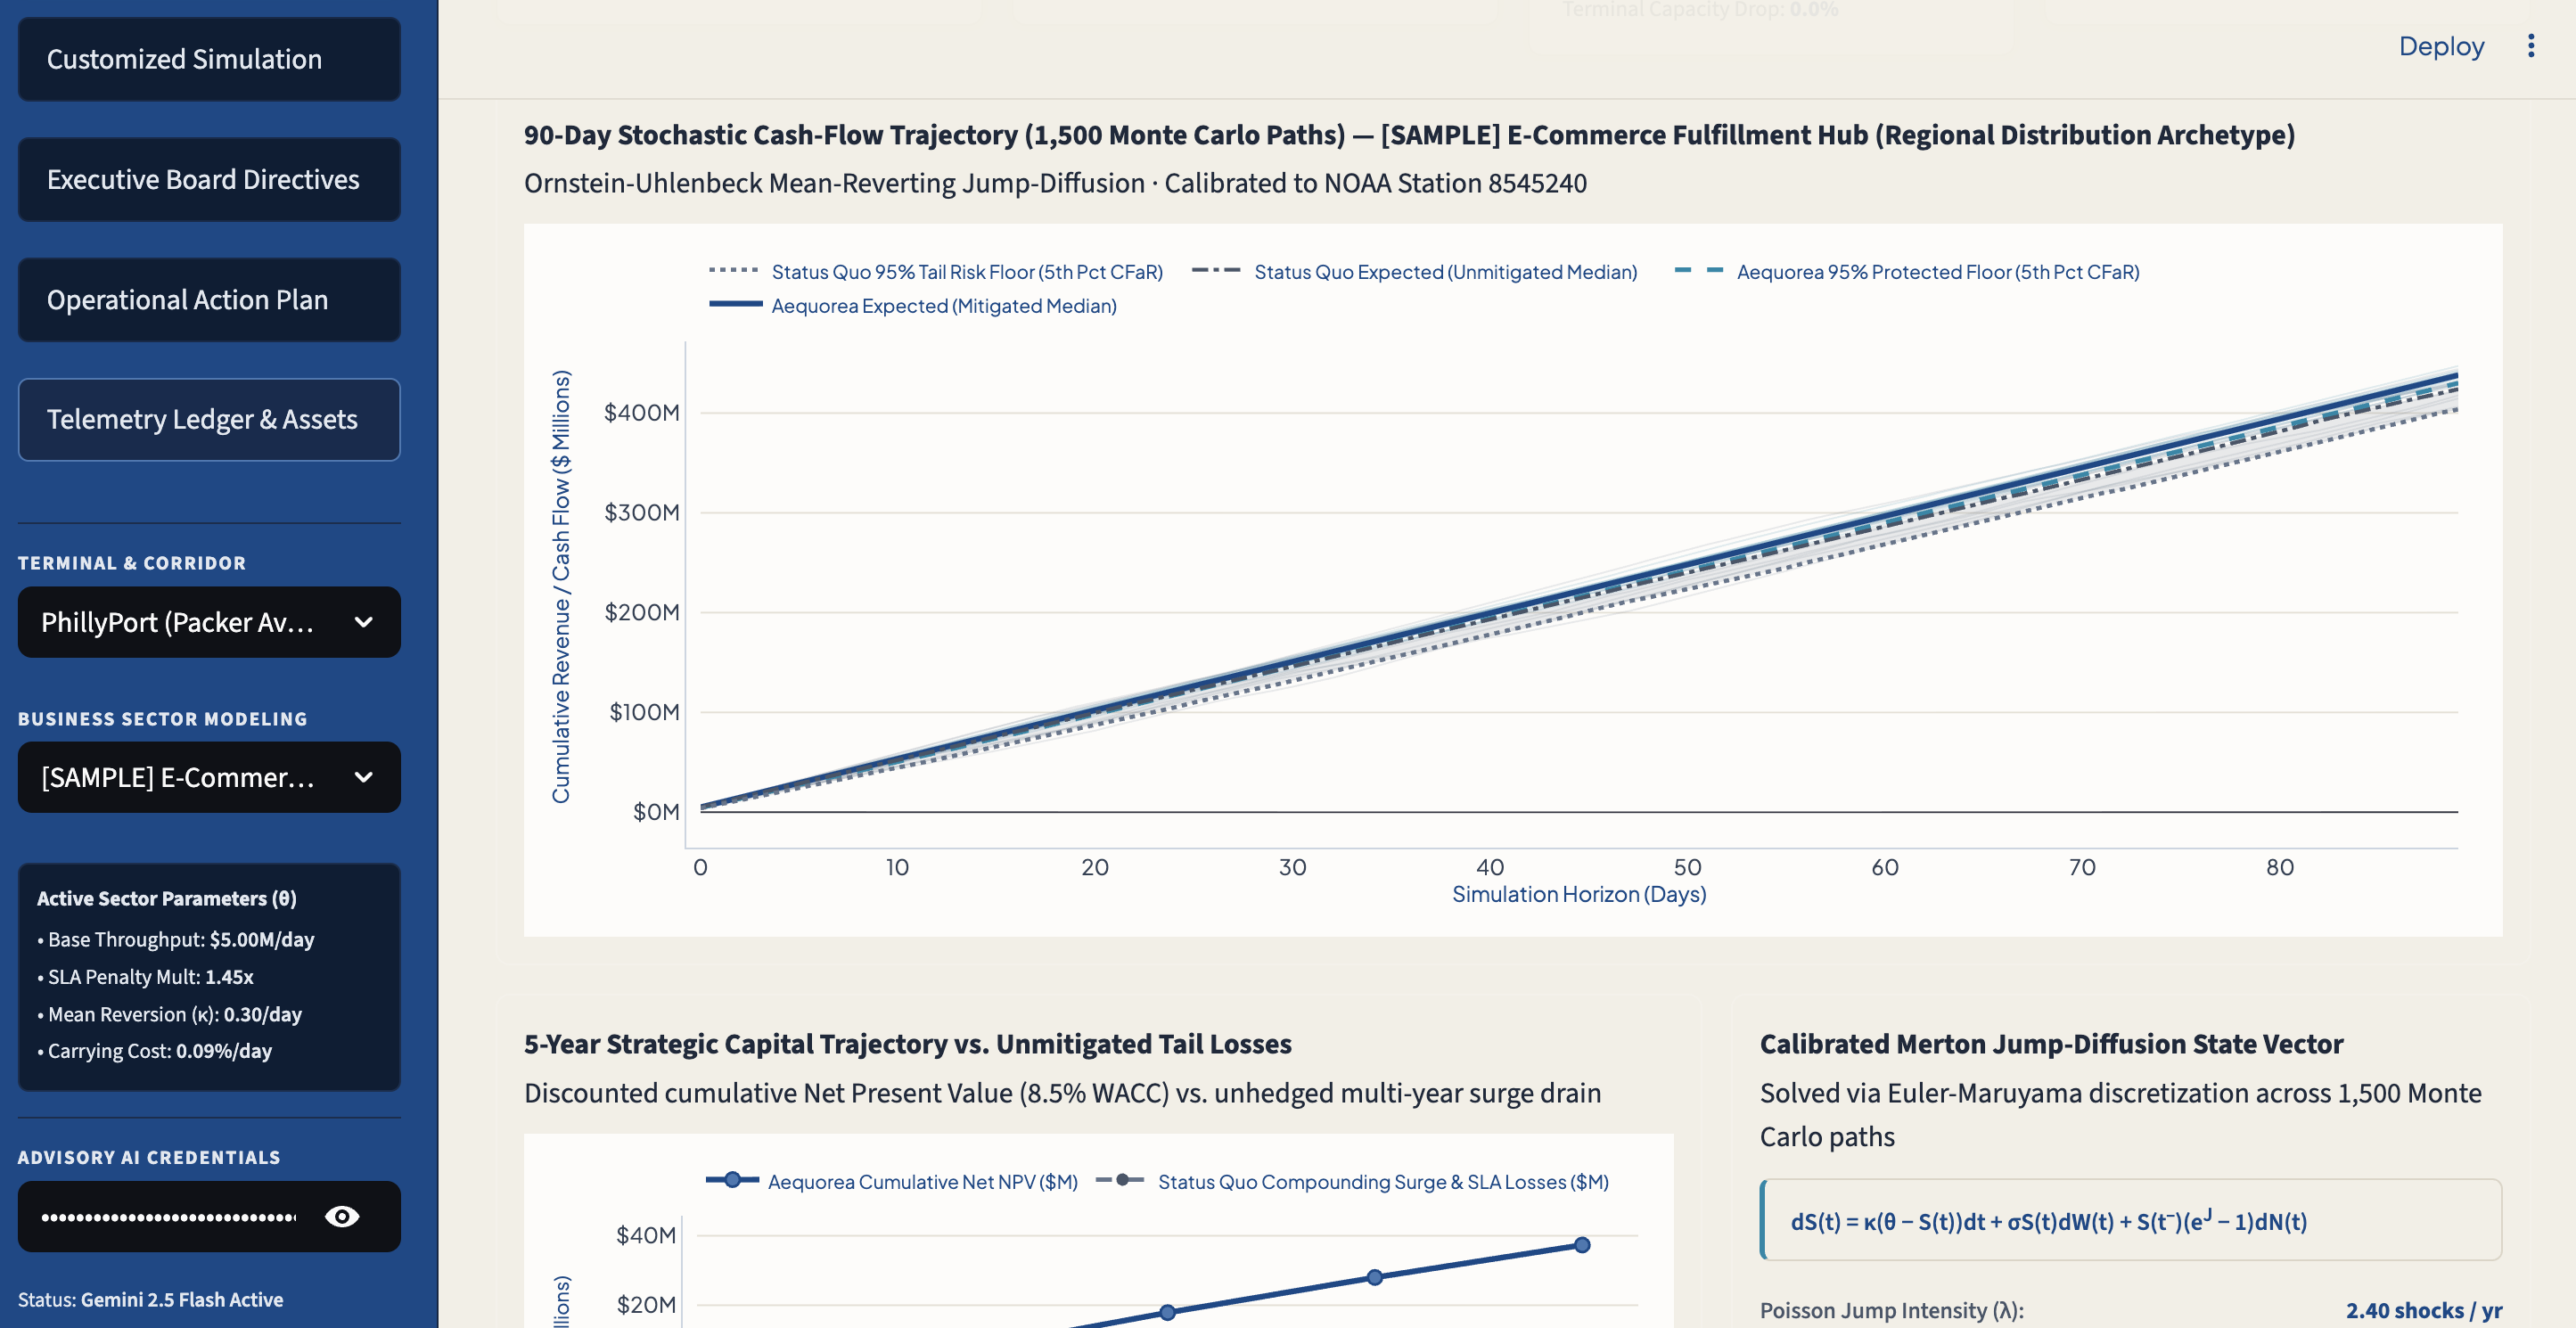
- Stochastic Modeling: Aequorea engine simulates 1,500 Monte Carlo futures across a 90-day window, using particle (Brownian) motion to mimic modern sporatic economic and transport systems. In contrasting the status quo (using severe tail-risk drawdowns, gate lockouts, and penalty compounding) against the Aequorea Mitigation Protocol, Aequorea calculates the exact dollar value of liquidity preserved.
- Dual-Horizon Advising Strategy: Short-Term (48-Hour Action): Triggers an automated intermodal pre-pull of container volume via freight rail to dry inland depots (Conrail Shared Assets to Lehigh Valley in practice), while confirming an automated insurance liquidity swap. In doing so, Aequorea locks in an operating revenue floor, eliminates delivery fines, and also halts high-emission air freight routings. Long-Term (5-Year ROI): Models capital allocation for off-dock depots, elevated reefer substations, and automated flood defenses discounted with a (removable) discount, delivering formal USACE-standard Benefit-Cost Ratios and timelines.
- AI Assistant: Leverages Google Gemini 2.5 Flash to translate complex math and economic terms into formal briefings, and provides an interactive advisor for natural language queries.
Aequorea was built across a full-stack data and analytics architecture:
1. Stochastic Calculus/Risk Engine:
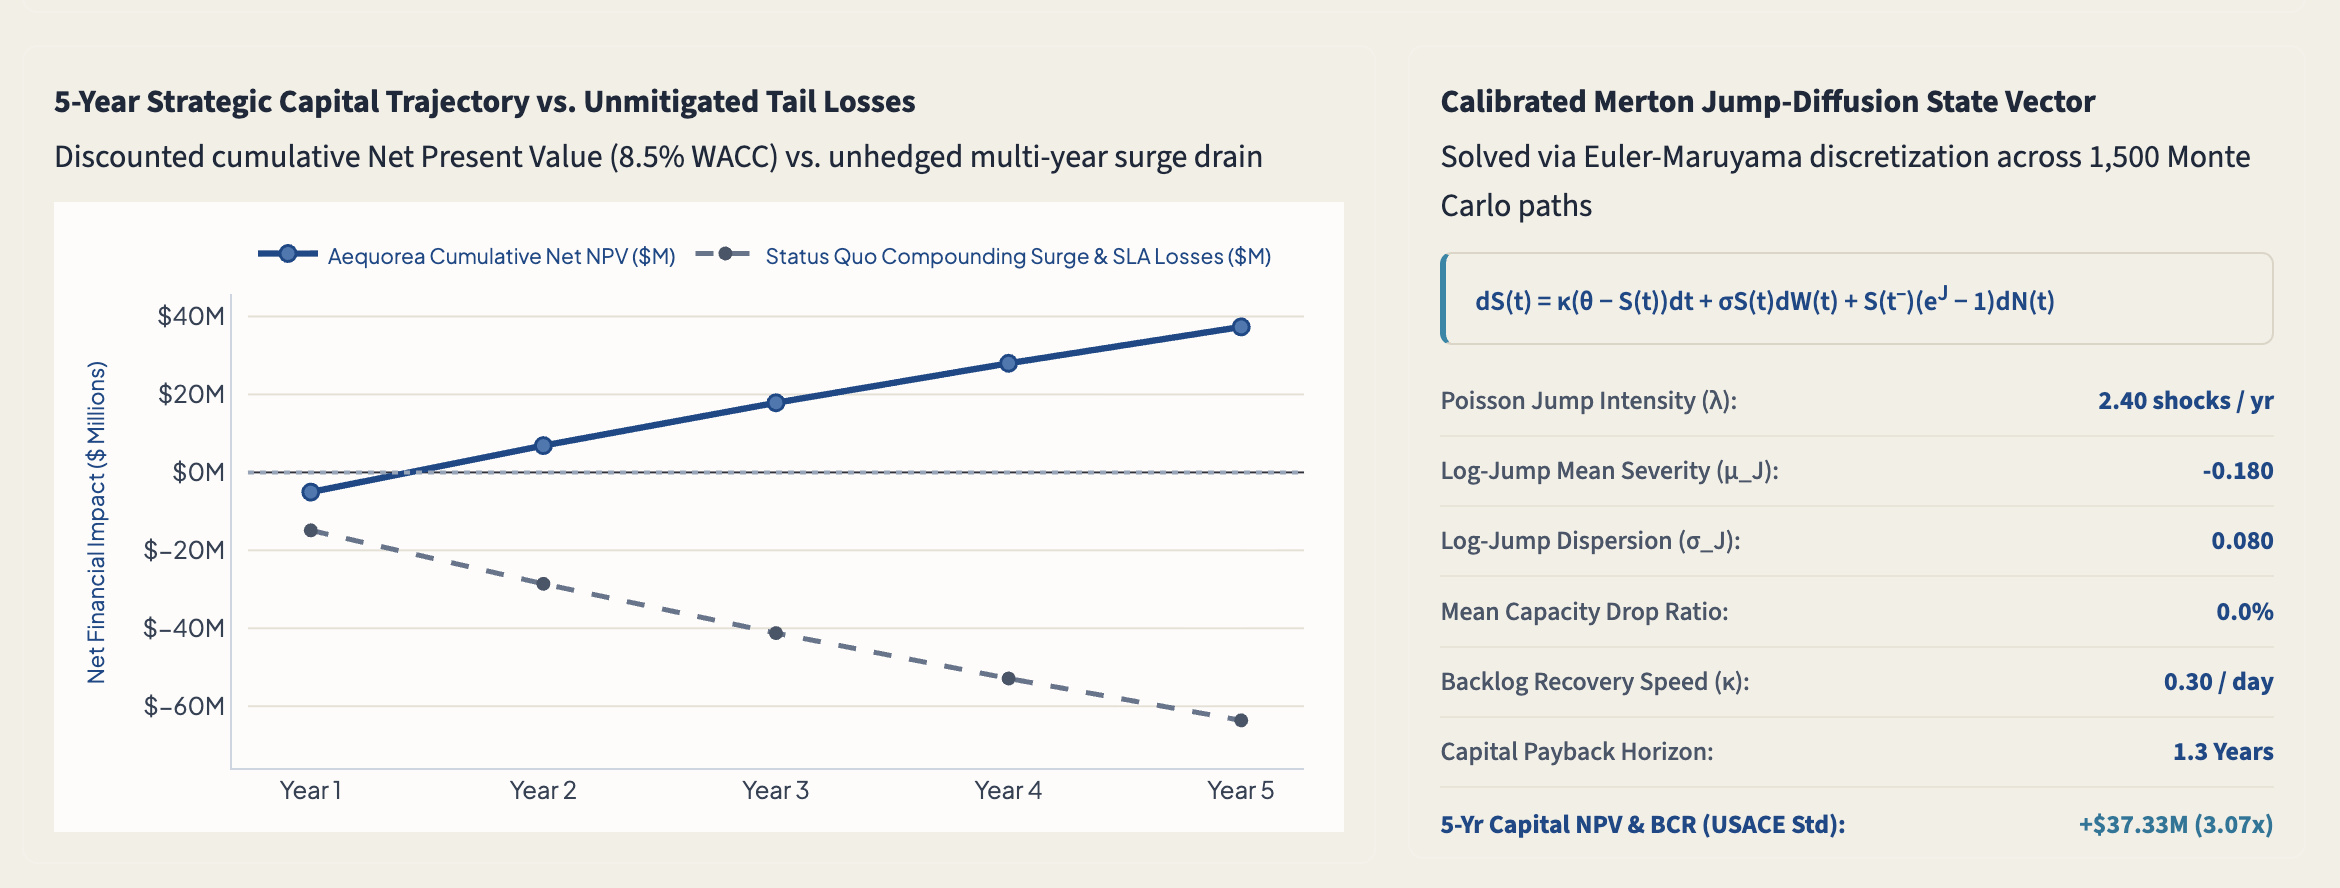
To model daily cargo throughput under coastal hazard shocks, I implemented an Ornstein-Uhlenbeck Mean-Reverting Merton Jump-Diffusion process, discretized via the Euler-Maruyama numerical scheme across 1,500 paths.
$$dS(t) = \kappa(\theta - S(t))dt + \sigma S(t)dW(t) + S(t^-)\left(e^{J(\beta)} - 1\right)dN(t)$$
- S(t) is the client's daily operating throughput in millions of dollars.
- θ (theta) is baseline daily capacity and κ (kappa) is queue clearance / recovery speed.
- σ S(t) dW(t) represents geometric Brownian motion for daily operational variance.
- dN(t) is a Poisson jump process with hazard arrival intensity λ, directly calibrated to live NOAA storm-surge flood stages.
- J(β) ~ N(μ_J, σ_J²) models jump-shock severity, where executing a 48-hour inland rail pre-buffer ratio β directly dampens the negative jump impact: μ_J,buffered = μ_J(1 - 0.70β).
A 95% Tail Cash-Flow-at-Risk (CFaR) at the standard 5th percentile is then computed.
2. 5-Year Scope:
- Discounted Capital Net Present Value (NPV): Evaluated against an 8.5% corporate Weighted Average Cost of Capital (WACC) over a 5-year operational horizon:
$$NPV = \sum_{t=1}^{5} \frac{\text{Annual Tail Liquidity Preserved}_t}{(1 + WACC)^t} - \text{CapEx}_0$$
- Benefit-to-Cost Ratio (BCR): Calibrated to U.S. Army Corps of Engineers (USACE) infrastructure evaluation standards to benchmark capital efficiency:
$$BCR = \frac{PV(\text{Benefits})}{\text{CapEx}}$$
- Carbon Multipliers: Regional economic output preservation is calculated using Bureau of Economic Analysis (BEA) RIMS II Type II multipliers. Scope 3 emissions reductions are determined by calculating ton-kilometers of prevented emergency air-freight cargo diversion and applying EPA maritime vs. aviation freight emissions factors.
3. Technology Stack:
- Data Layer: Real-time water level and predictive tidal crest feeds from the NOAA CO-OPS REST API.
- Time-Series Database: Tiger Data (TimescaleDB/PostgreSQL) engine implemented for logging immutable hypertable snapshots of river gauge readings and simulated disruption events.
- AI Governance Layer: Google Gemini 2.5 Flash was integrated with system prompts to translate simulations into natural language.
- Frontend: Streamlit styled with custom CSS architecture, custom typography, and an interactive Monte Carlo fan charts via Plotly.
Stochastic differential equations and their solutions can easily overwhelm a client. A big challenge was properly designing and formatting visual interfaces (Plotly, English checklists, etc.) that make the mathematics transparent without losing any accuracy. Additionally, integrating the live NOAA Delaware River station required understanding tidal datums — NOAA Station 8545240 reports water height relative to MHHW (Mean Higher High Water), meaning standard values register negative and only true storm surges yield positive. These had to be mapped accurately to the Poisson jump intensity factor in the SDE exhaustingly and through research. Achieving an executive dashboard in Streamlit was also very time-consuming, as it is an iterative process that is largely manual.
I learned much on searborne transport and economics throughout this process, as well as how to connect to physical environmental sensors and time-series databases into a responsive, real-time decision platform.


Log in or sign up for Devpost to join the conversation.