-
-
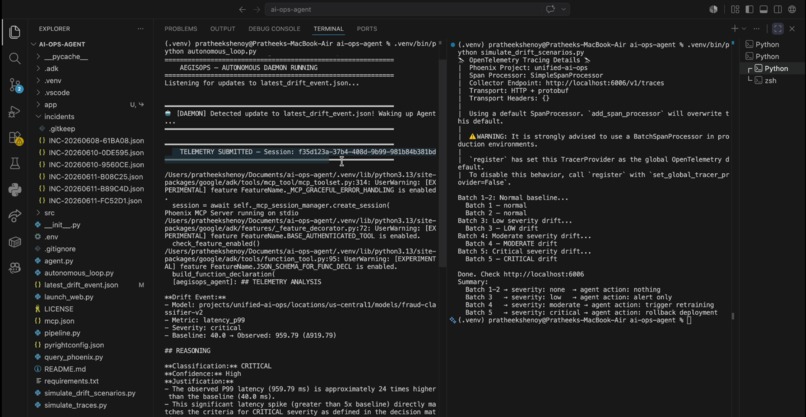
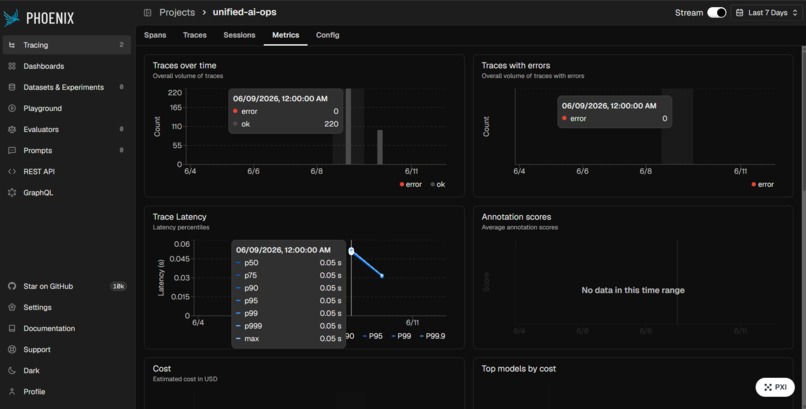
AegisOps detecting critical latency drift and reasoning through autonomous repair in real-time
-
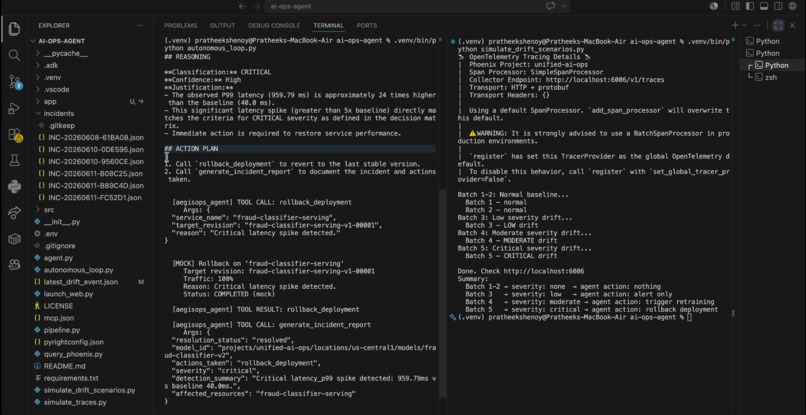
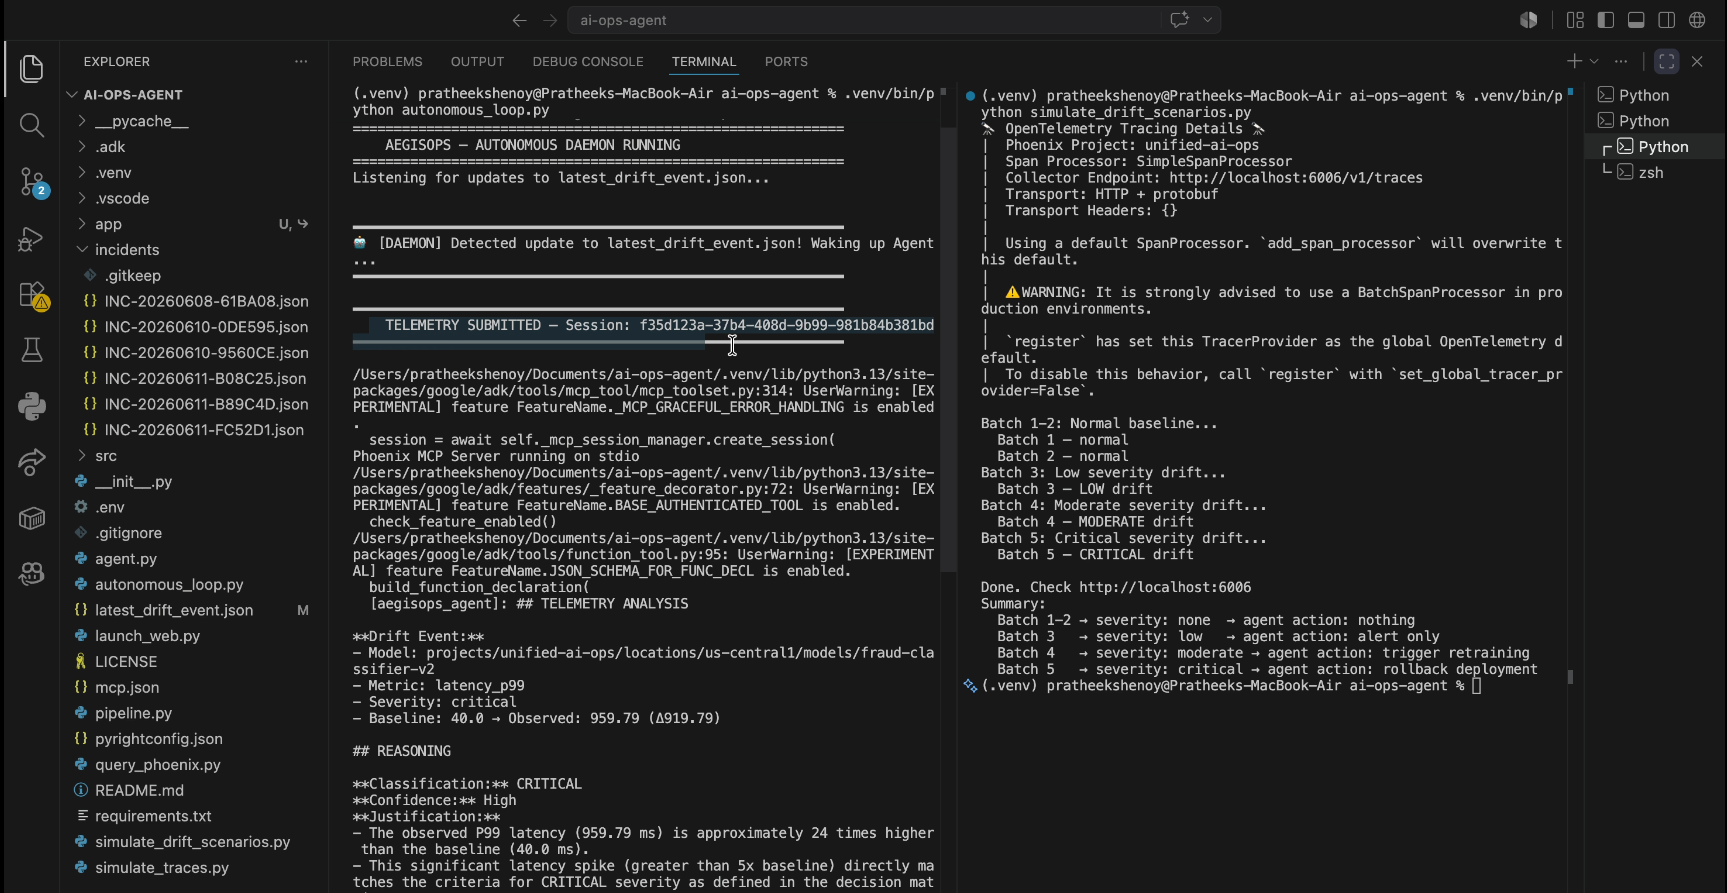
AegisOps autonomously executing a deployment rollback and generating an incident report via Gemini tool calls
-
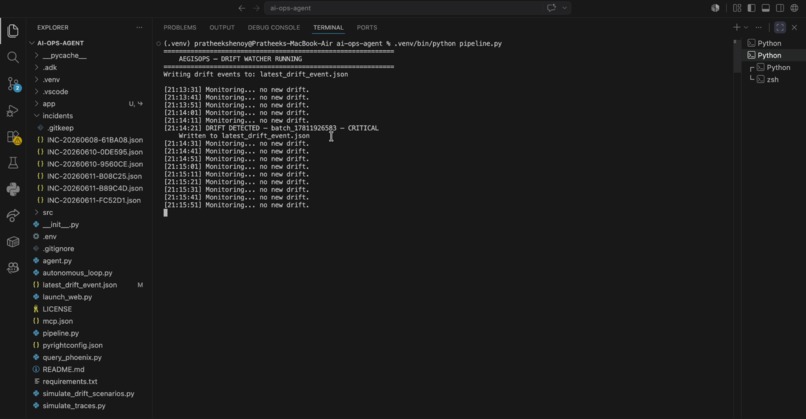
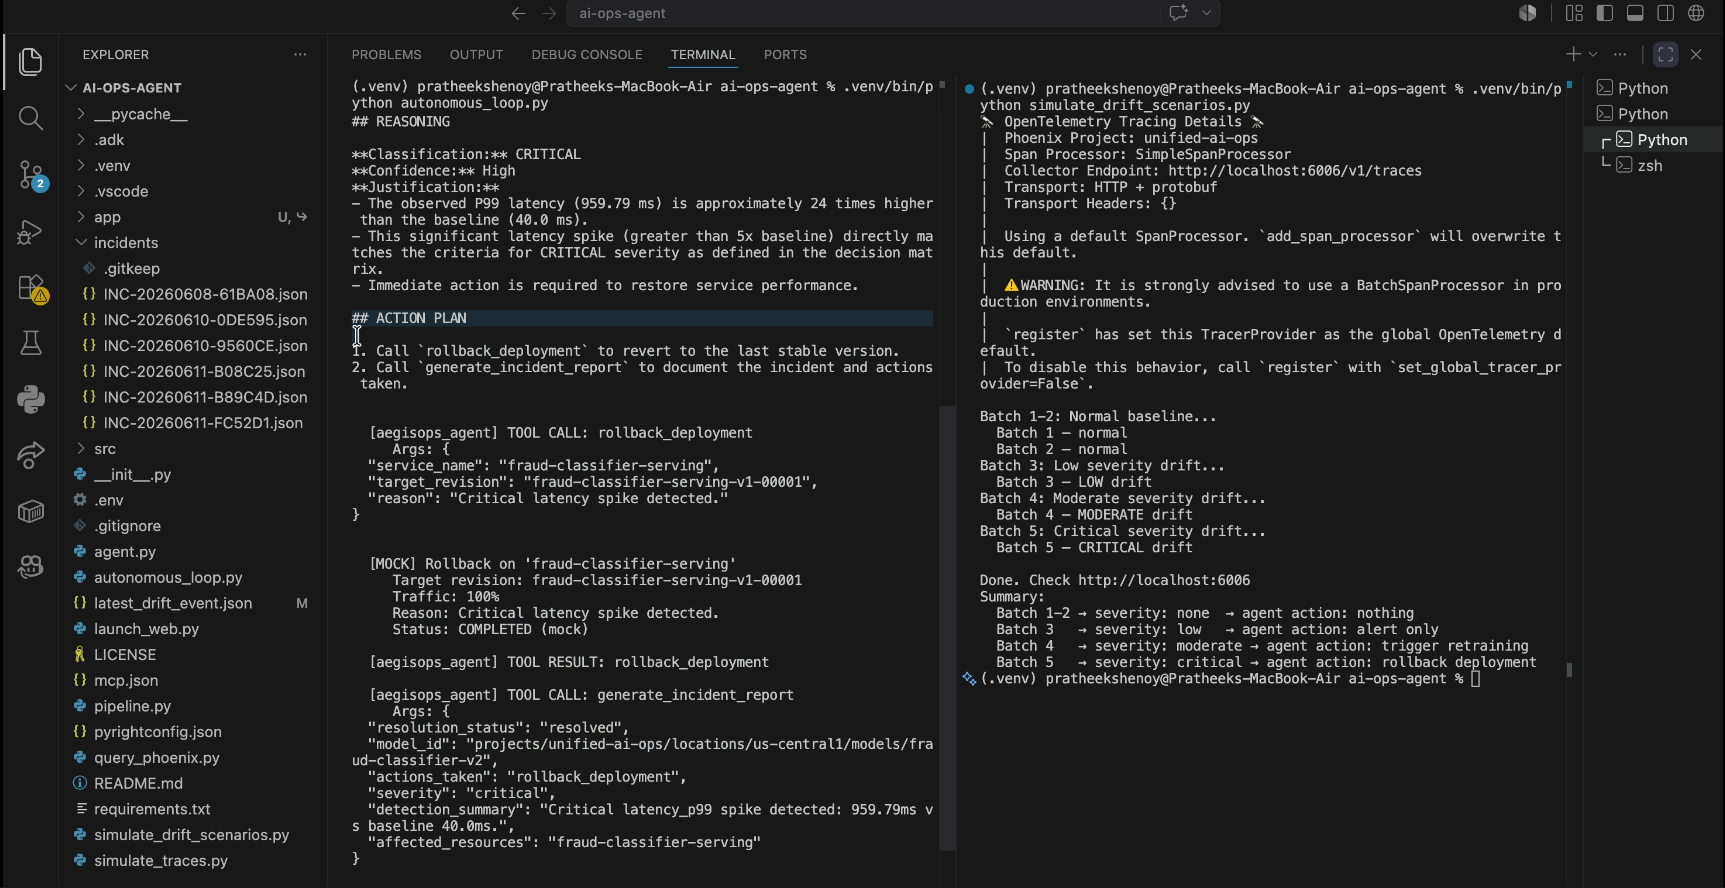
The AegisOps Drift Watcher identifying and logging a critical data drift event in real-time
-
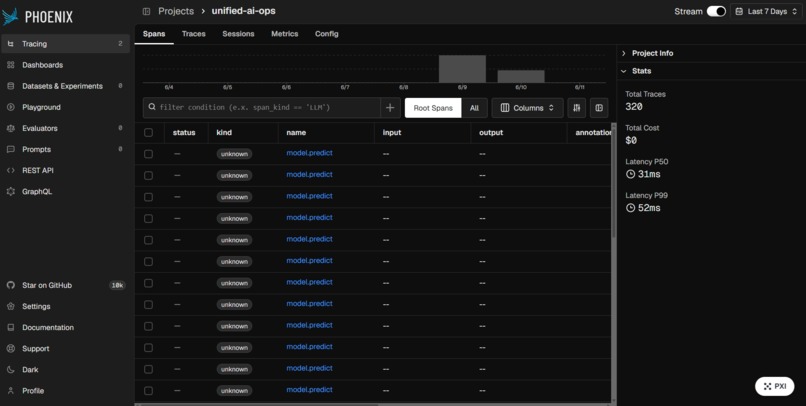
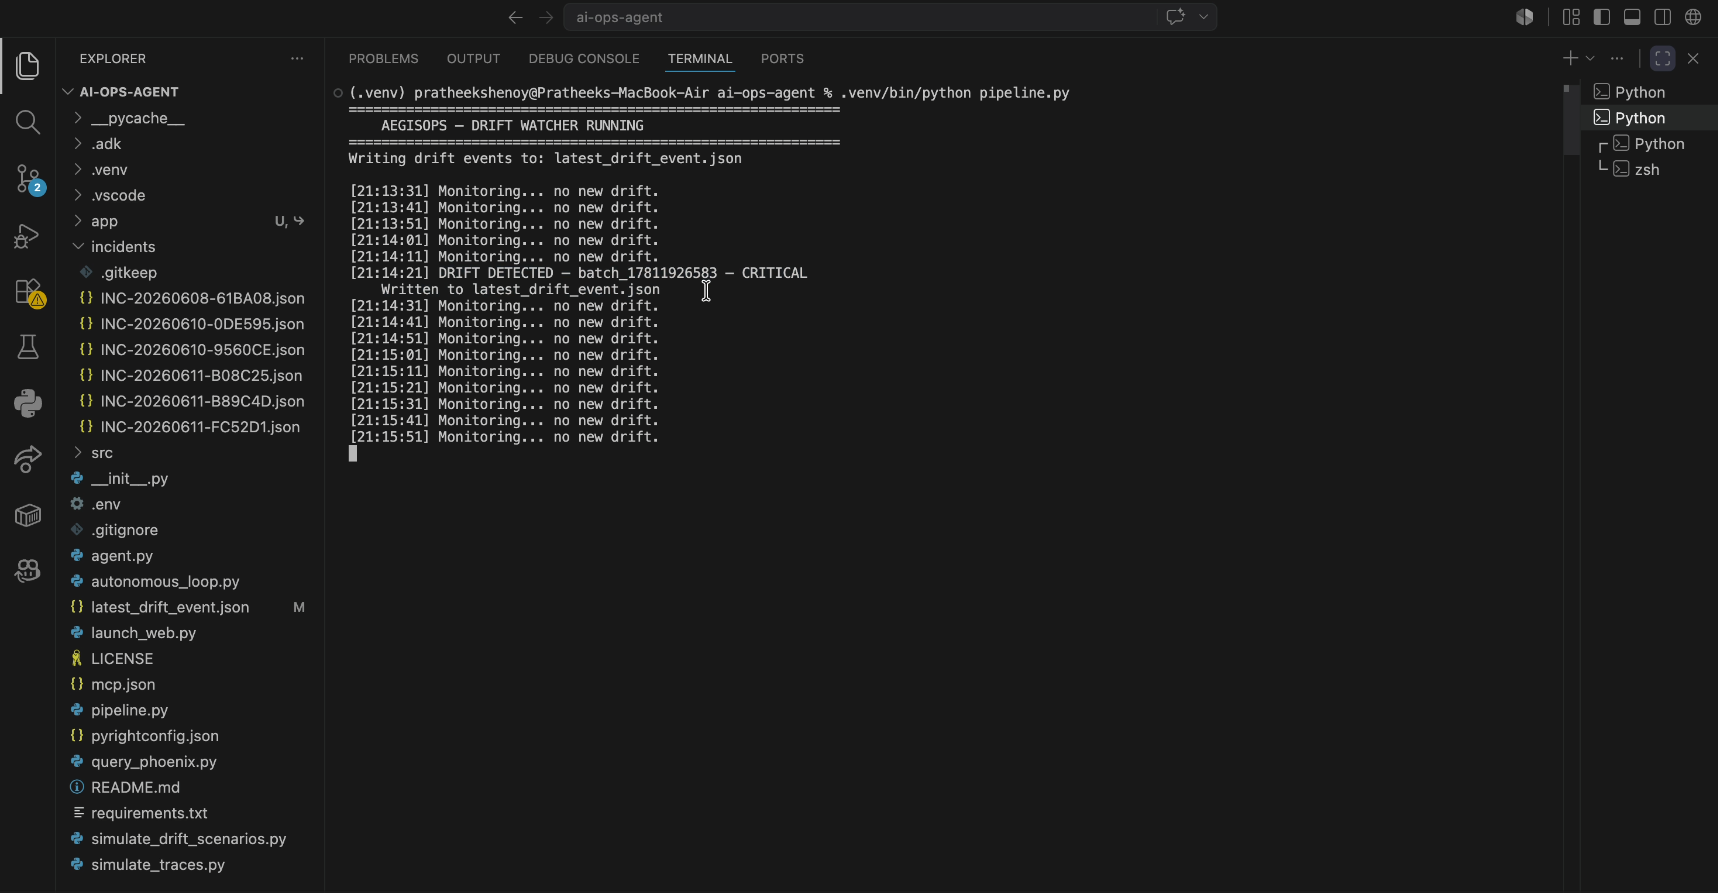
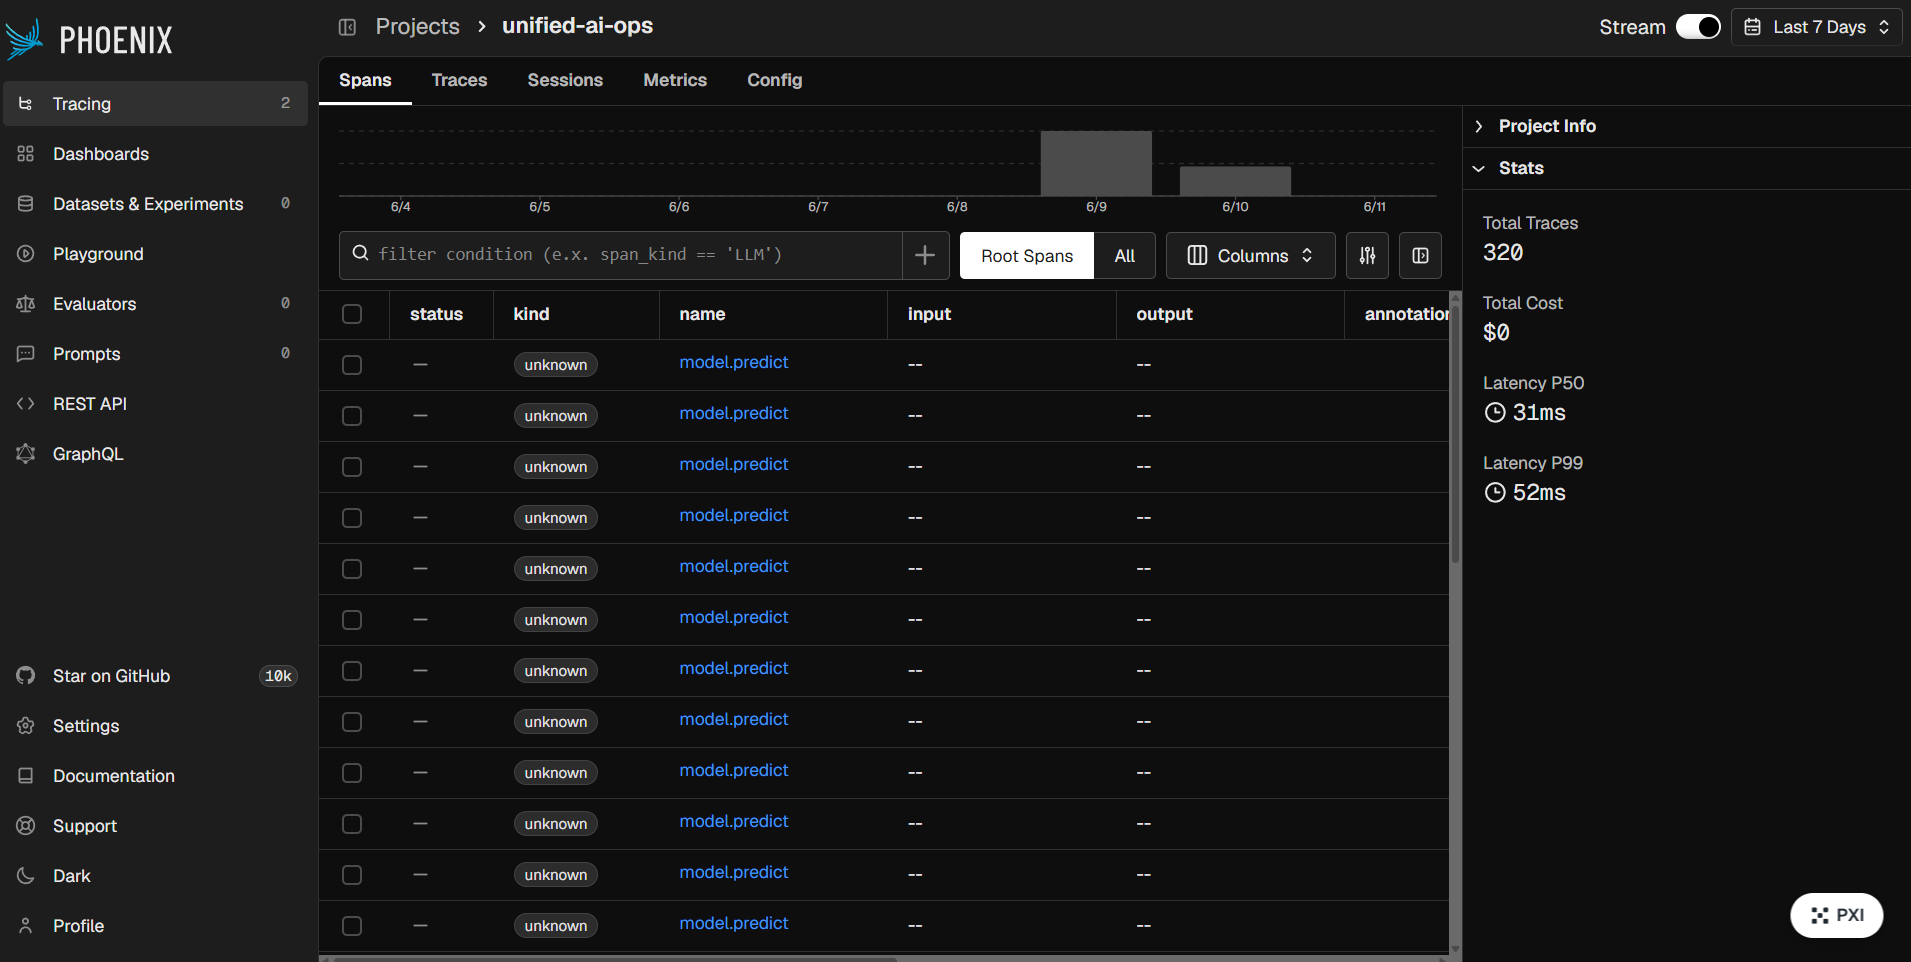
Live inference tracing and latency monitoring via the Arize Phoenix UI
-
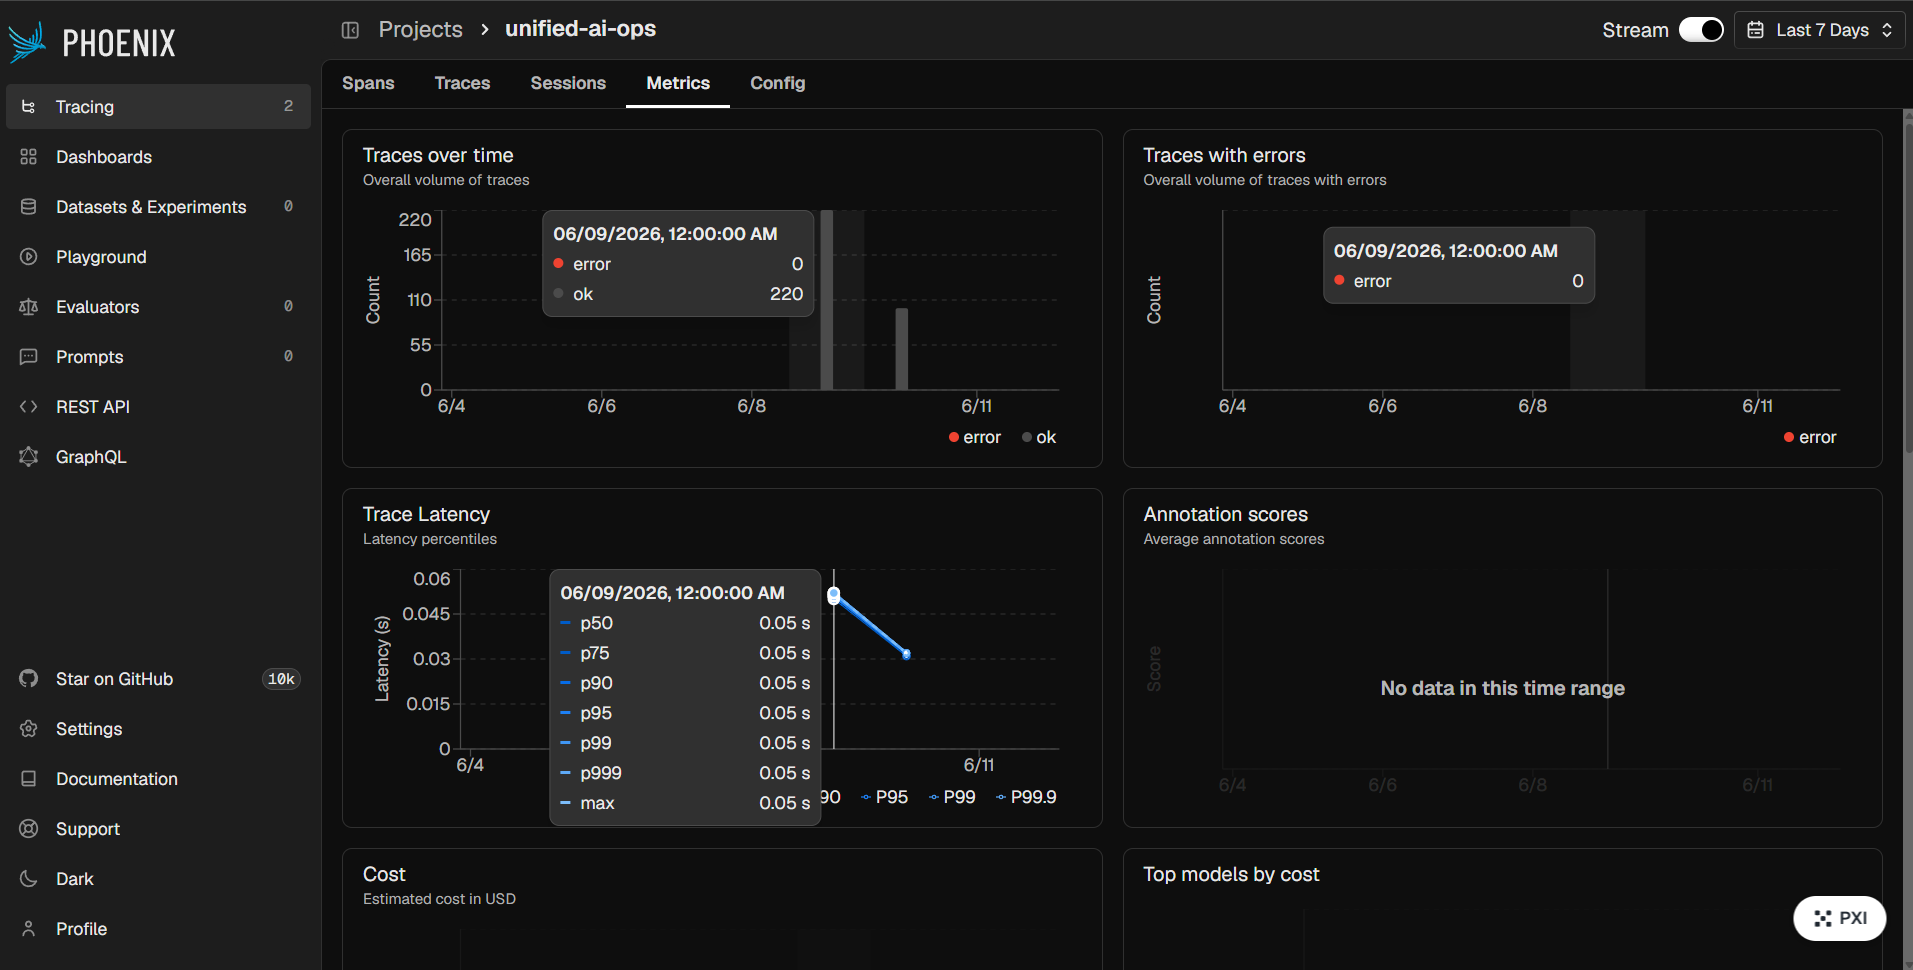
Monitoring trace volume and latency percentiles in the Arize Phoenix Metrics dashboard
Inspiration
In modern machine learning production, monitoring is purely passive. Traditional MLOps stacks operate on an alert-and-wait model: a model silently degrades—whether due to data drift, accuracy drops, or latency spikes—and a system fires an alert. From there, an on-call engineer must wake up, manually investigate the root cause, isolate the compromised data batch, trigger a retraining pipeline, and decide whether a model rollback is safe.
We asked ourselves: Why are we using state-of-the-art AI models, yet relying on manual human intervention to keep them healthy? This inspired AegisOps—the autonomous MLOps engineer that never sleeps. We wanted to build a closed-loop system that moves from passive monitoring to autonomous action.
What it does
AegisOps doesn't just surface alerts; it actively repairs the system. It intercepts telemetry metrics from production models, reasons through the severity and risks of the anomalies, and dynamically executes infrastructure commands to heal the pipeline. Depending on the severity of the drift, the agent can autonomously quarantine bad data, spin up retraining pipelines, or trigger instant rollbacks to a stable revision—all with zero manual intervention.
How we built it
We engineered AegisOps by partitioning the architecture into two core domains:
- The Telemetry Layer: We used Arize Phoenix as our observability foundation to log live inferences. To bridge the gap to our agent, we exposed a Model Context Protocol (MCP) server. The server tracks live evaluation metrics and packages them into a strict telemetry event contract detailing metric deltas, including Population Stability Index ($PSI$), Accuracy Drop ($\Delta A$), and Latency thresholds ($P_{99}$).
- The Agent Orchestration: We utilized the Google Agent Development Kit (ADK), leveraging Gemini 2.0 Flash as the agent’s reasoning engine. The ADK agent continuously polls the MCP server and consumes the telemetry context when thresholds are violated.
- The Autonomous GCP Tooling: We built a suite of tools for the agent to invoke:
- Cloud Storage (GCS) Tool: Quarantines the specific time-bound data window $[t_{start}, t_{end}]$.
- Vertex AI Pipelines Tool: Asynchronously invokes a clean retraining run using historical dataset slices.
- Cloud Run Tool: Executes atomic rollbacks to the last-known-stable revision during high-severity failures.
Challenges we ran into
- The Integration Contract Handshake: A major hurdle was deciding how the telemetry data should be formatted. If the schema changed slightly, the agent's tool calls would break. We solved this by establishing a strict, immutable JSON schema contract for the
drift_eventbefore writing any prompt code. - Mitigating "Hallucinatory Actions": Giving an agent control over production tools like Cloud Run Rollbacks is inherently risky. We heavily optimized our prompt engineering, forcing a strict deterministic output structure. The agent must successfully output a transparent, structured incident report containing its explicit chain-of-thought before executing destructive GCP commands.
- Asynchronous Monitoring: Vertex AI pipeline runs do not finish instantly. Building asynchronous polling loops that allowed the agent to hand off the execution while validating system recovery without blocking the server required complex fine-tuning.
Accomplishments that we're proud of
We successfully delivered a robust, self-healing architecture. Our demo script successfully simulates a critical drift injection attack, watches the observability layer catch the anomaly, shows the Gemini agent evaluating the problem in real-time, and confirms zero manual intervention as Cloud Run automatically safely rolls back deployments to a healthy state. Moving an LLM from an advisory role to an active executor in a production environment is a massive milestone.
What we learned
Building AegisOps deepened our understanding of translating raw analytical statistical metrics into concrete deterministic actions. We learned how to formulate thresholding logic mathematically for the agent to consume. For instance, the agent analyzes data drift via the Population Stability Index ($PSI$), calculated as:
$$PSI = \sum_{i=1}^{k} \left( Actual_i - Expected_i \right) \times \ln\left(\frac{Actual_i}{Expected_i}\right)$$
We learned that an LLM can flawlessly consume these mathematical limits—like triggering alerts for minor drift ($PSI \le 0.1$) versus executing rollbacks for critical drift ($PSI \ge 0.25$)—and reliably select the correct API tool contract.
What's next for AegisOps
- Granular Deployment Strategies: Expanding the toolset to support automated canary rollouts and A/B testing recovery, rather than just atomic rollbacks.
- Multi-Agent Orchestration: Splitting the monolithic agent into a "Triage Agent" (focused solely on root cause analysis) and an "Execution Agent" (focused strictly on infrastructure changes and state management).
- Broader Observability Support: Building out MCP connectors for Datadog, Prometheus, and Grafana to make AegisOps platform-agnostic.
Built With
- arize-phoenix
- cloud-run
- gemini-2.0-flash
- google-adk
- google-cloud
- json
- mcp
- mlops
- python
- vertex-ai

Log in or sign up for Devpost to join the conversation.