Inspiration
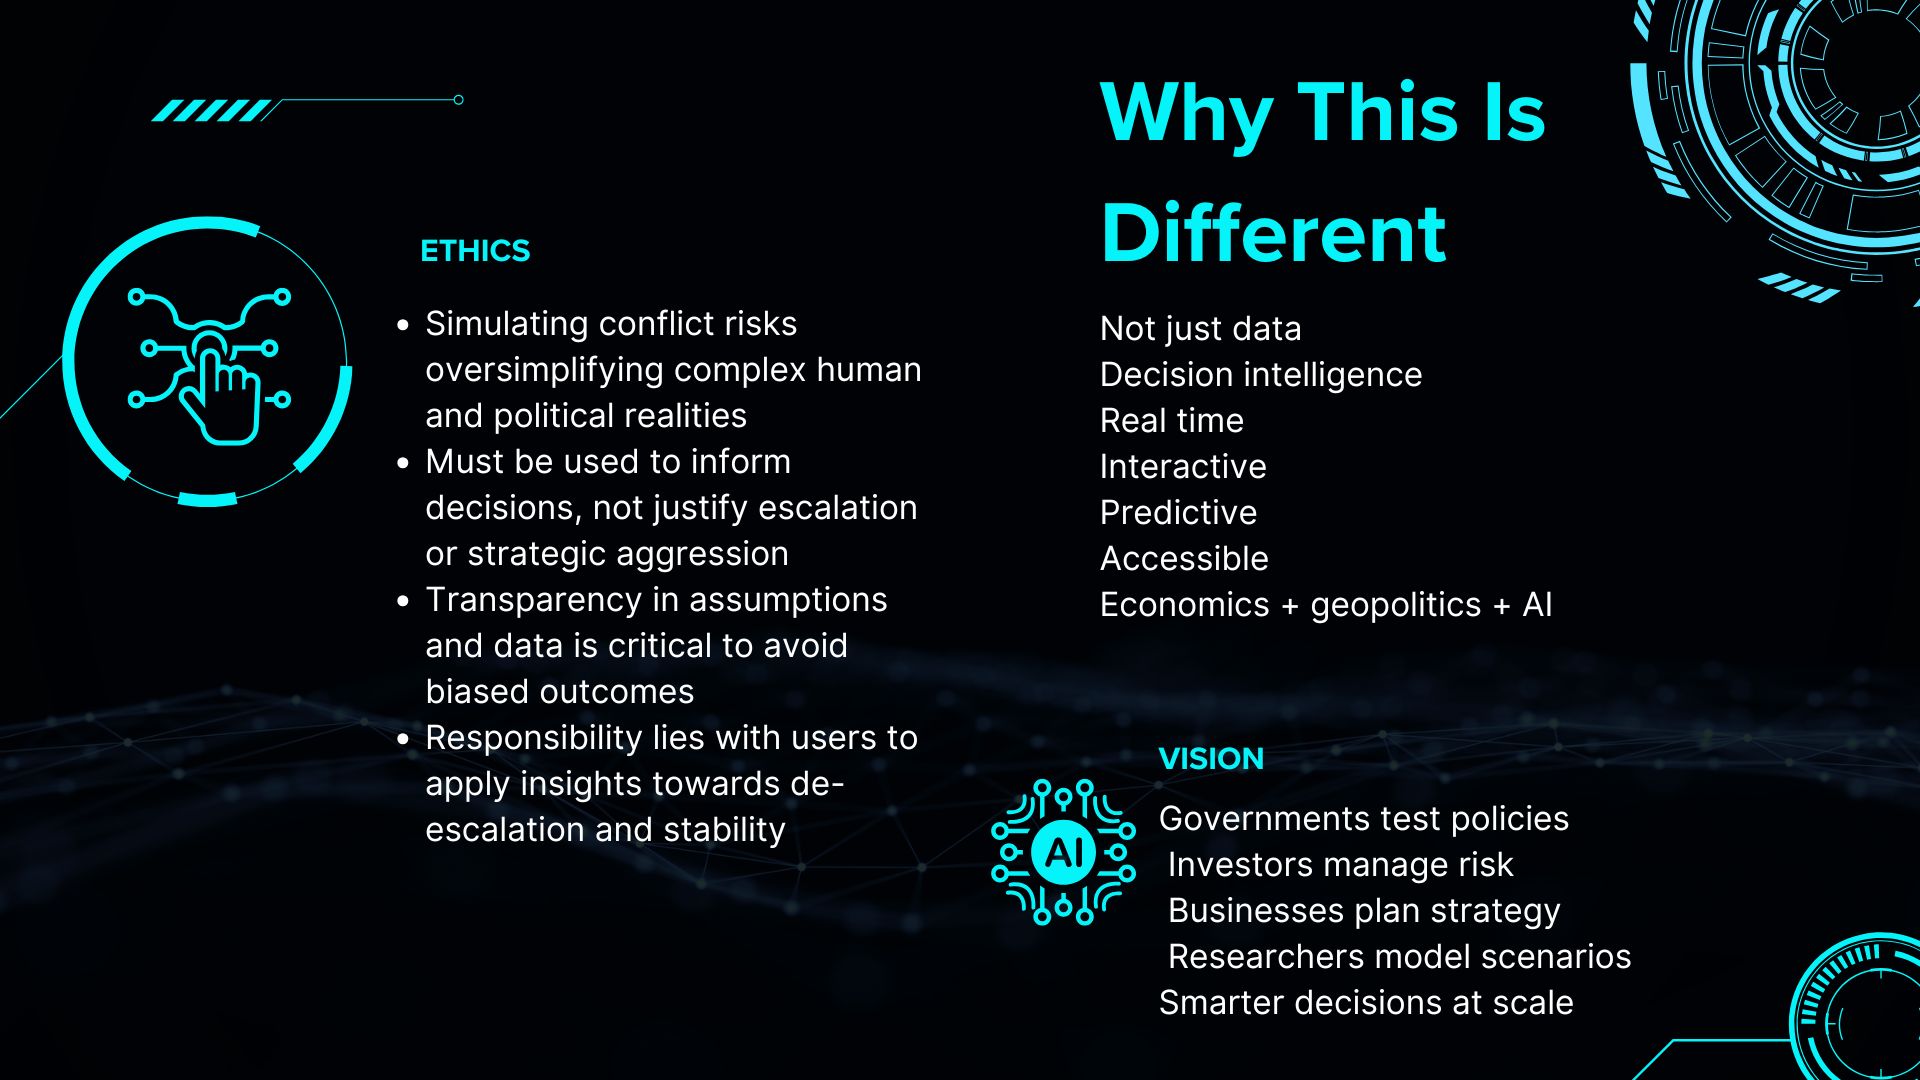
Geopolitical crises don't happen overnight — they escalate through a chain of decisions that could have been stress-tested. We wanted to build a tool that makes the economic consequences of those decisions visible, fast, and data-driven.
What it does
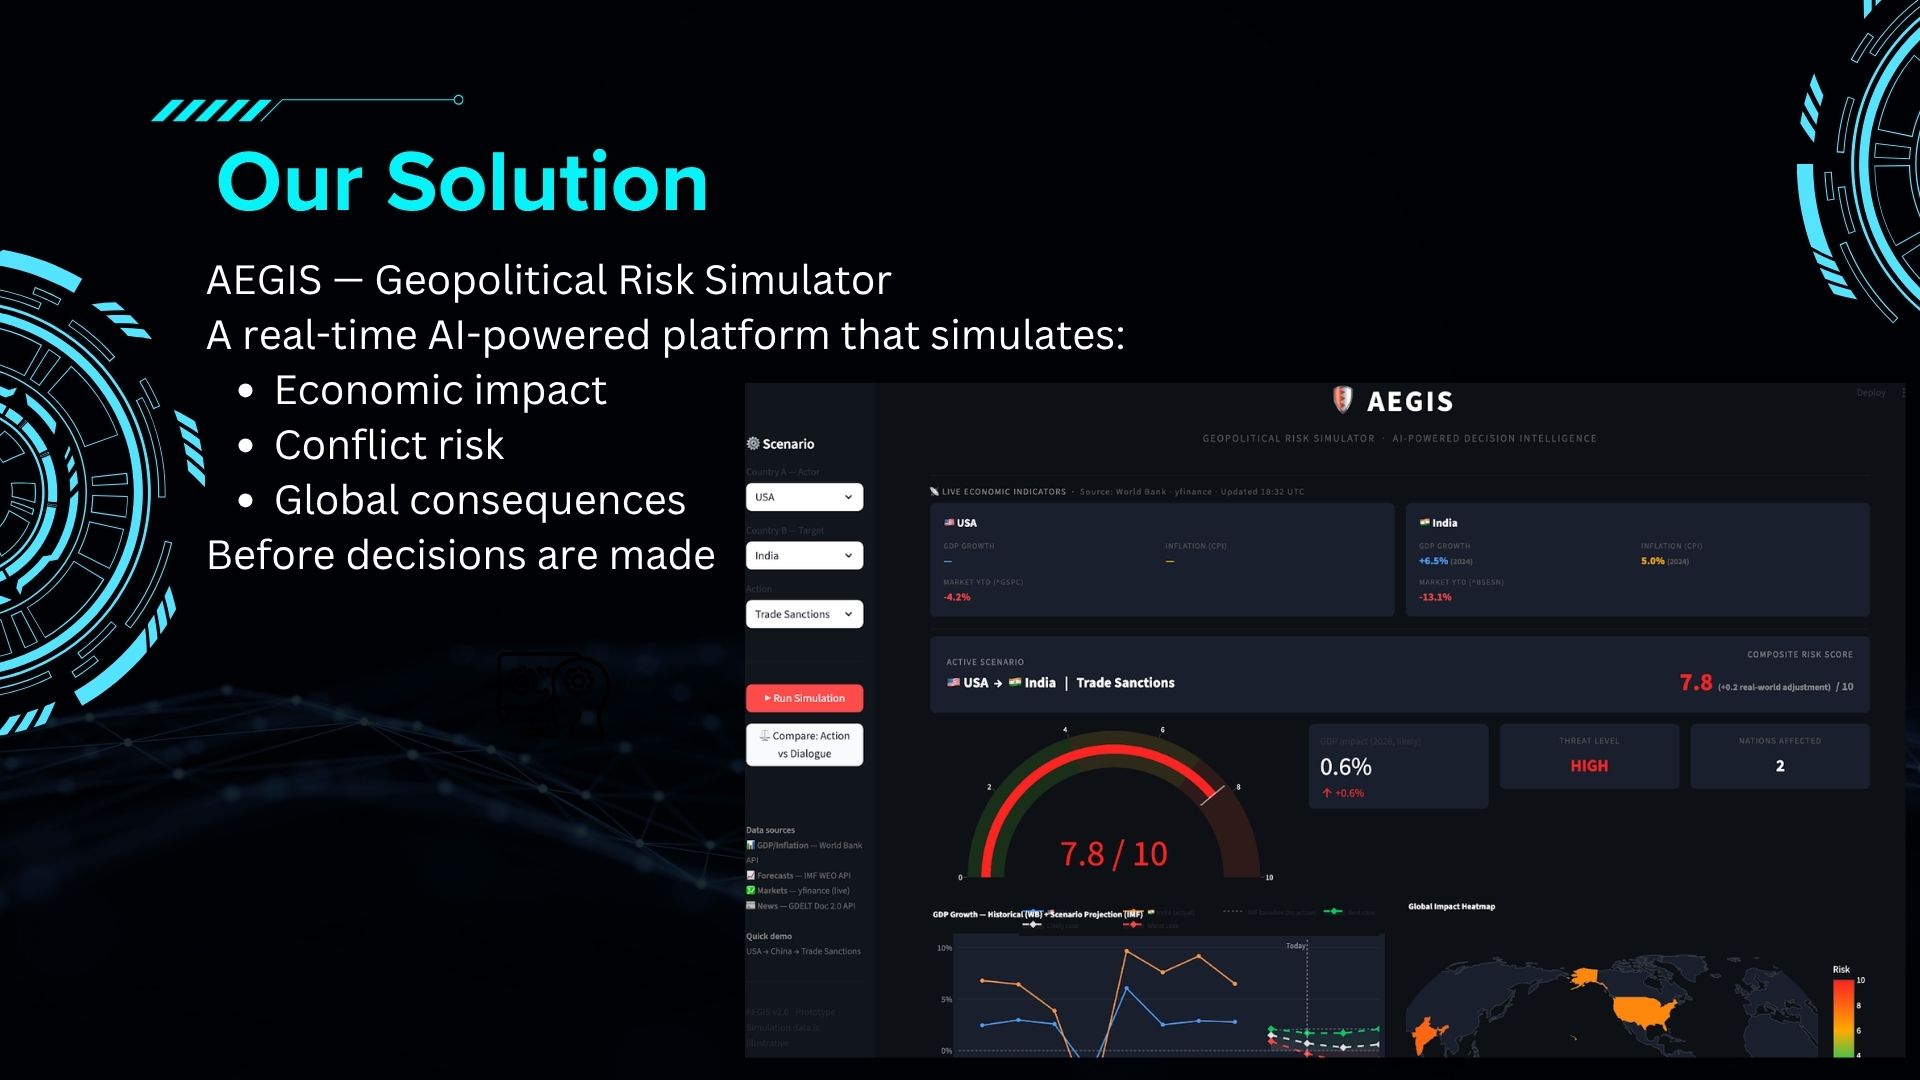
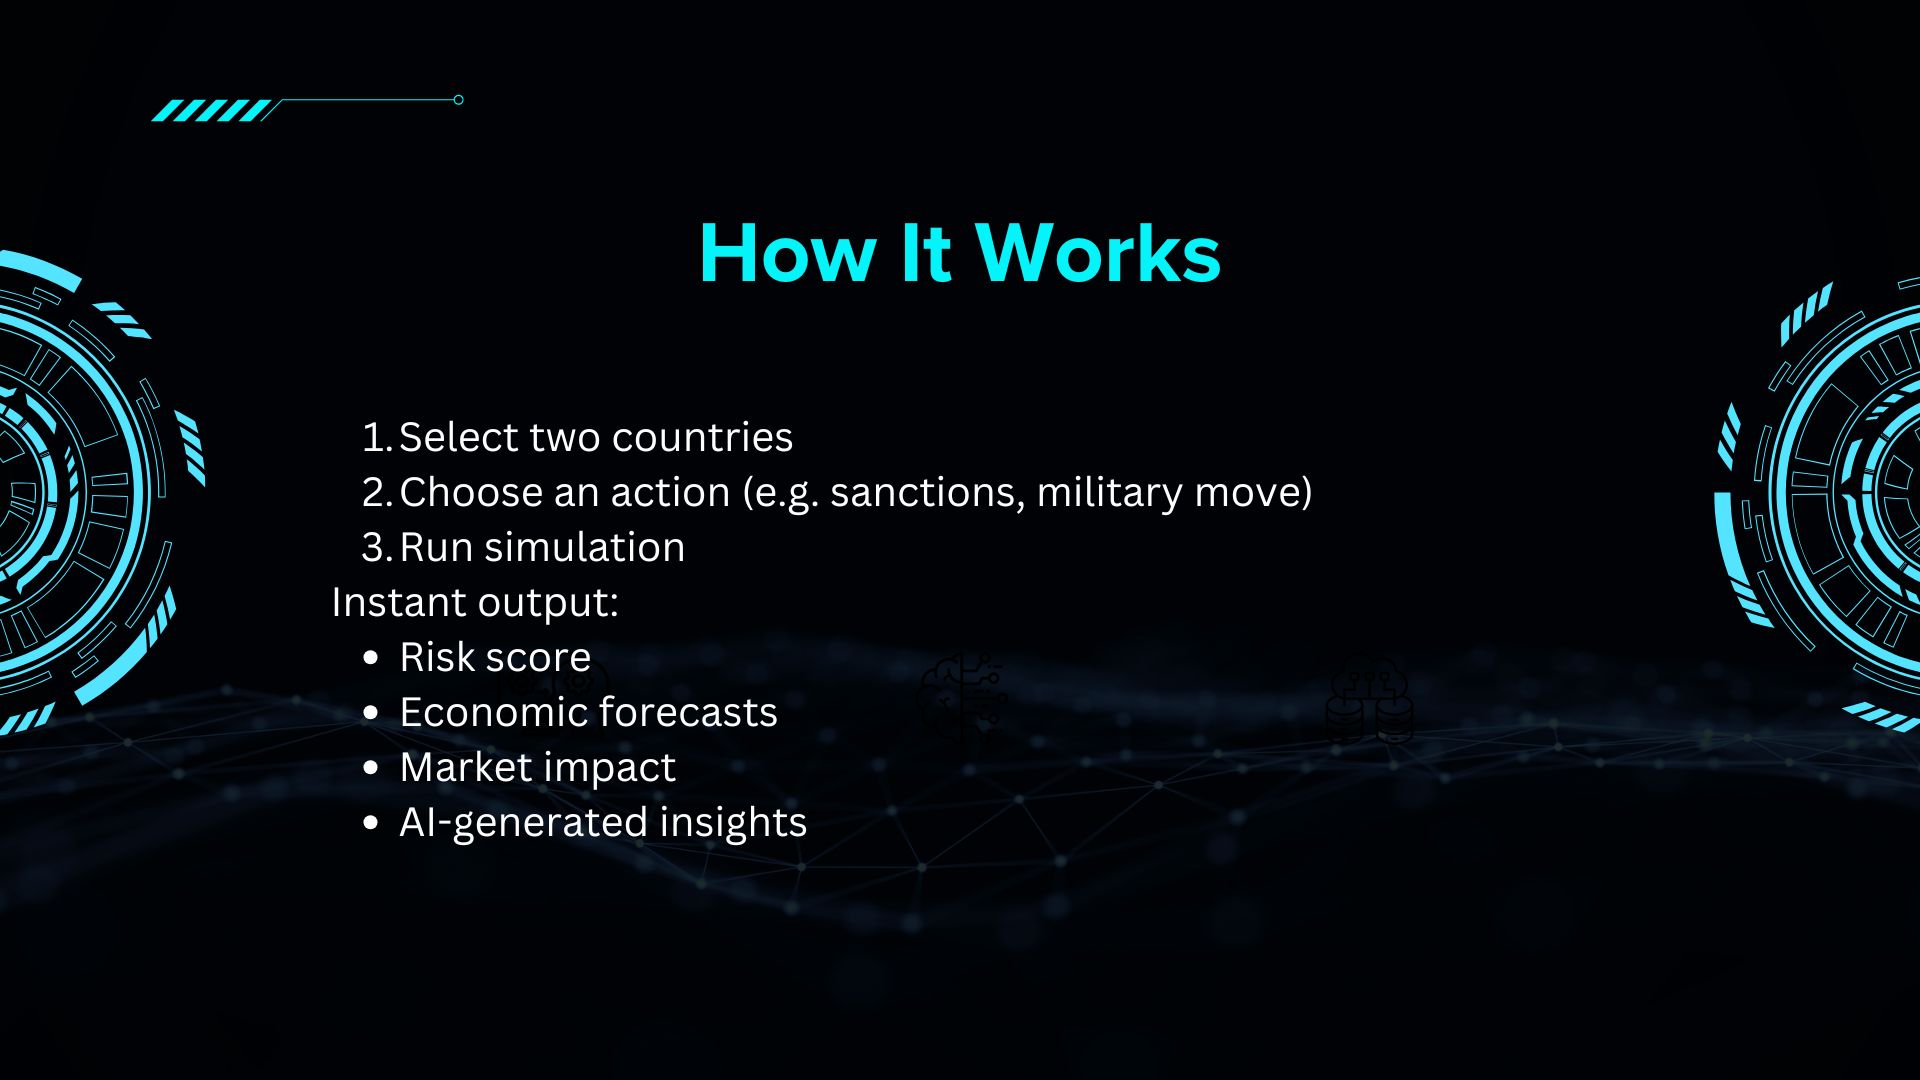
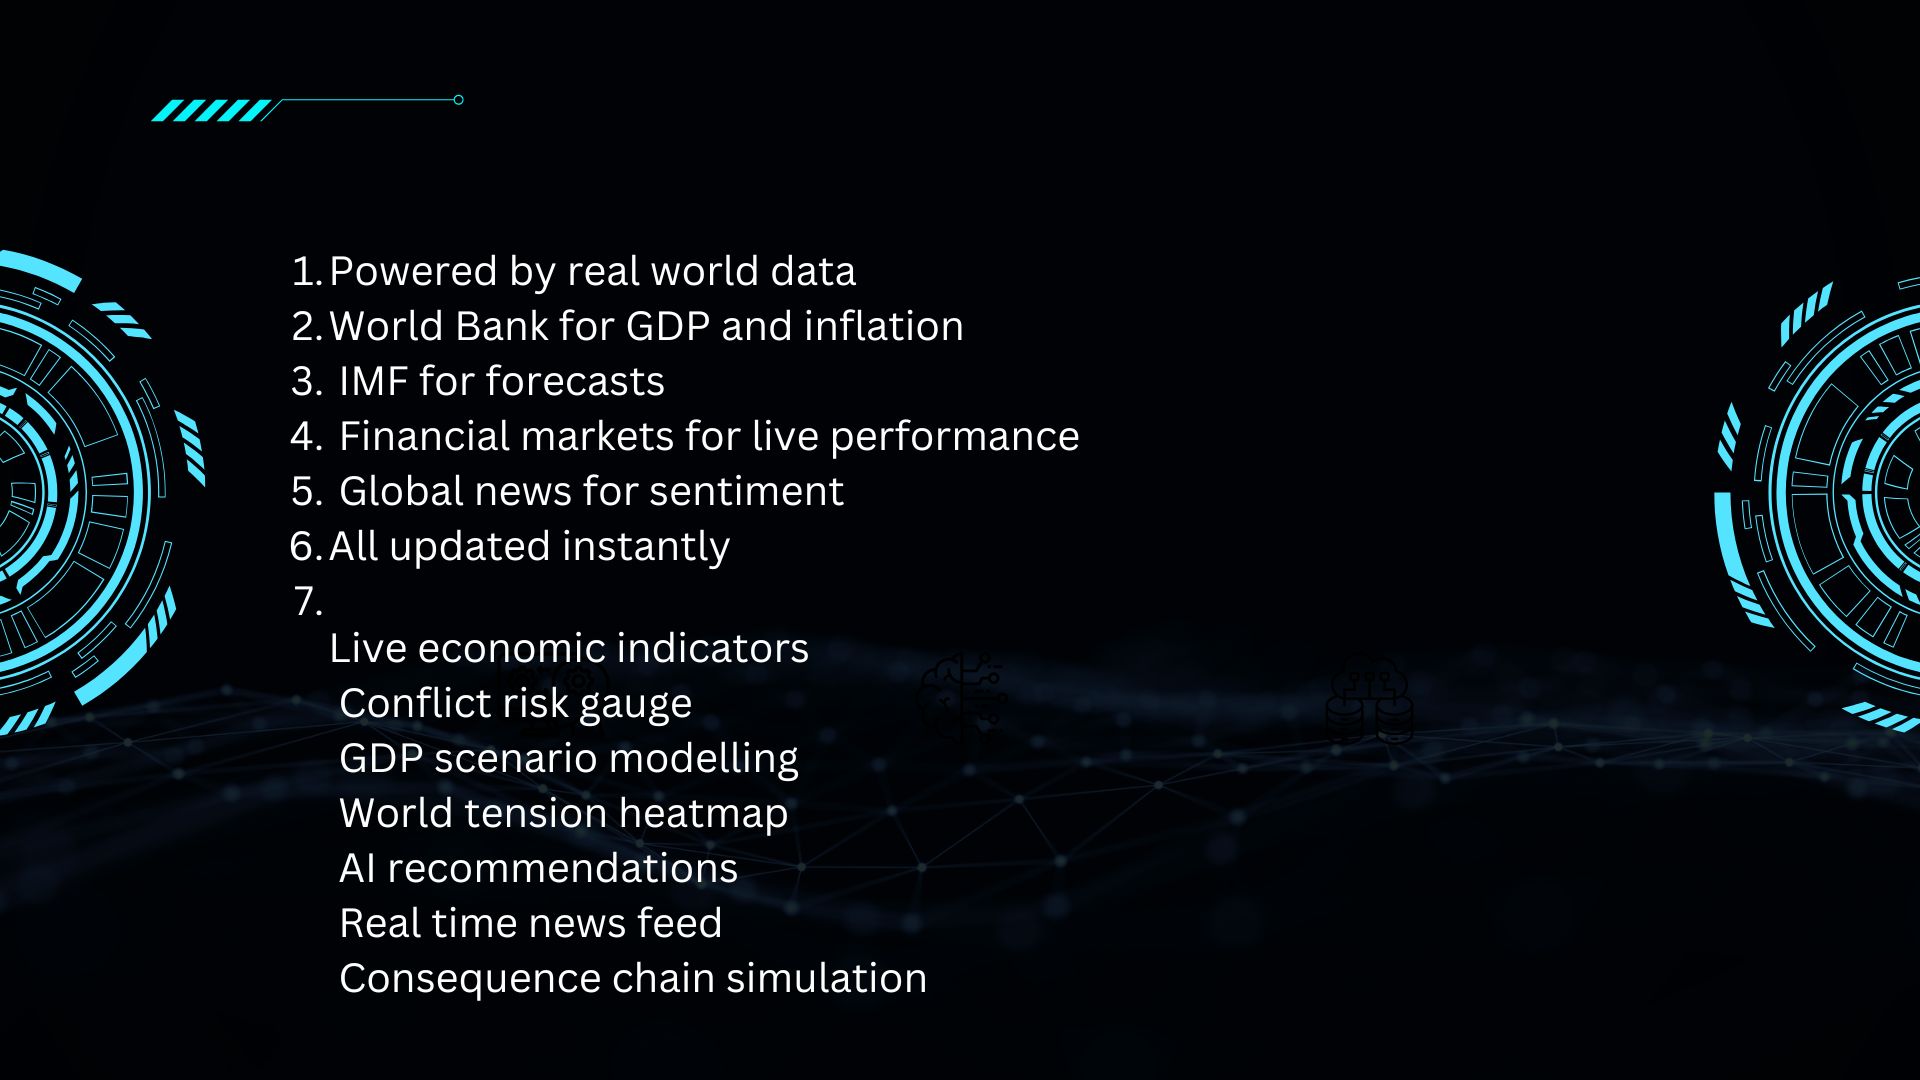
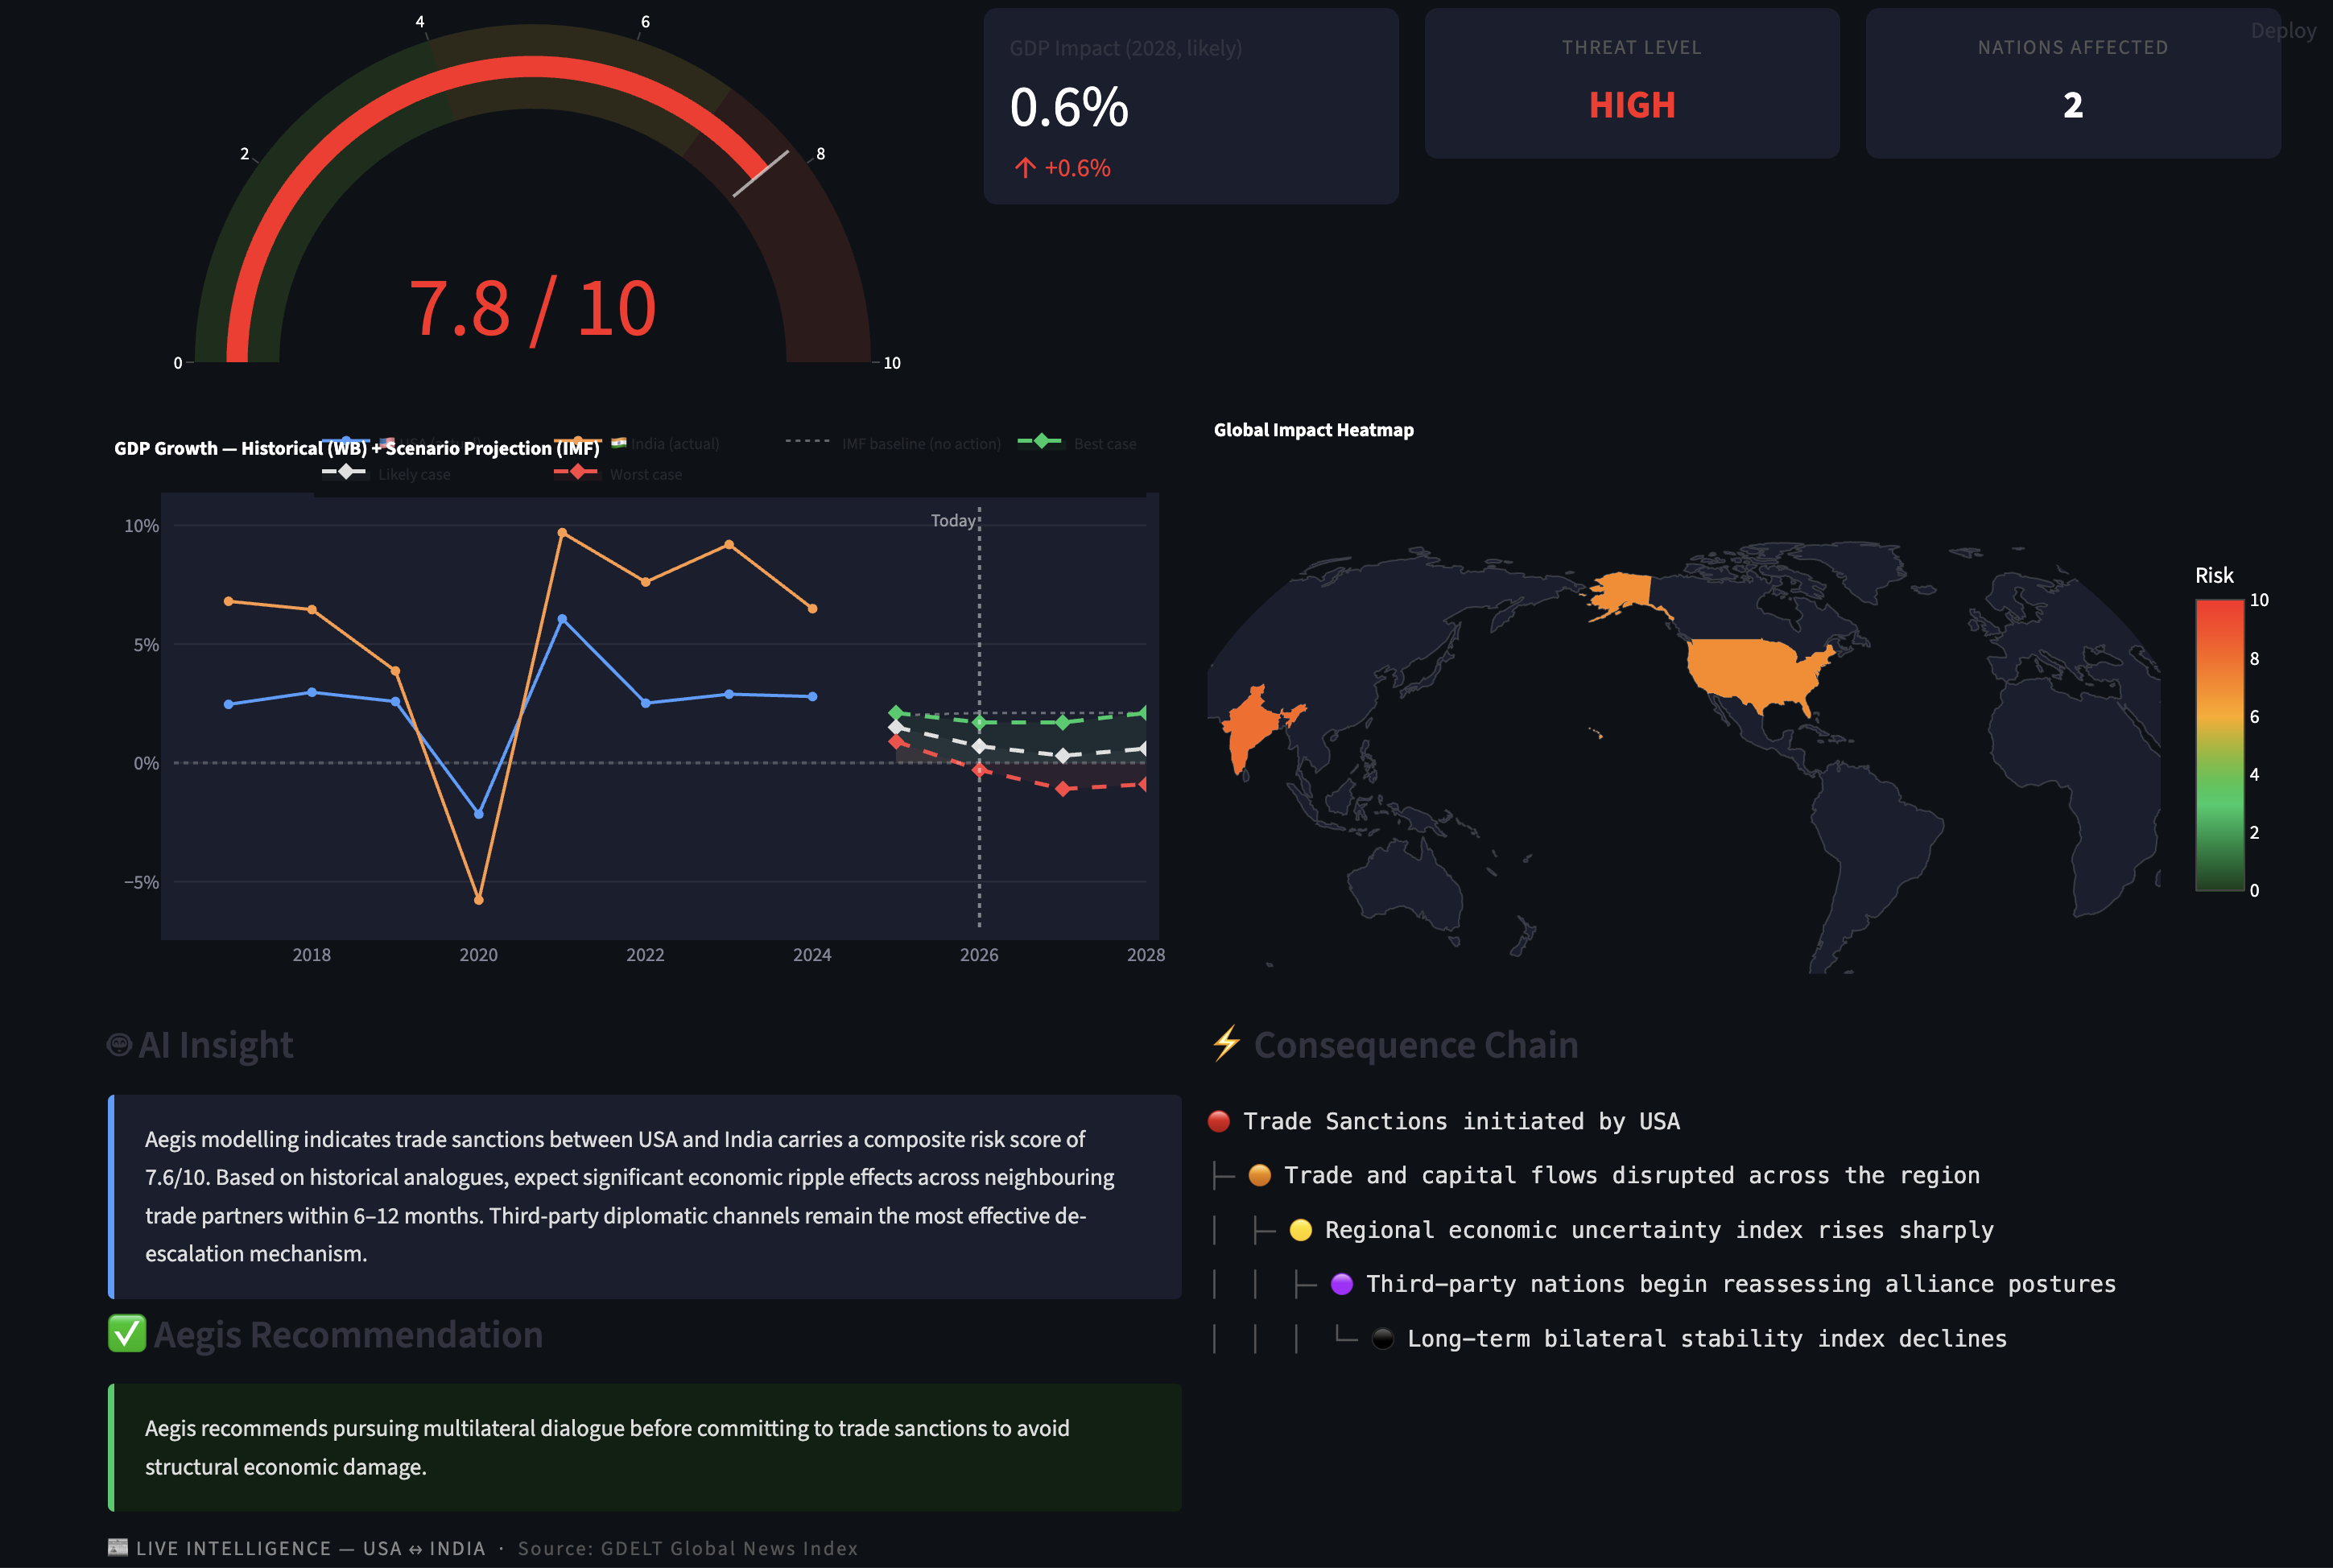
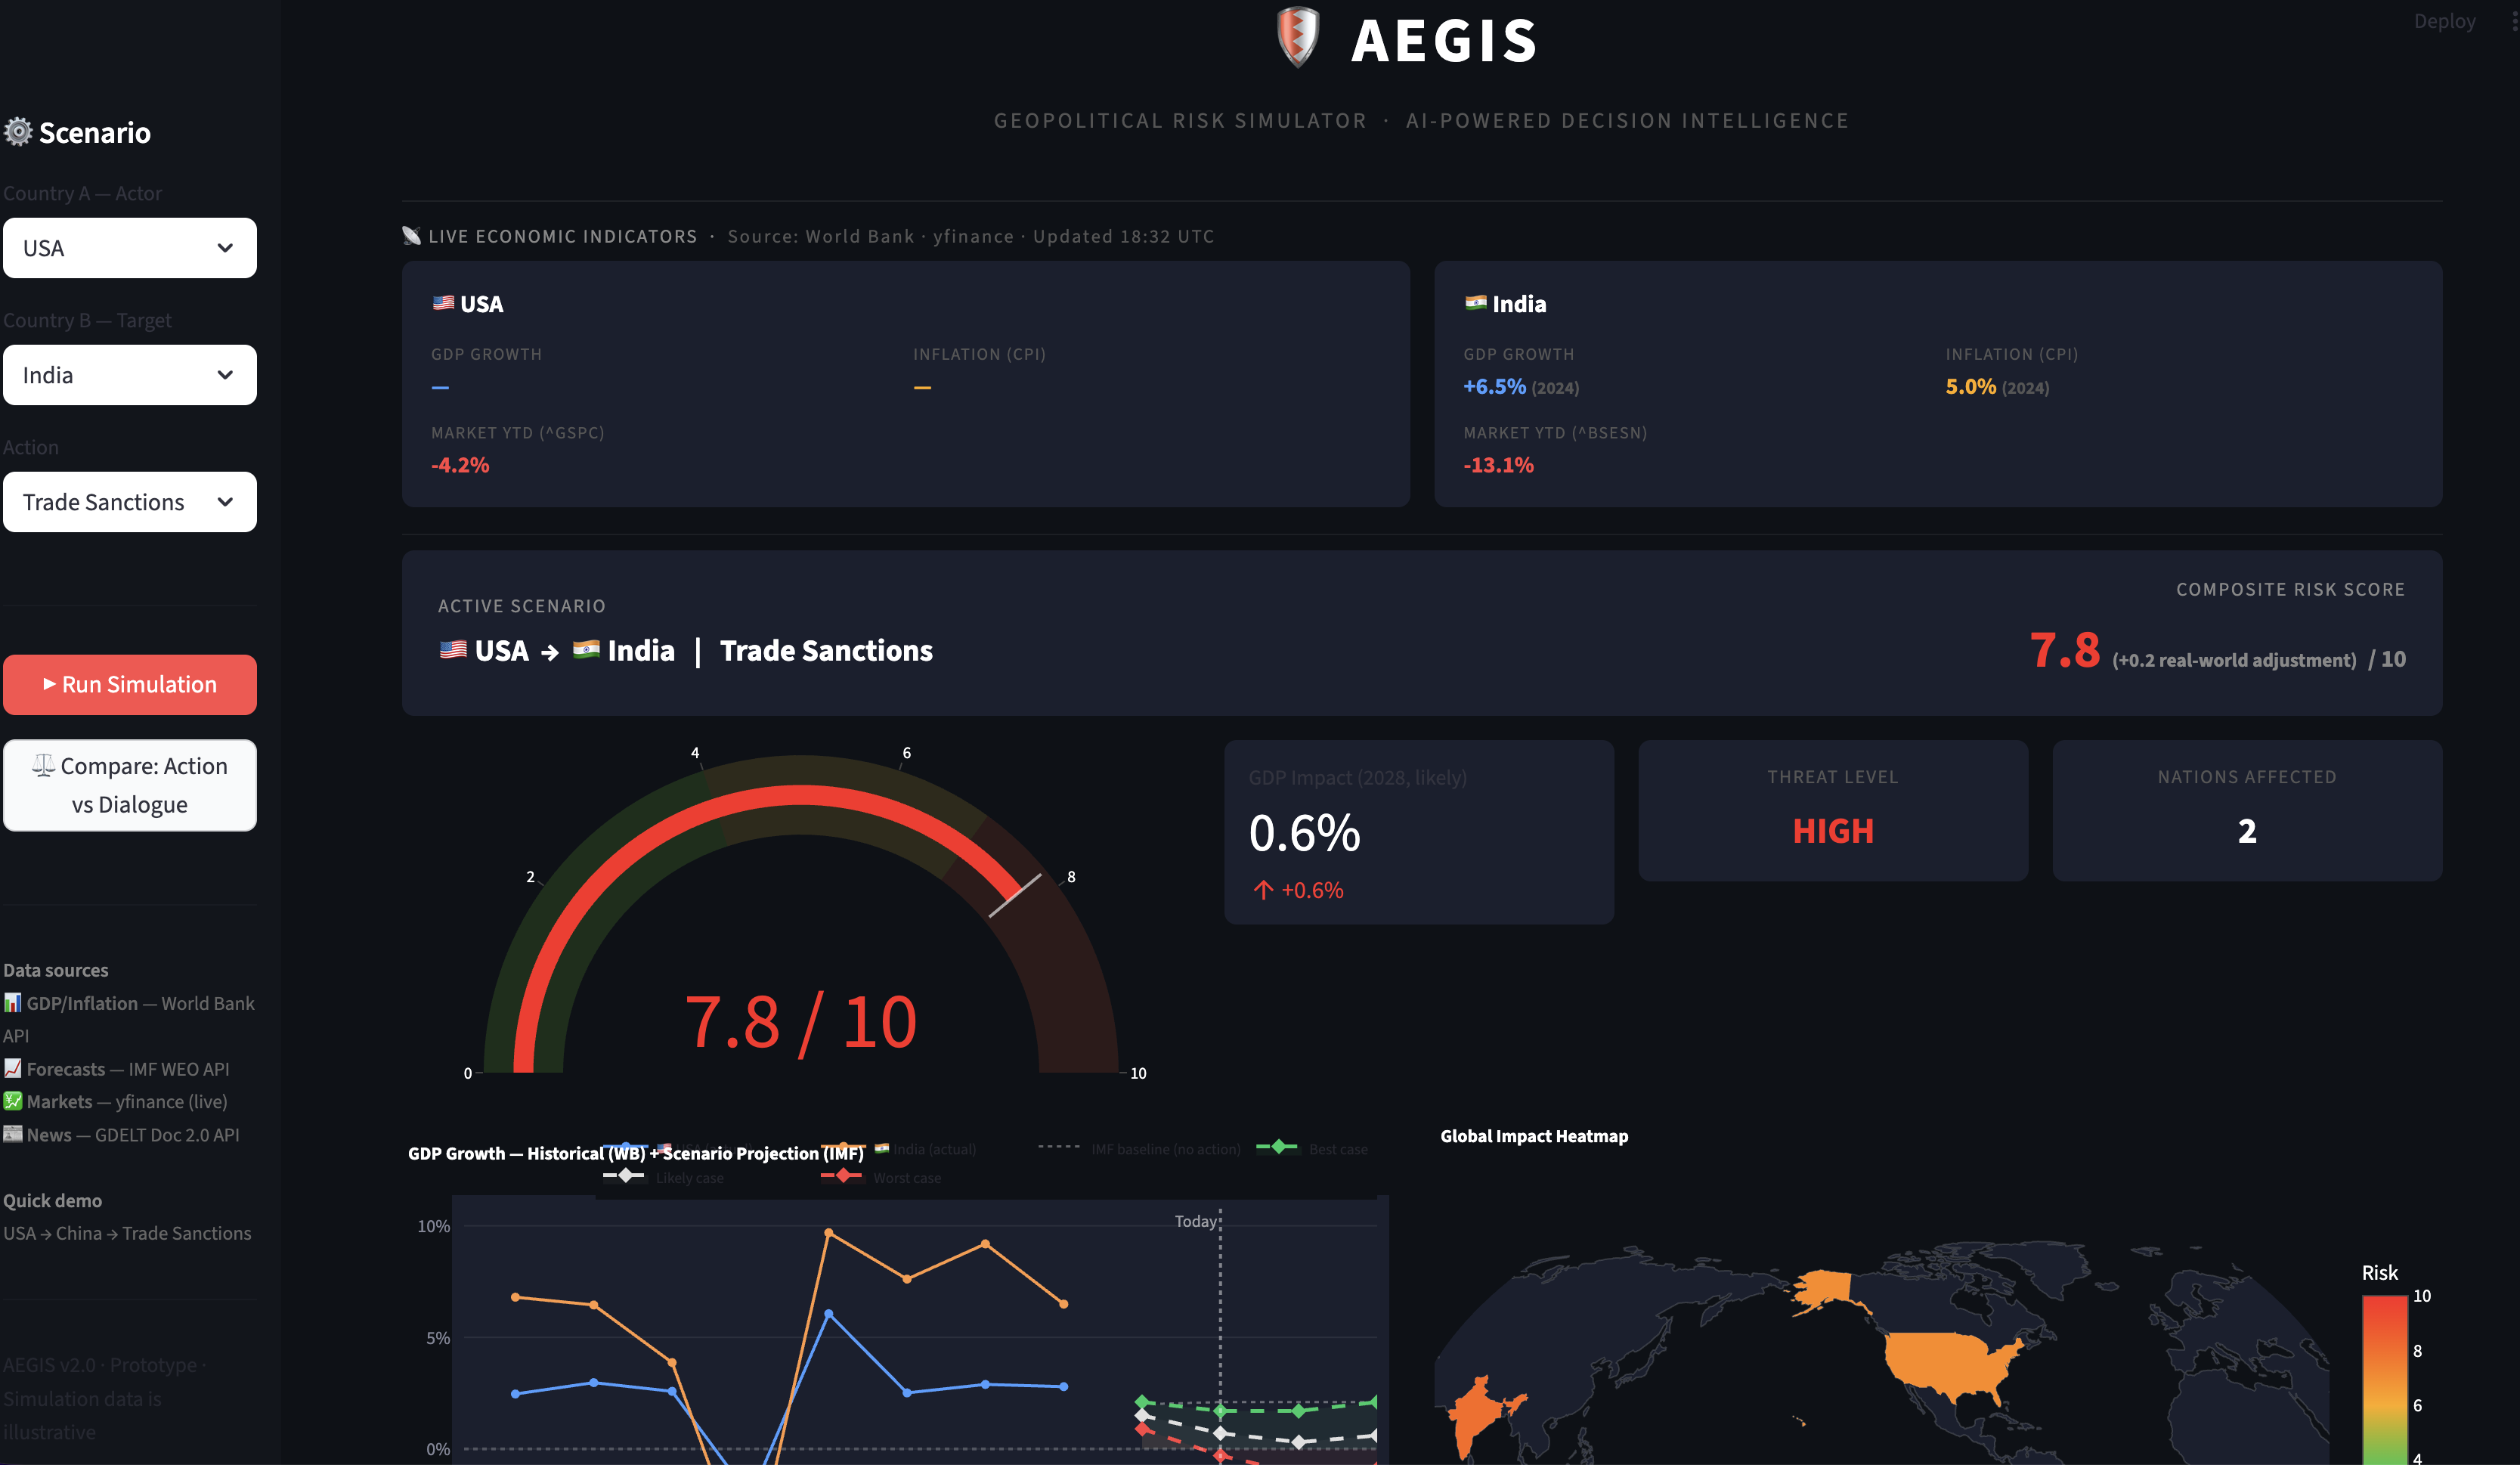
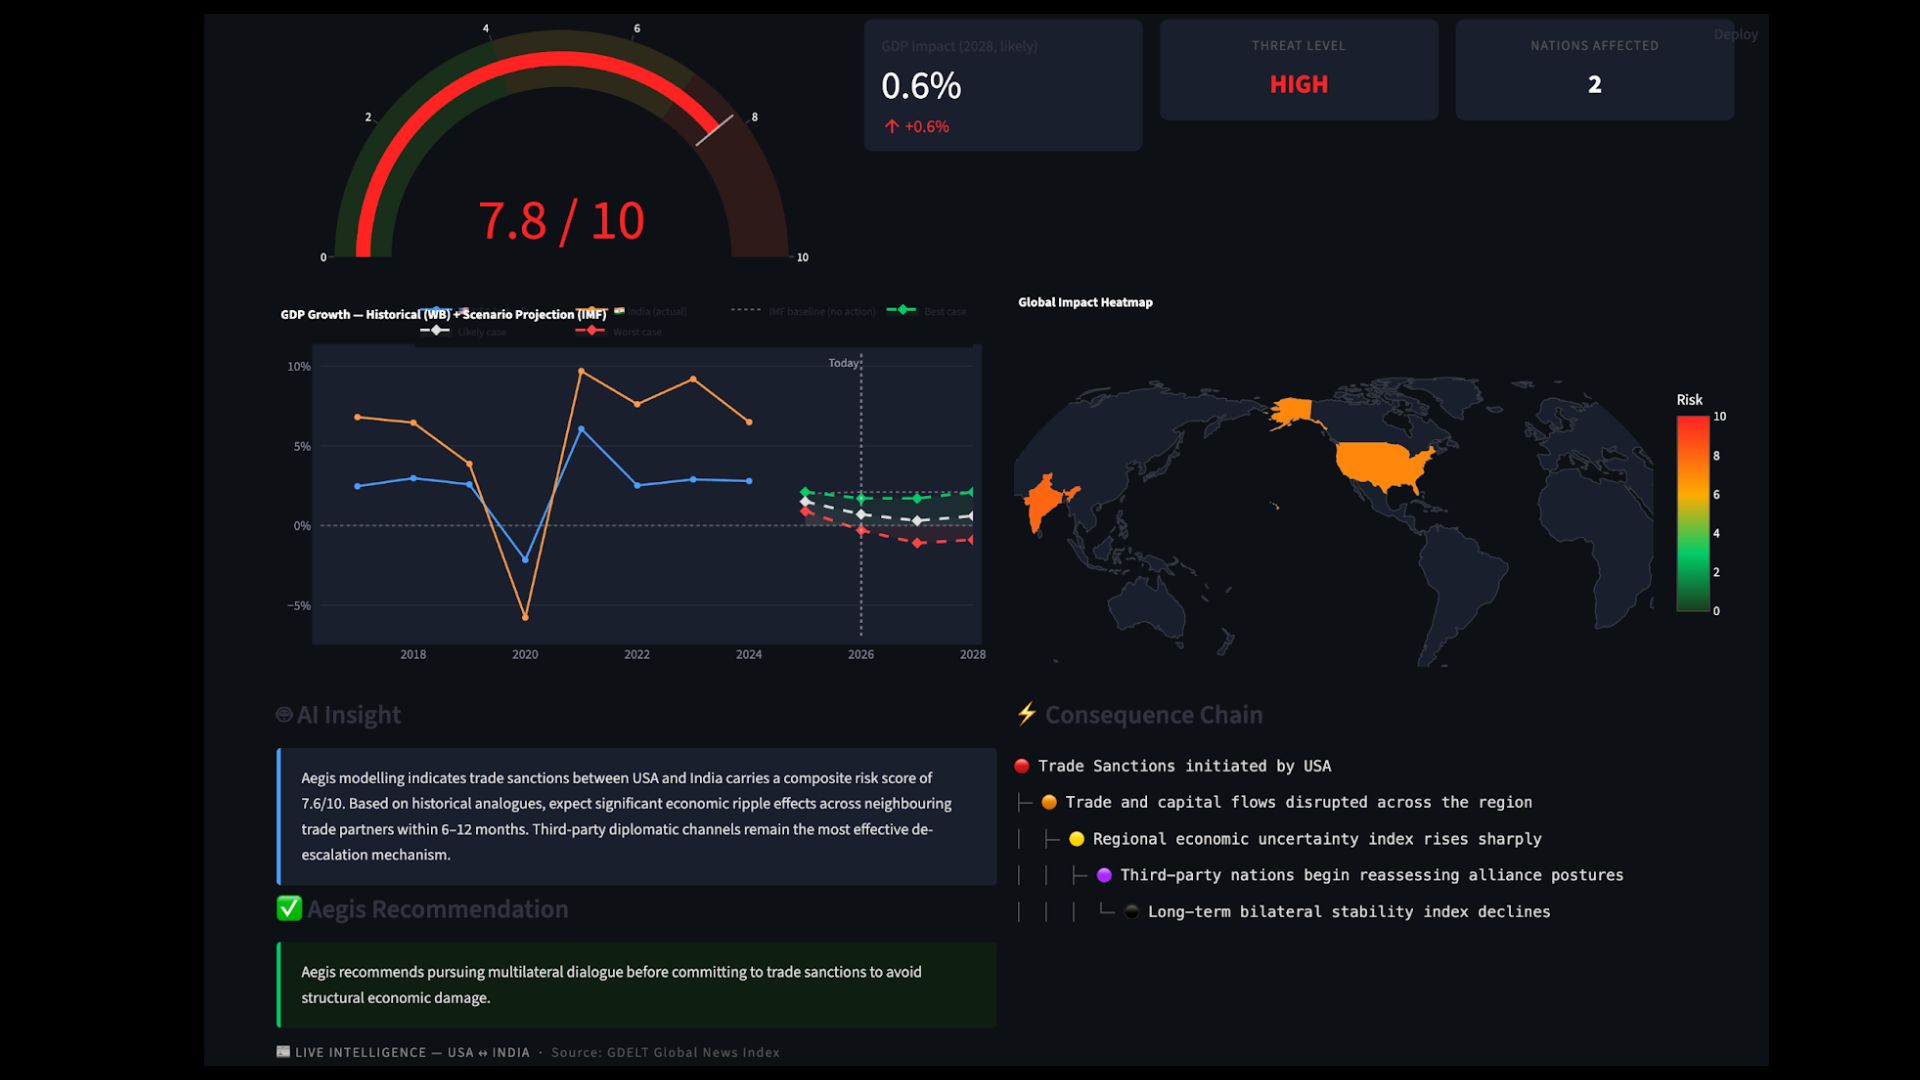
AEGIS simulates the GDP and stability impact of diplomatic or military actions between any two of 18 world powers. It pulls live data from the World Bank, IMF, stock markets, and GDELT news, then models best/likely/worst-case economic scenarios across a four-year projection window — alongside a risk score, consequence chain, and real-time news context.
How we built it
Python + Streamlit for the dashboard, Plotly for interactive charts, and four live APIs: World Bank (historical GDP/inflation), IMF WEO (baseline forecasts), yfinance (market stress signals), and GDELT Doc 2.0 (breaking news). GDP projections layer action-specific deviation models on top of real IMF forecasts.
Challenges we ran into
The biggest challenge was latency — eight API calls firing sequentially made simulations slow. We solved it with ThreadPoolExecutor to prefetch all data in parallel the moment a user changes their country selection, so the simulation itself is near-instant.
Accomplishments that we're proud of
Every data point on screen is live. The GDP chart stitches real World Bank historical data directly into IMF forward projections — the join is seamless and the scenarios are anchored to actual forecasts, not made-up numbers.
What we learned
Real-world APIs are messy. The World Bank returns a 2-element list, not a dict. IMF year keys are strings. GDELT throttles aggressively. Building resilient fallback chains for every data source taught us a lot about defensive API design.
What's next for Aegis
Multi-party conflict modelling (3+ countries), a historical backtesting mode to validate scenarios against past events, and an LLM layer to generate natural-language policy briefs from the simulation output.


Log in or sign up for Devpost to join the conversation.