-
-
-
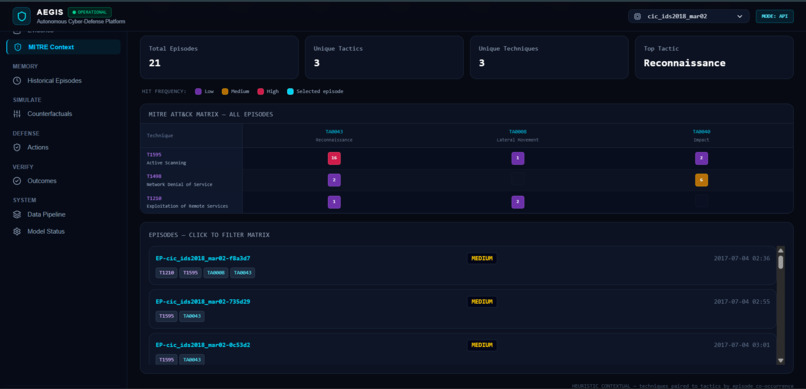
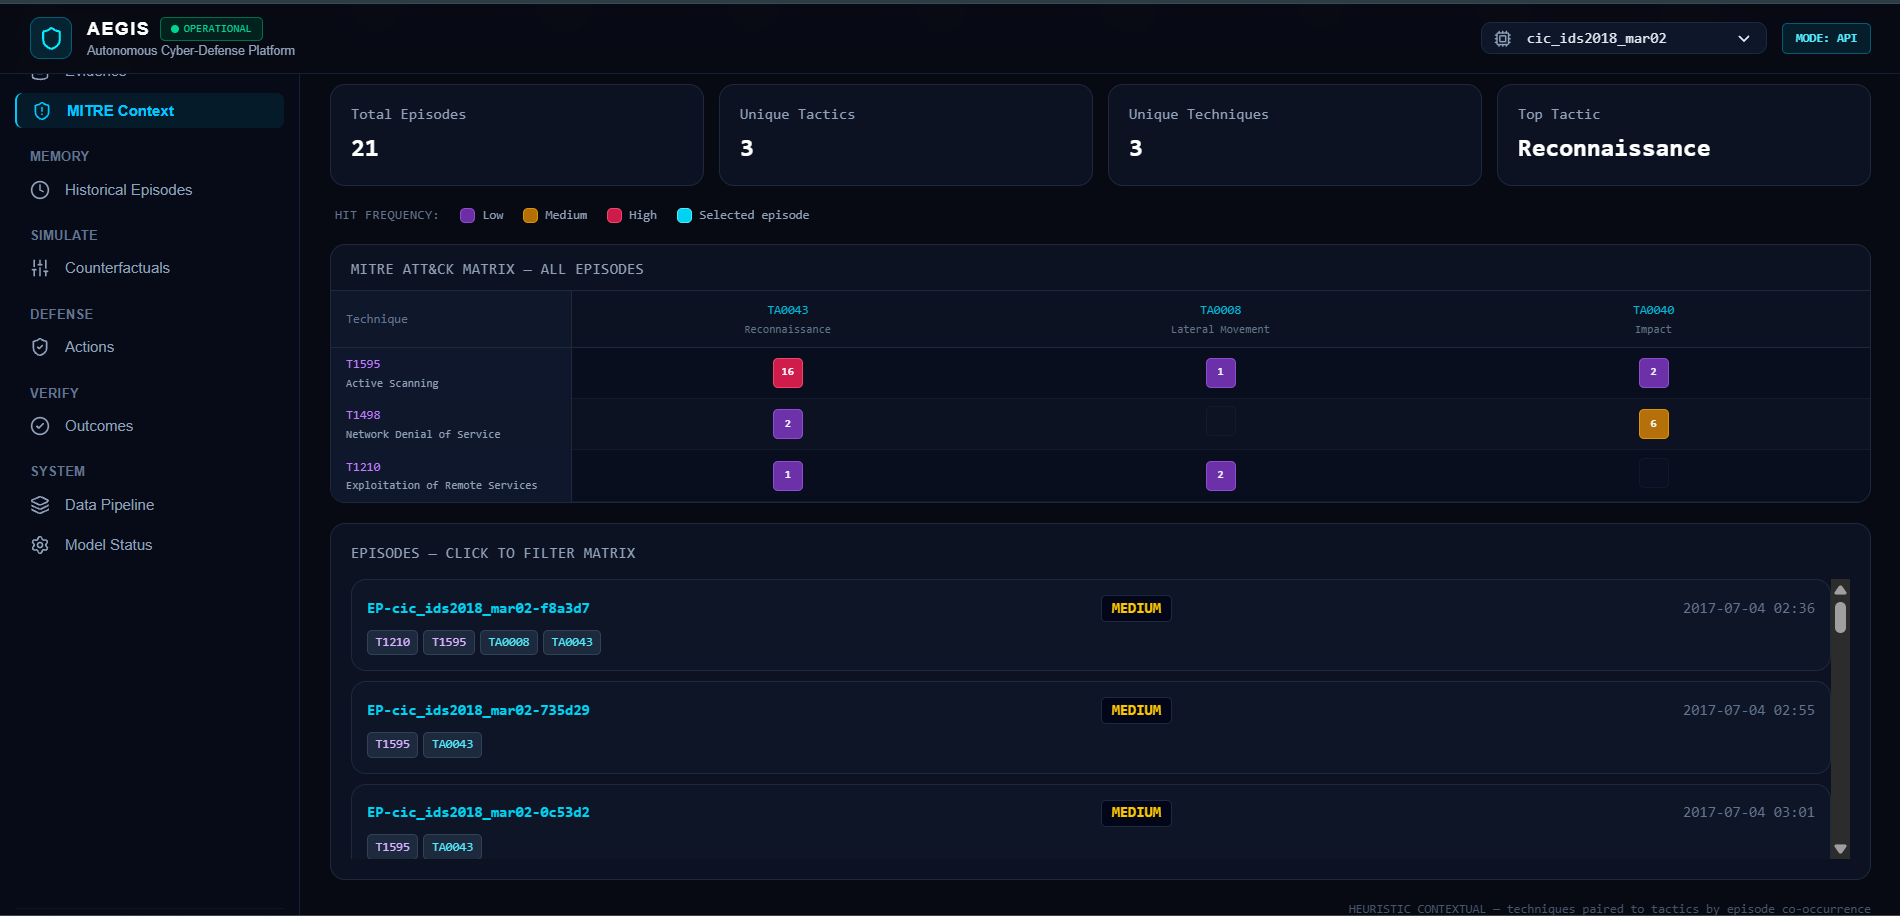
Attack technique mapping — episodes automatically classified against the MITRE ATT&CK framework
-
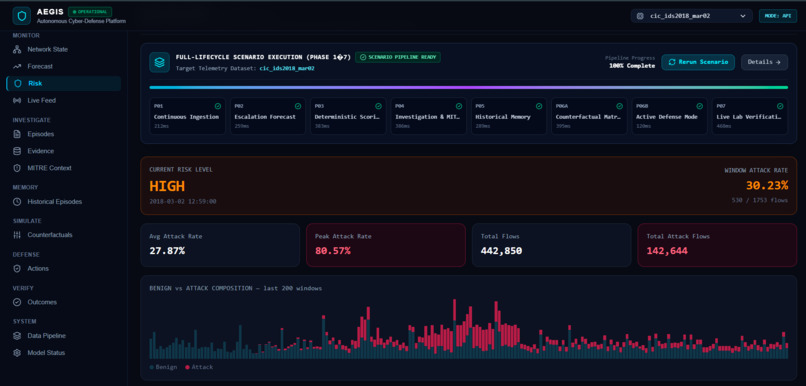
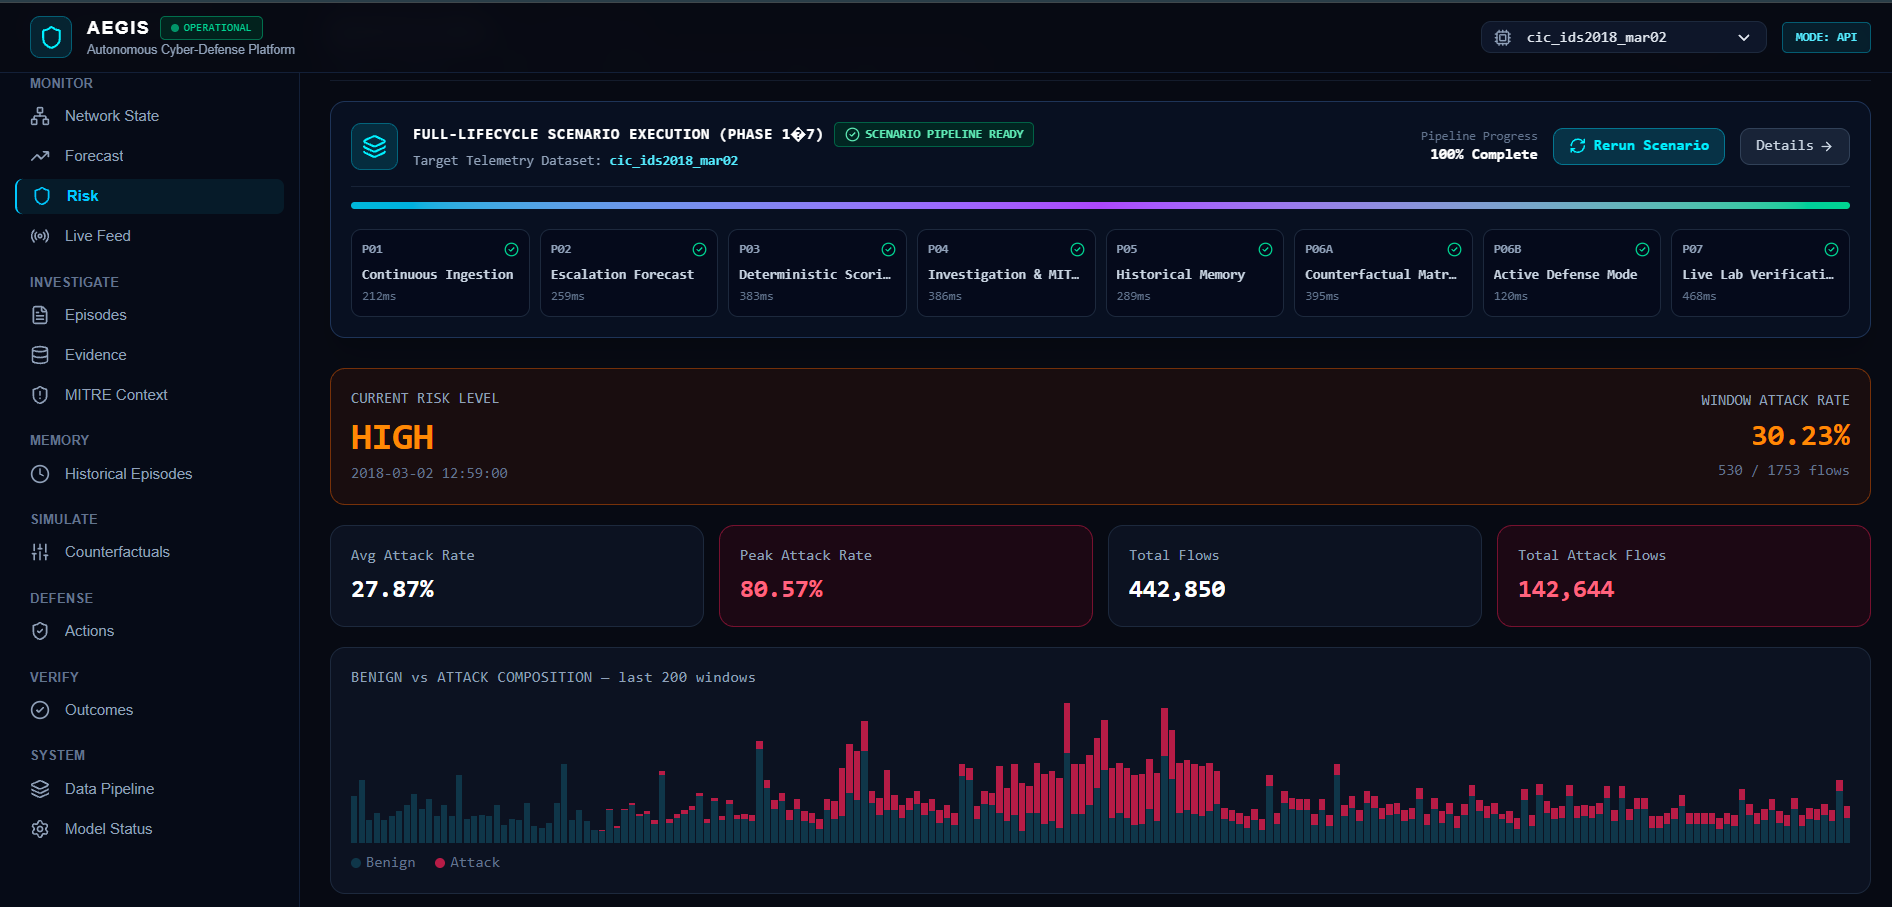
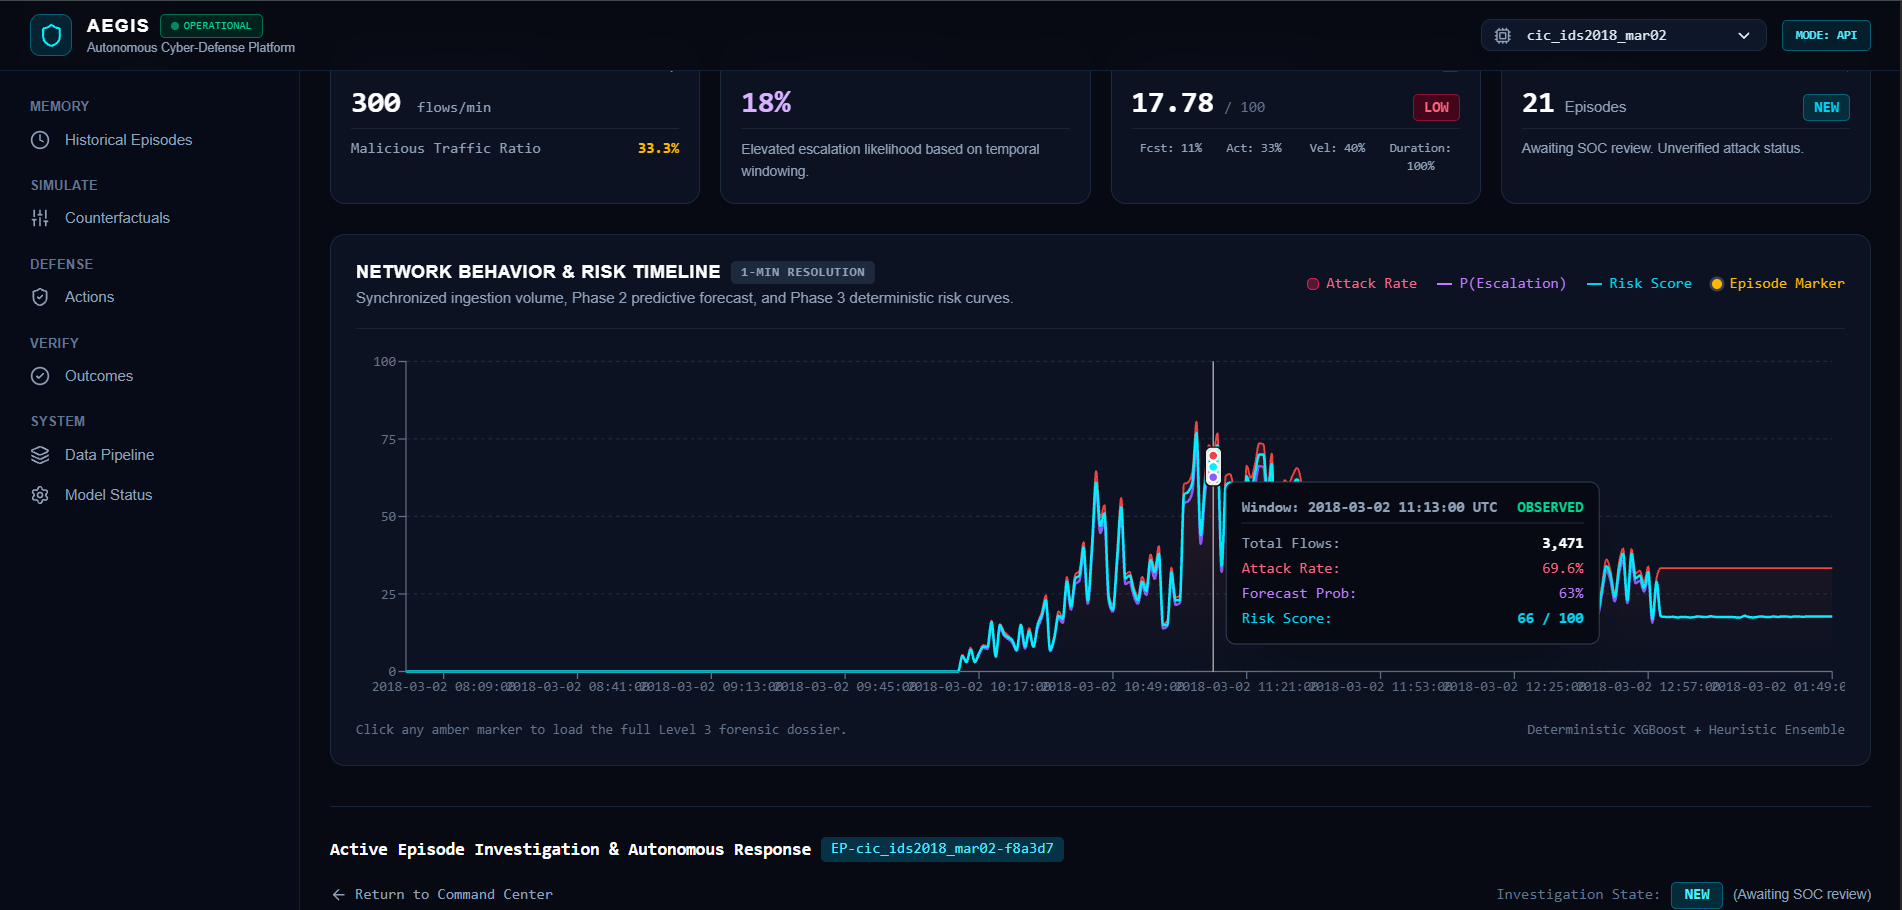
Current threat level — four signals combined into one 0–100 risk score, updated every minute.
-
-
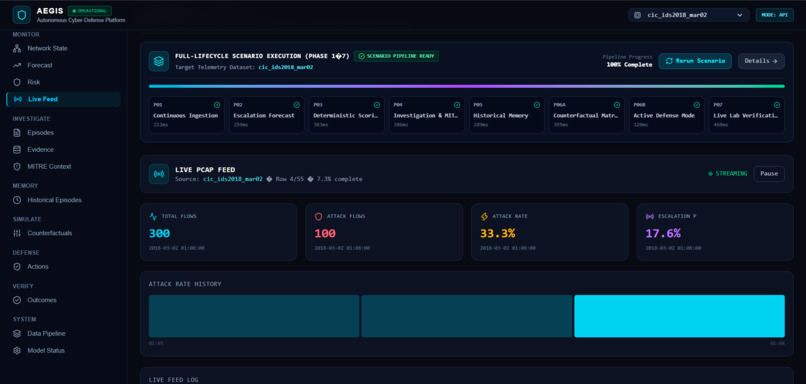
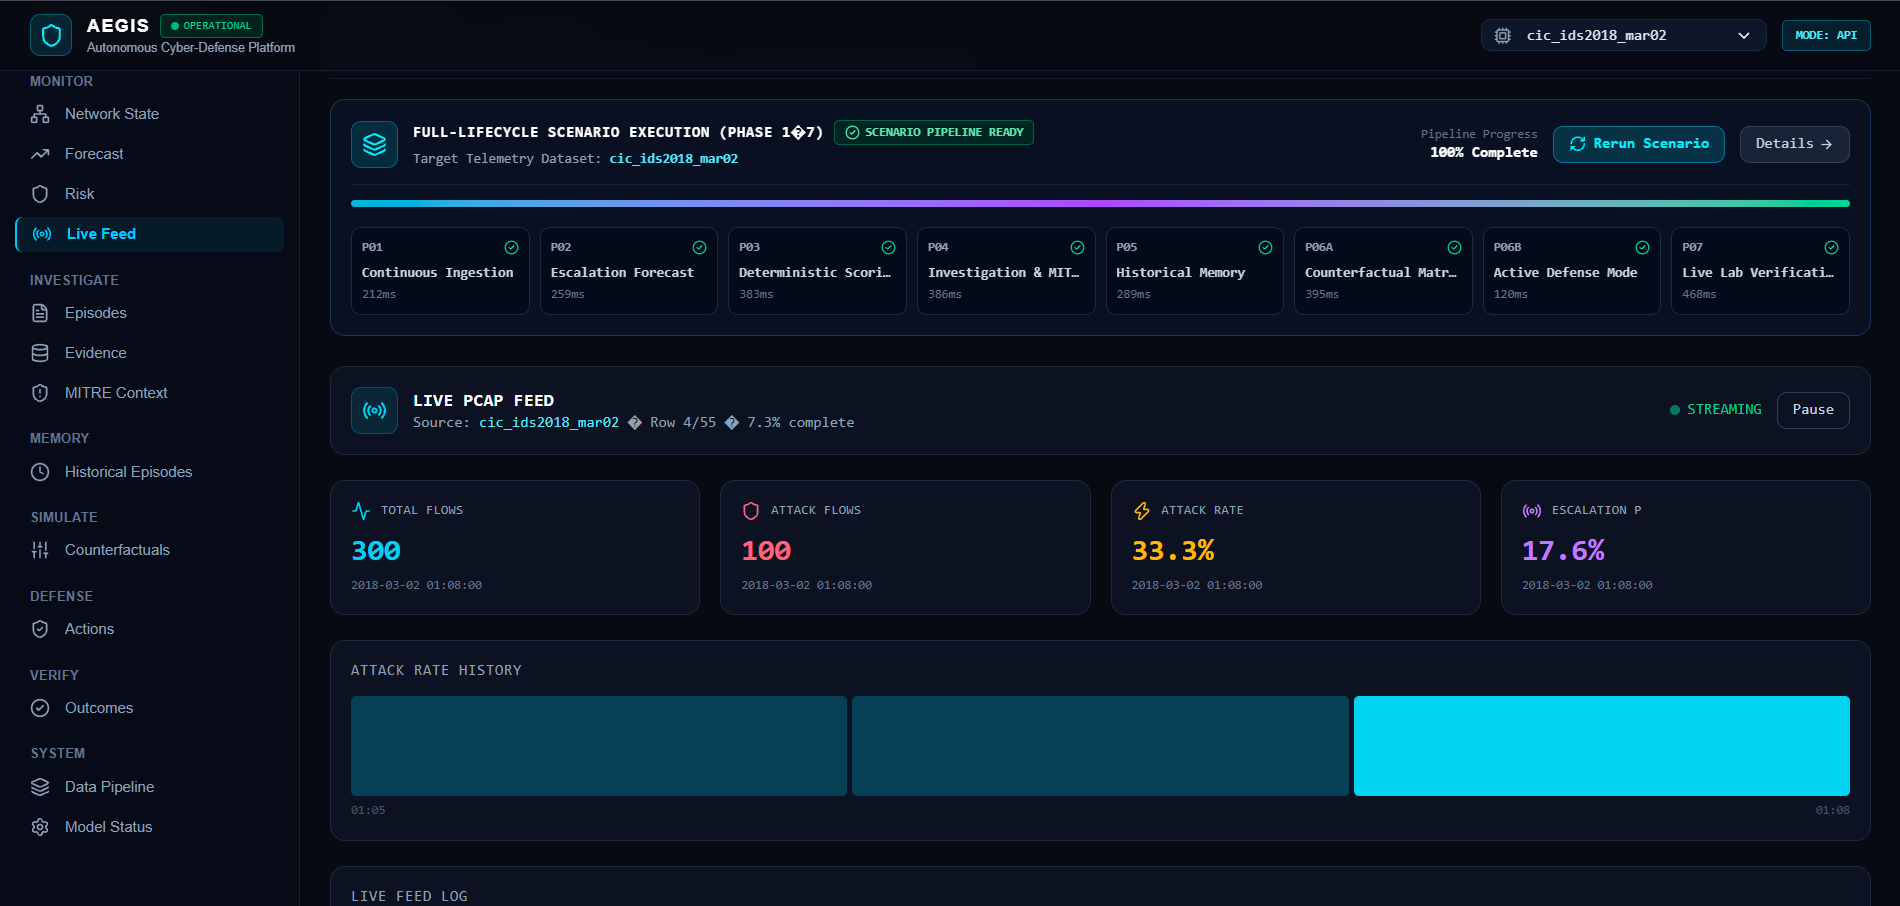
Raw network tick stream — every 5 seconds, live ML inference on each incoming window
-
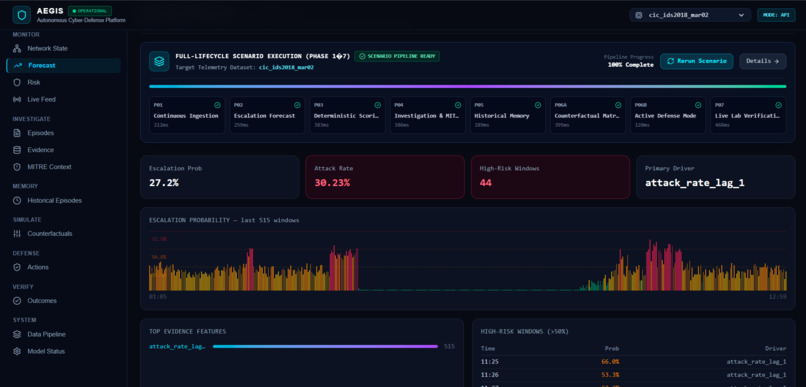
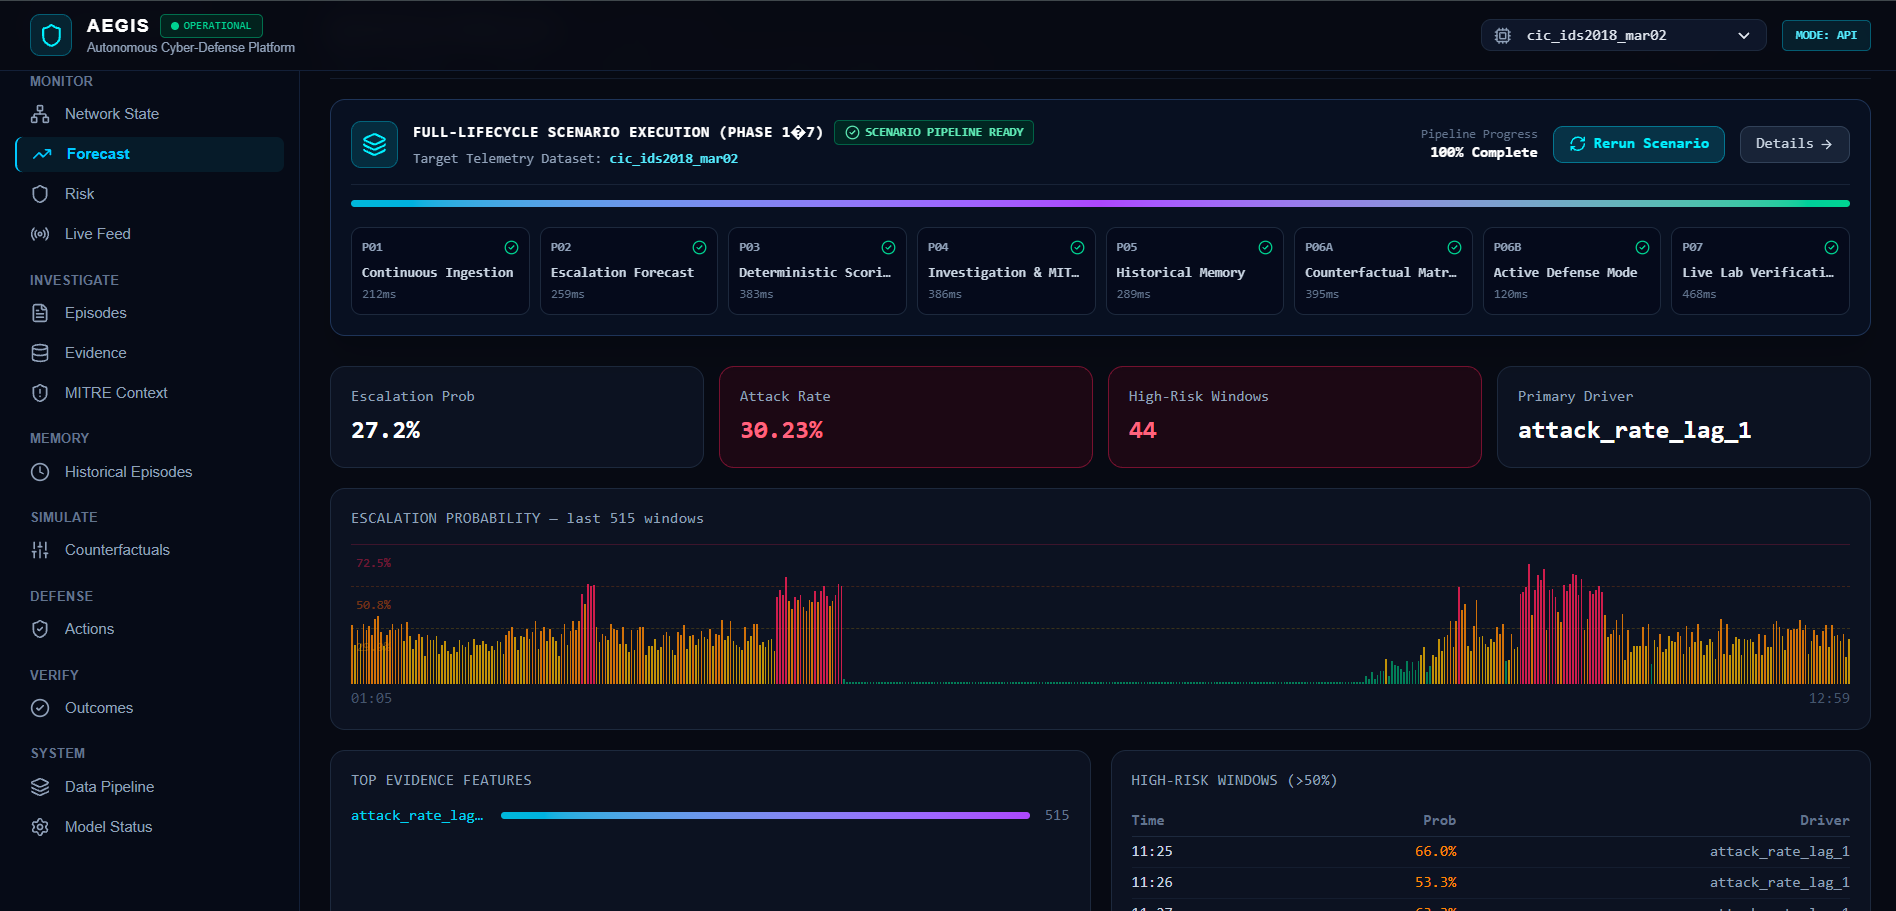
Attack worsening probability — updated every minute using live ML inference.
-
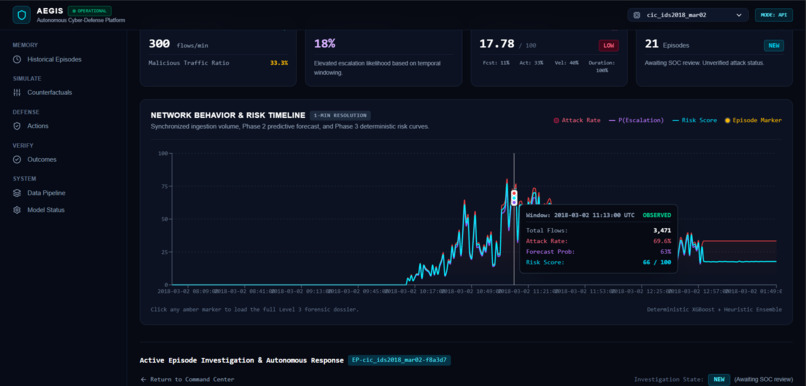
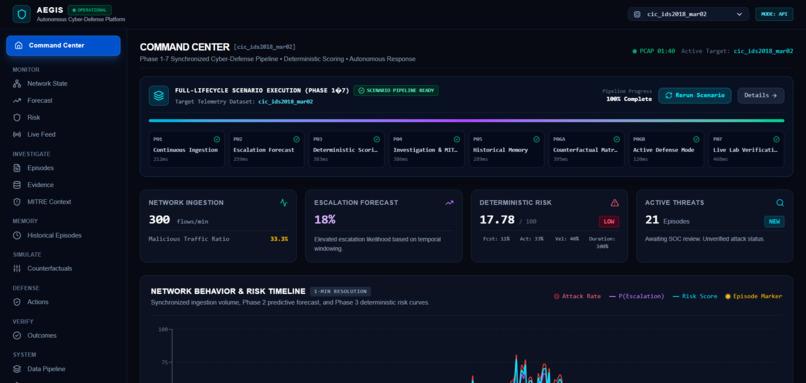
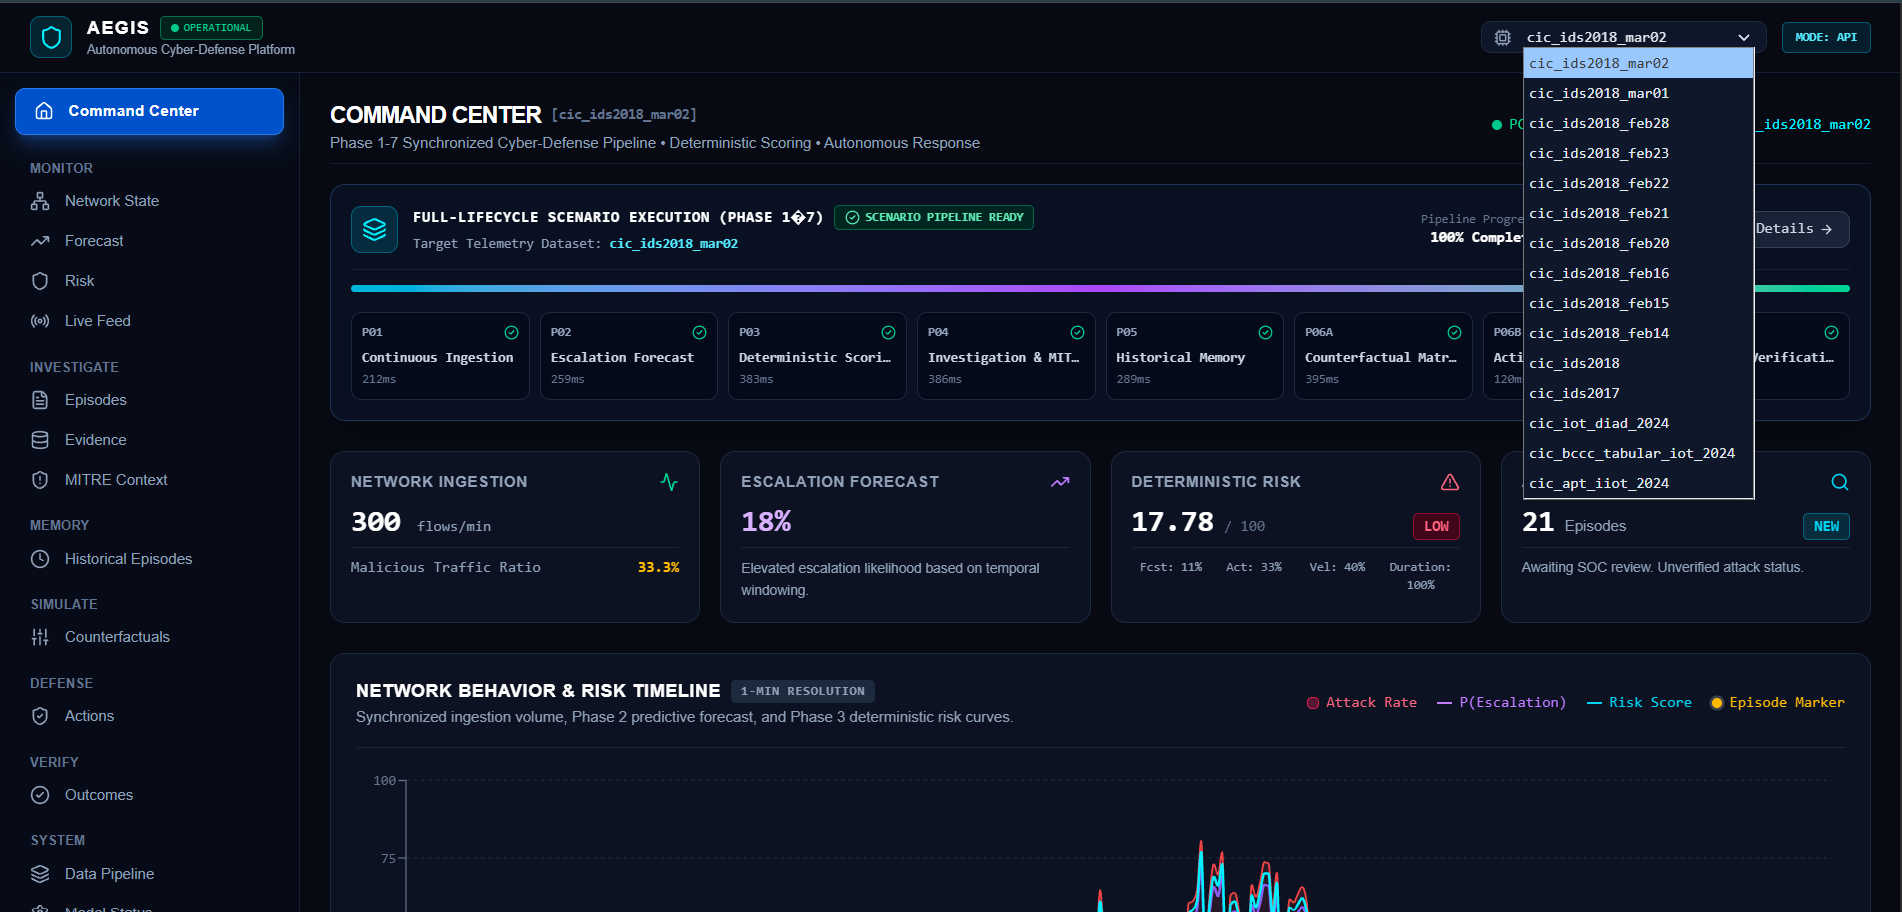
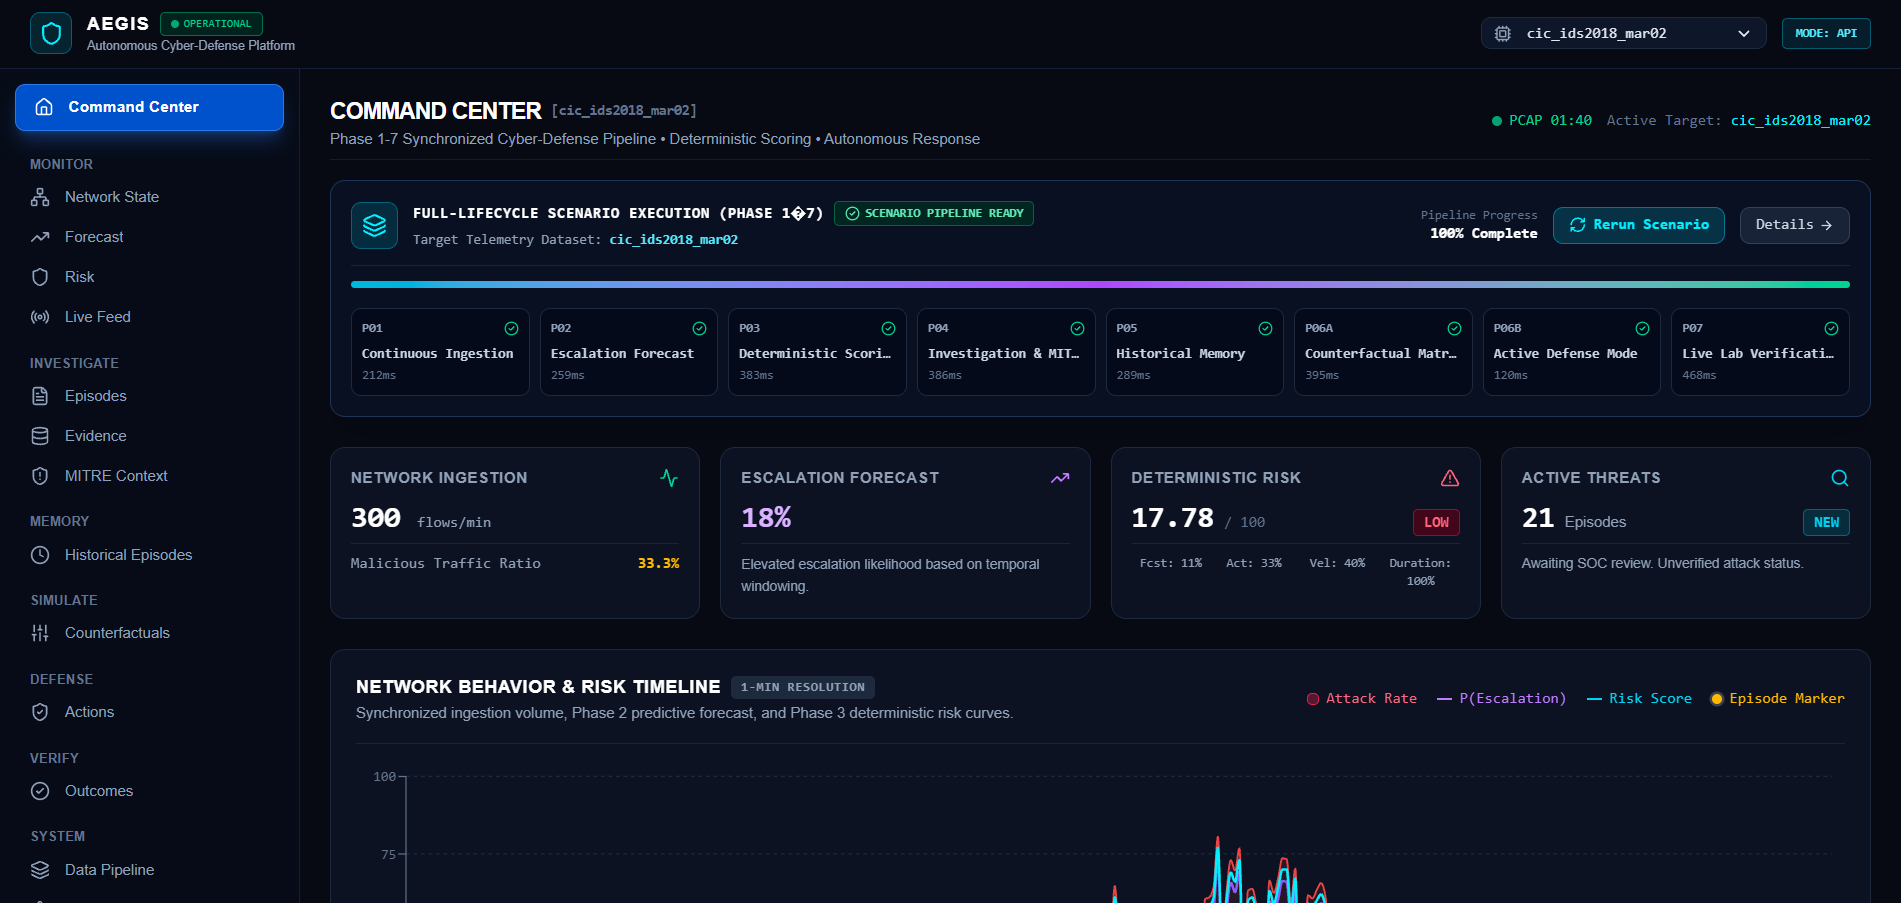
AEGIS : the main chart on Command Center with attack rate, escalation probability, and risk score lines
-
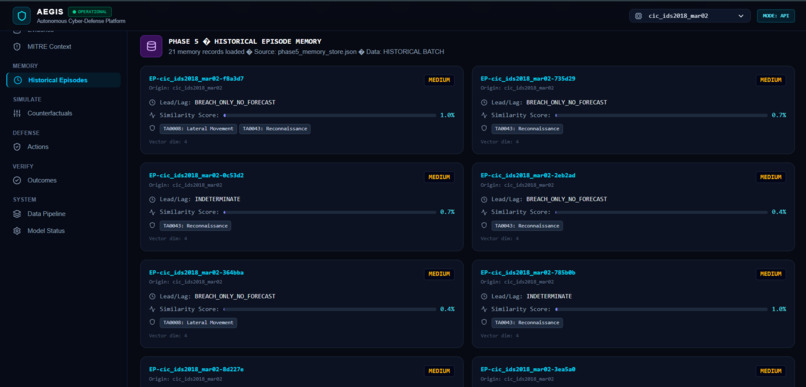
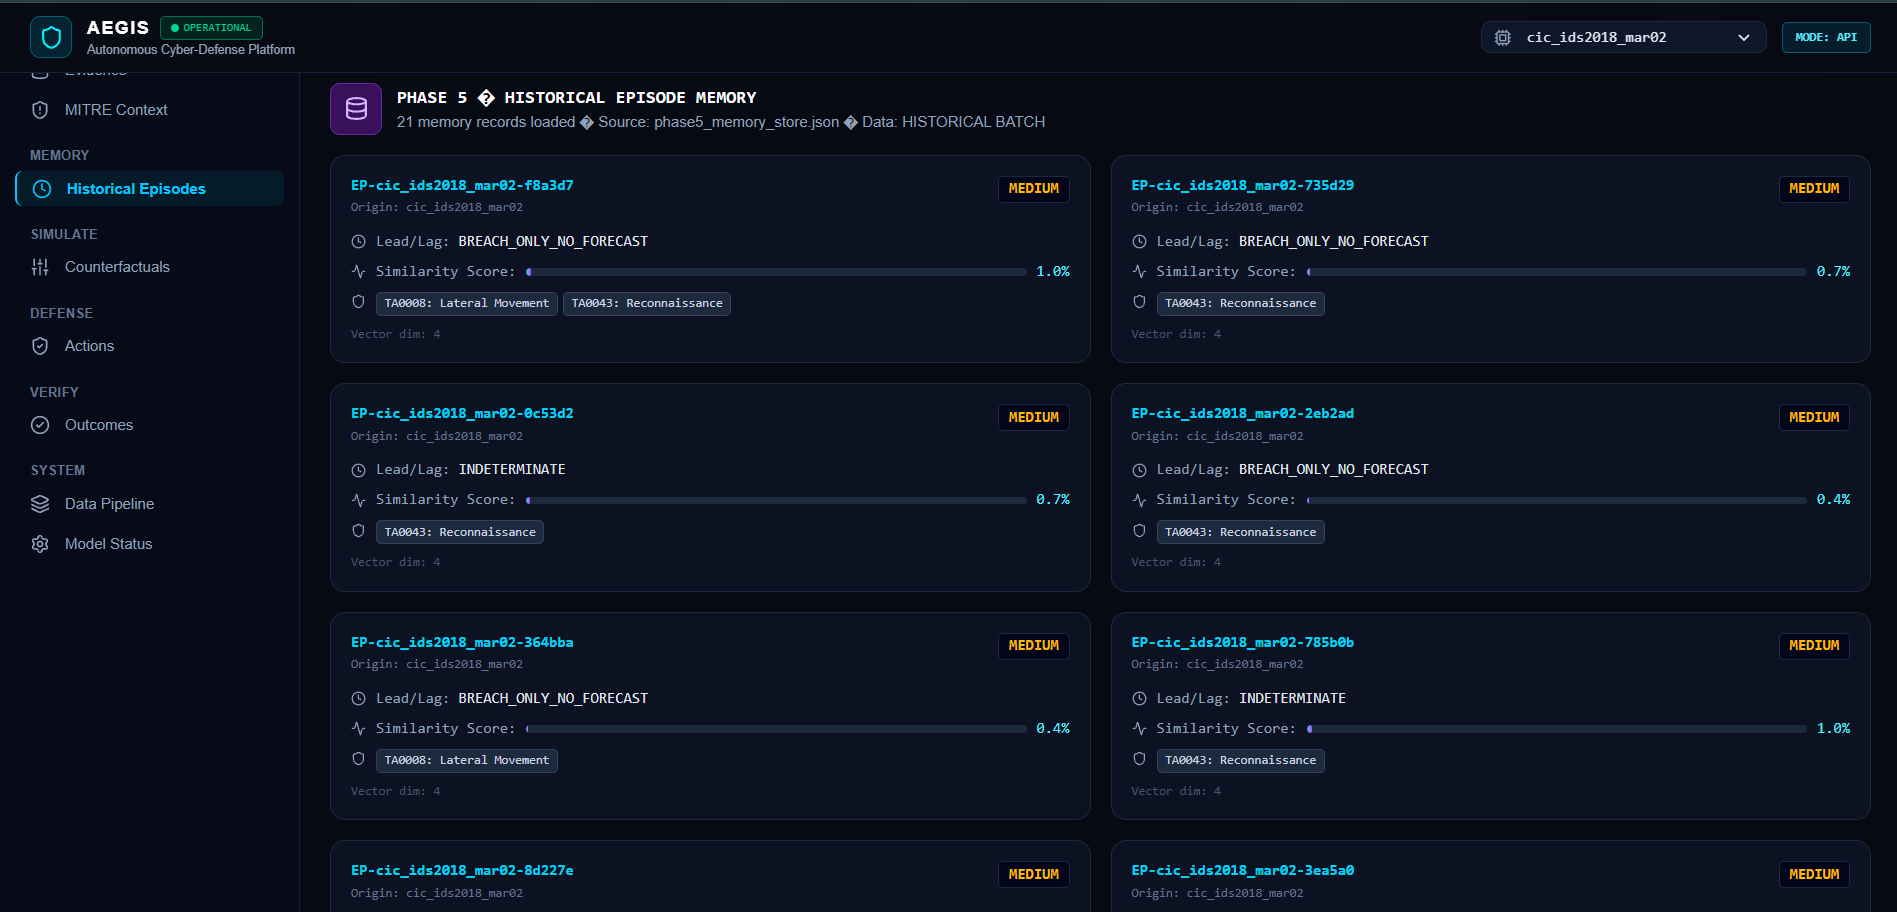
Attack memory index — 258+ past episodes searchable by vector similarity to current threats
-
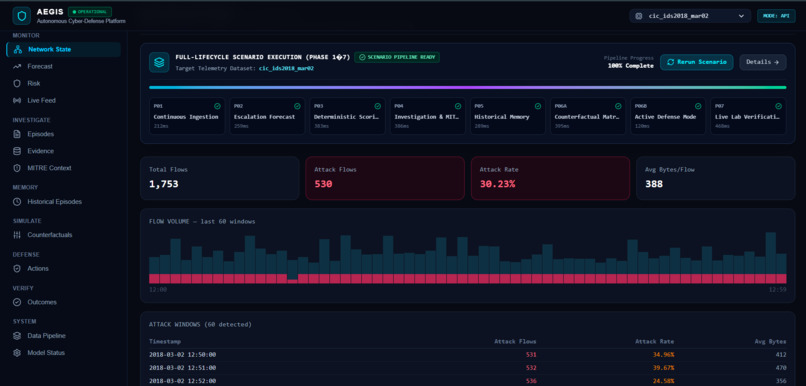
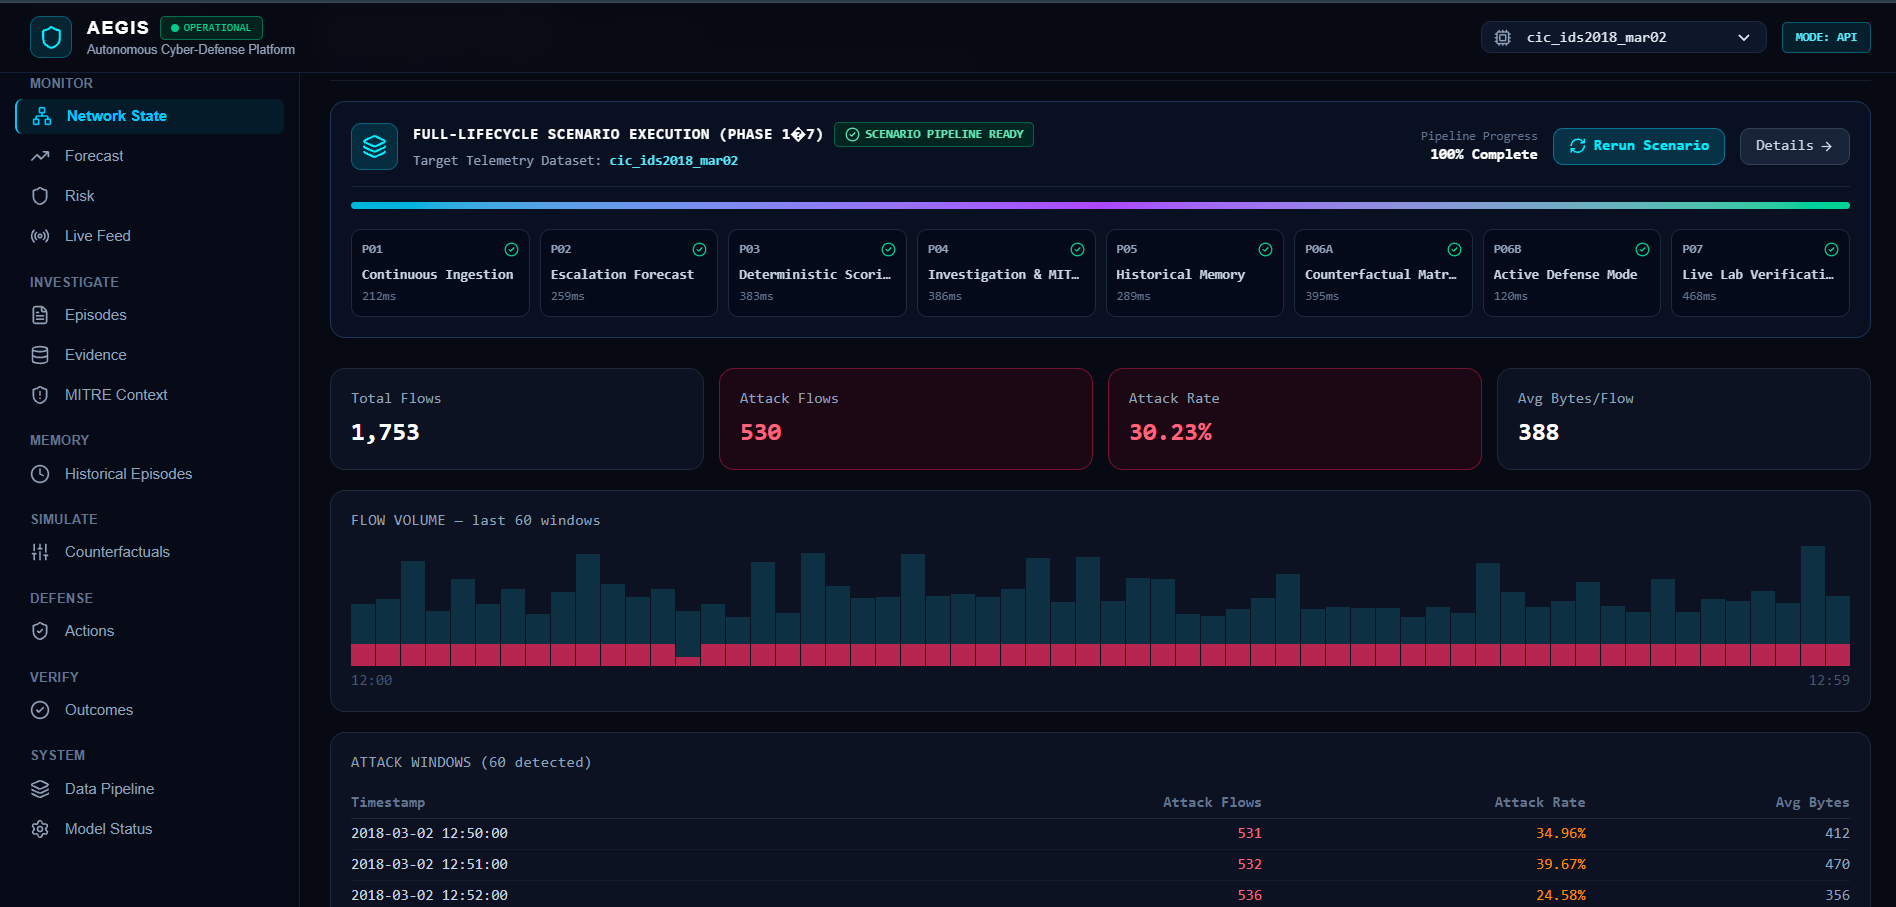
Live network traffic — every connection, every minute, benign vs malicious.
-
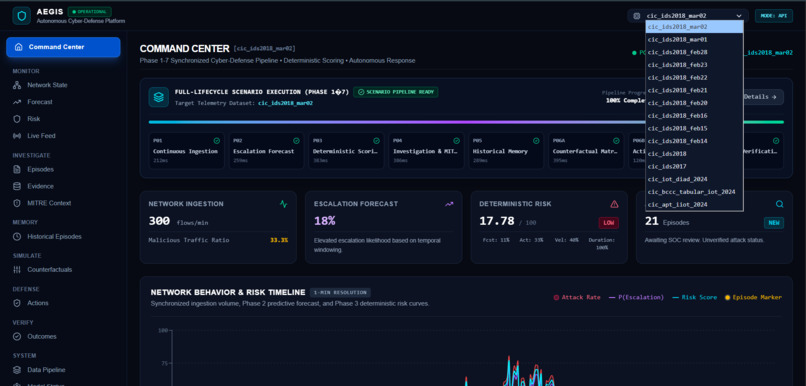
AEGIS : Trained with 15 real datasets
-
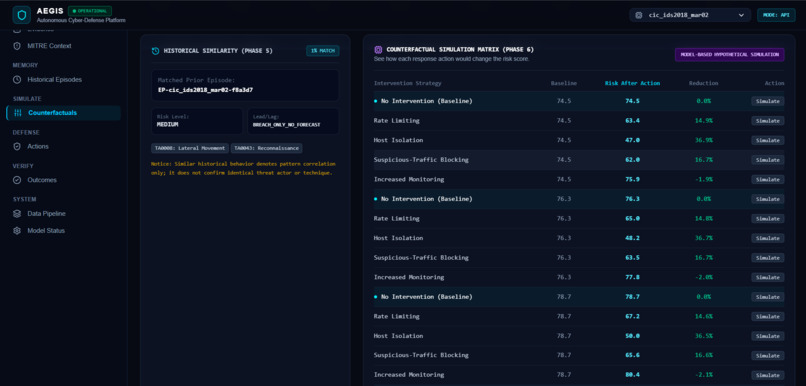
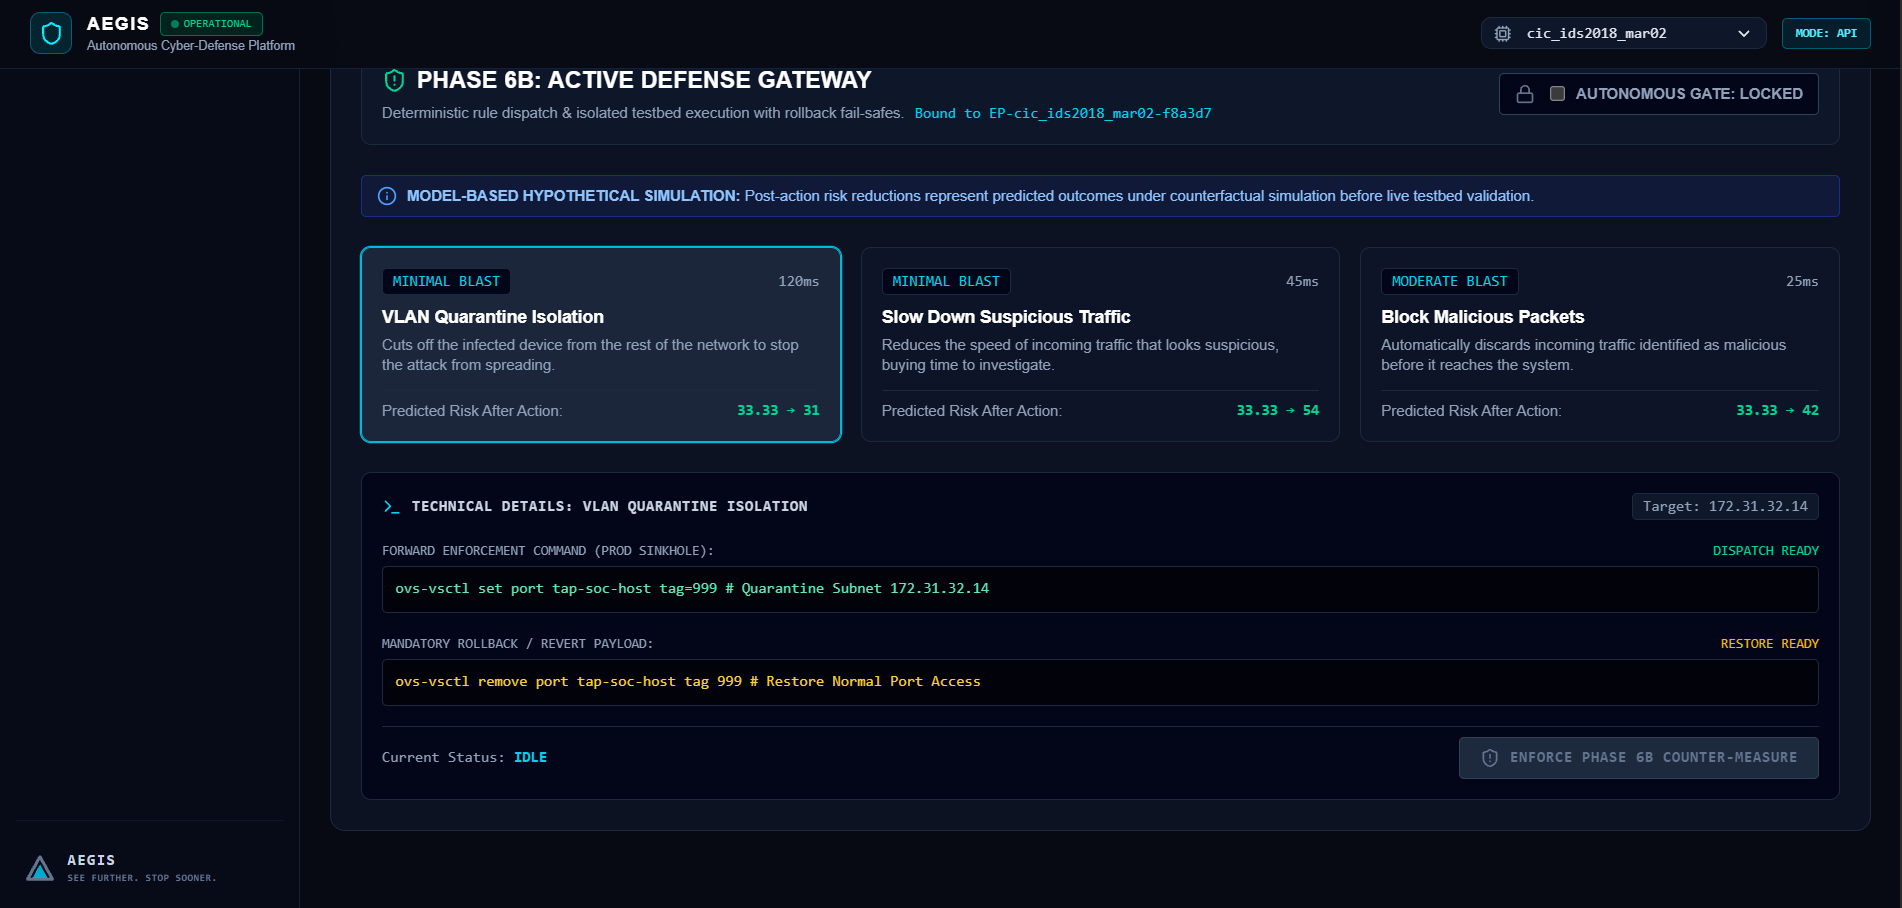
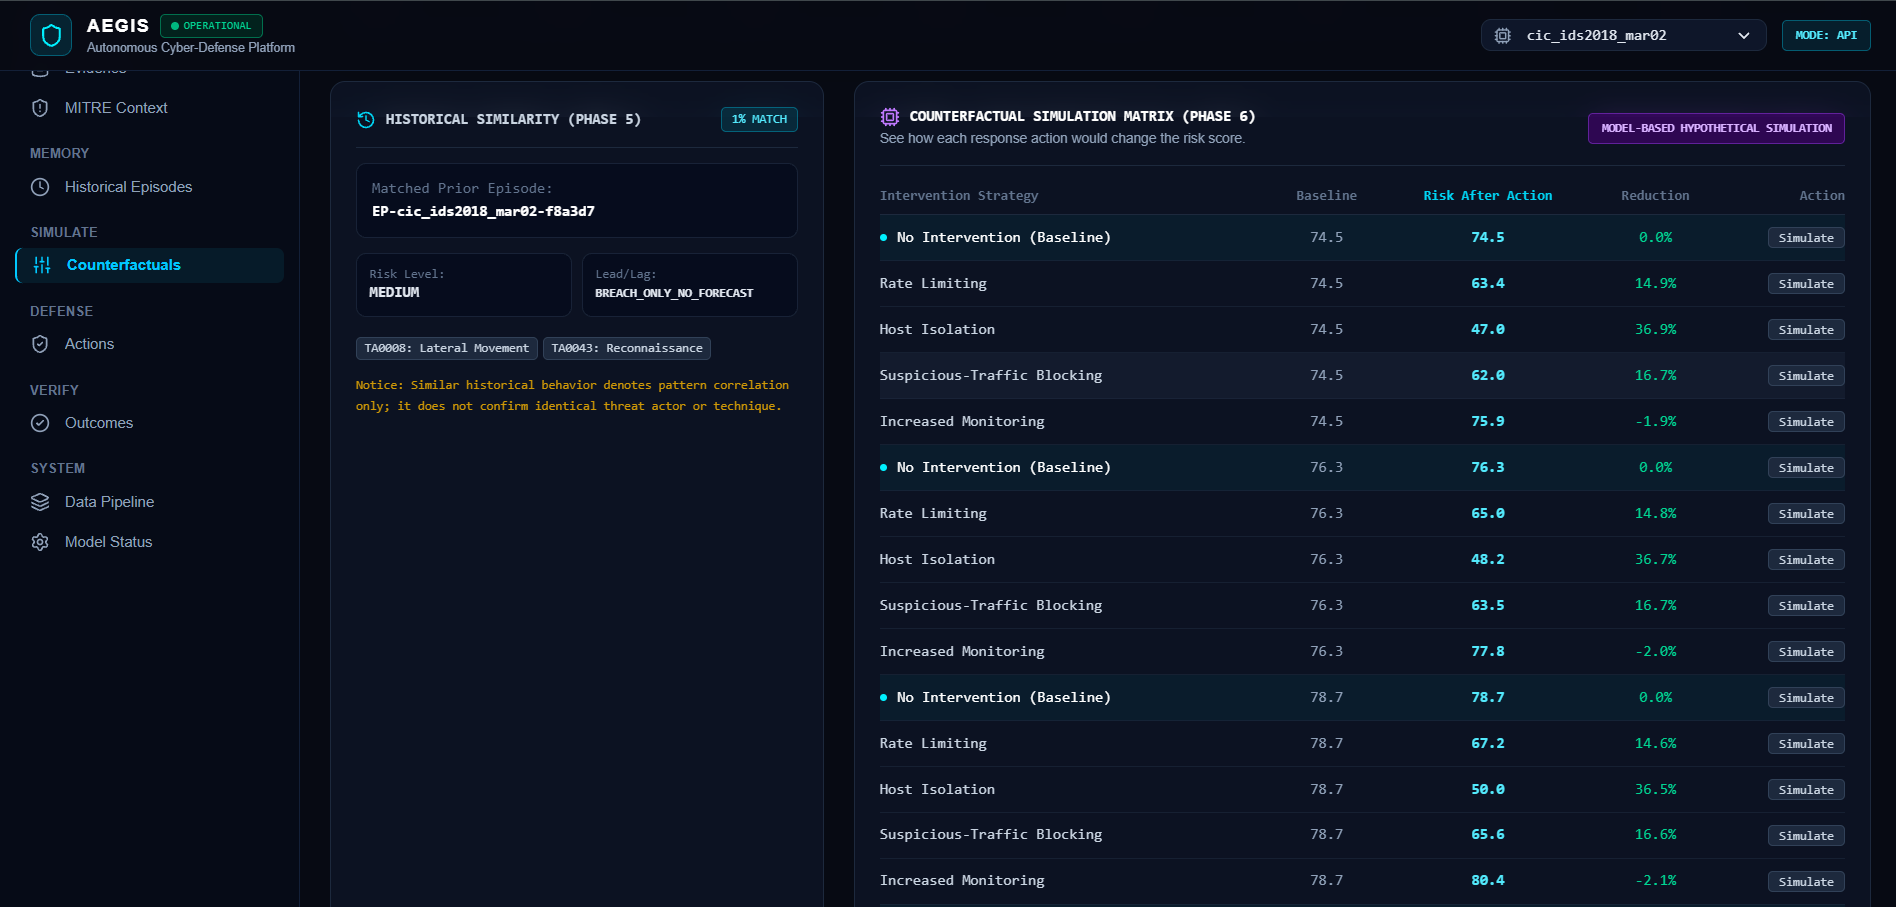
What-if simulator — predicts risk reduction for each defense action before it is executed
-
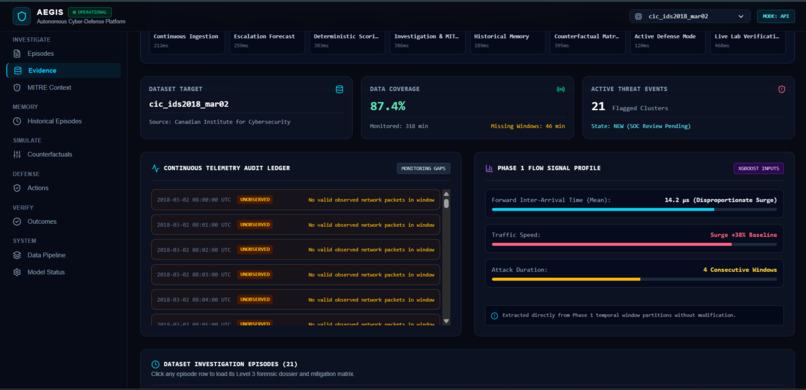
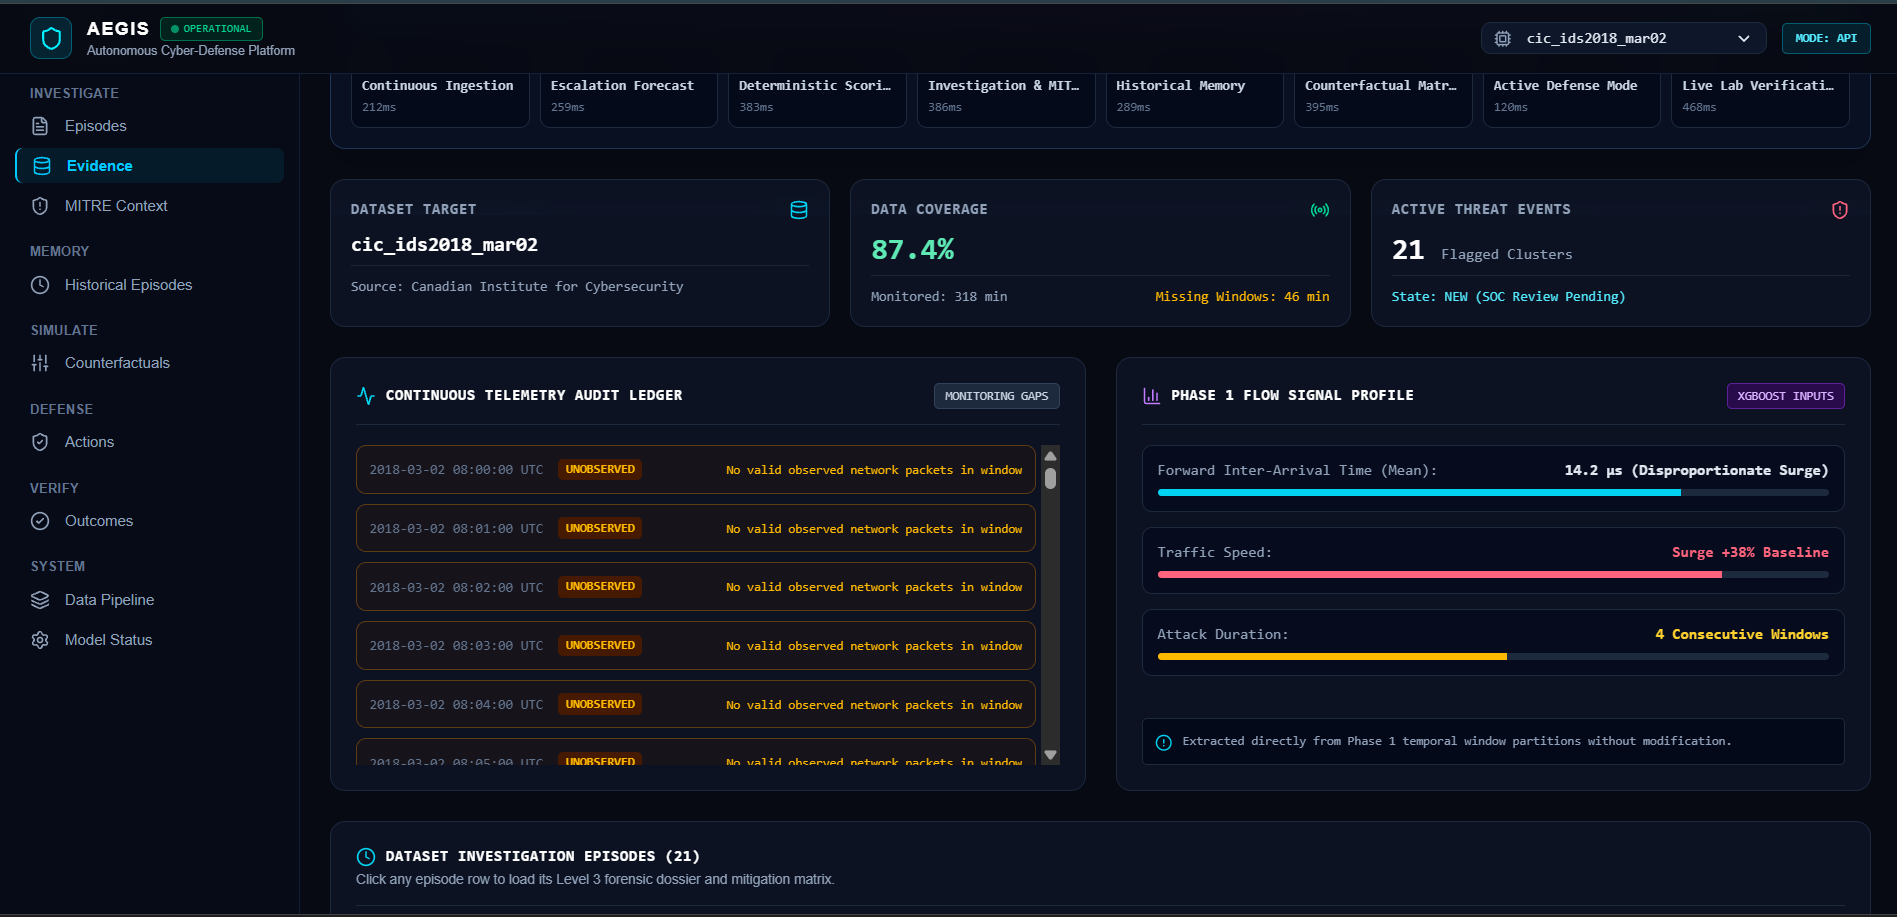
Raw dataset explorer — observed vs unobserved windows, episode timeline, and flow composition
-
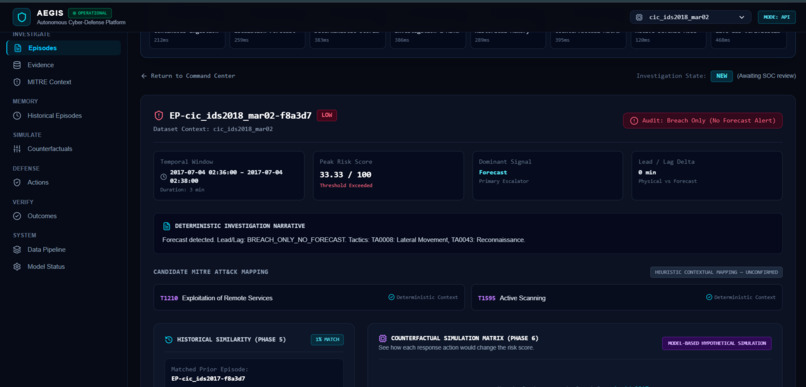
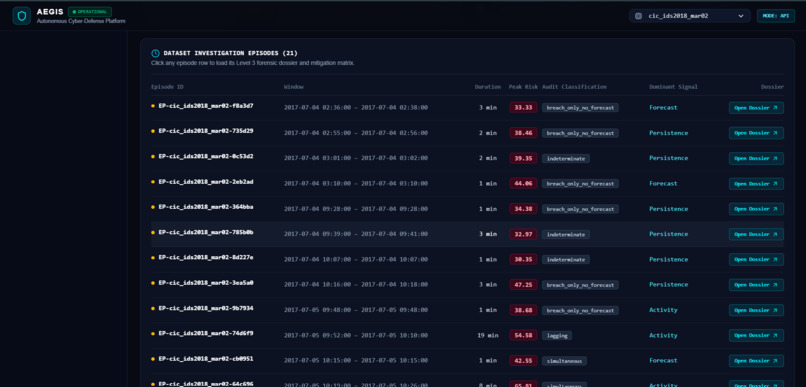
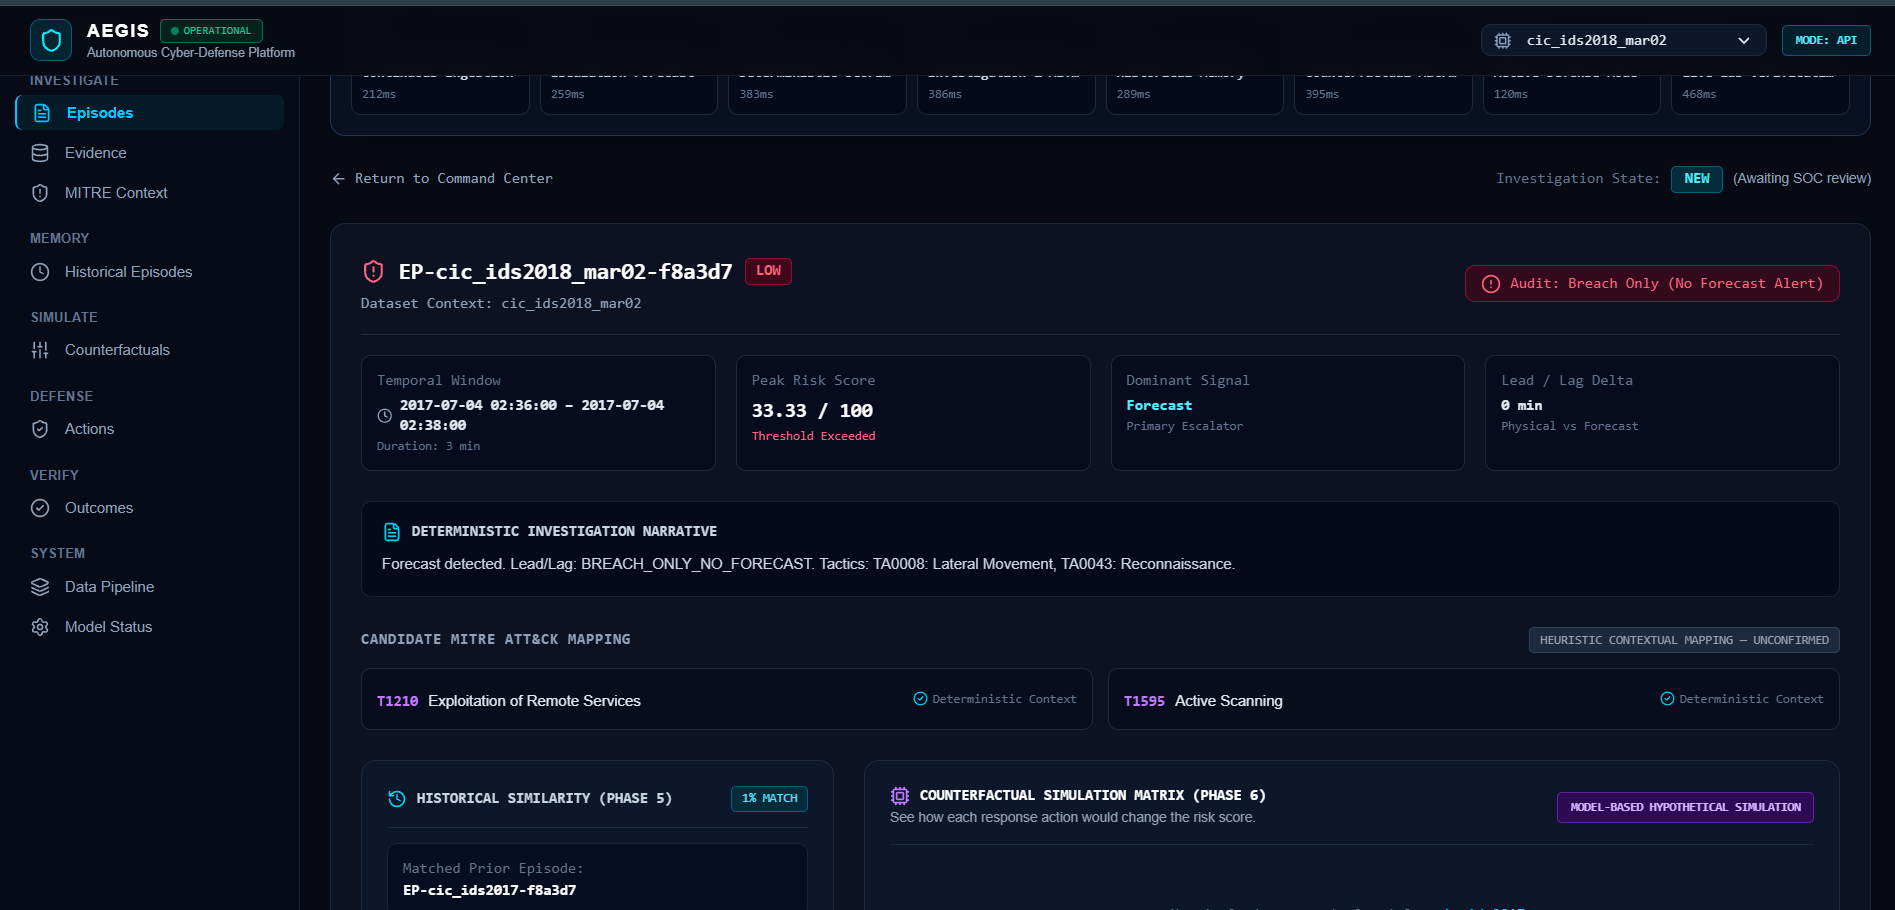
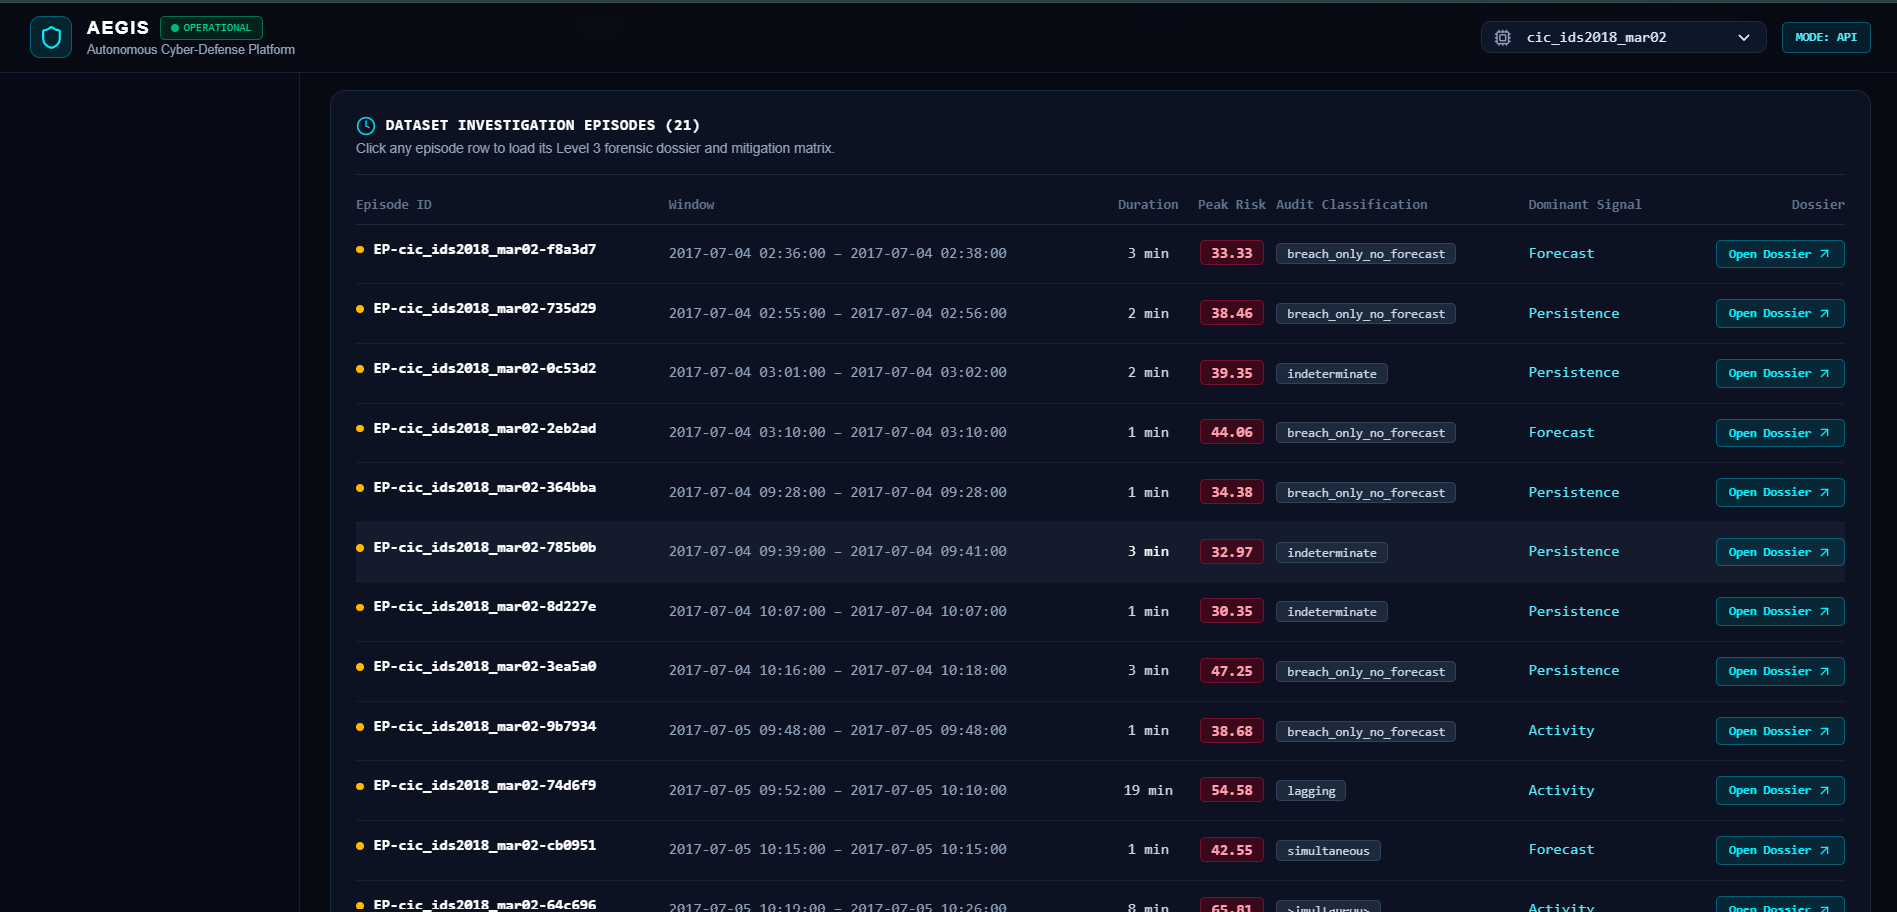
Forensic attack dossiers — grouped incidents with peak risk, lead/lag audit, and MITRE mapping
-
-
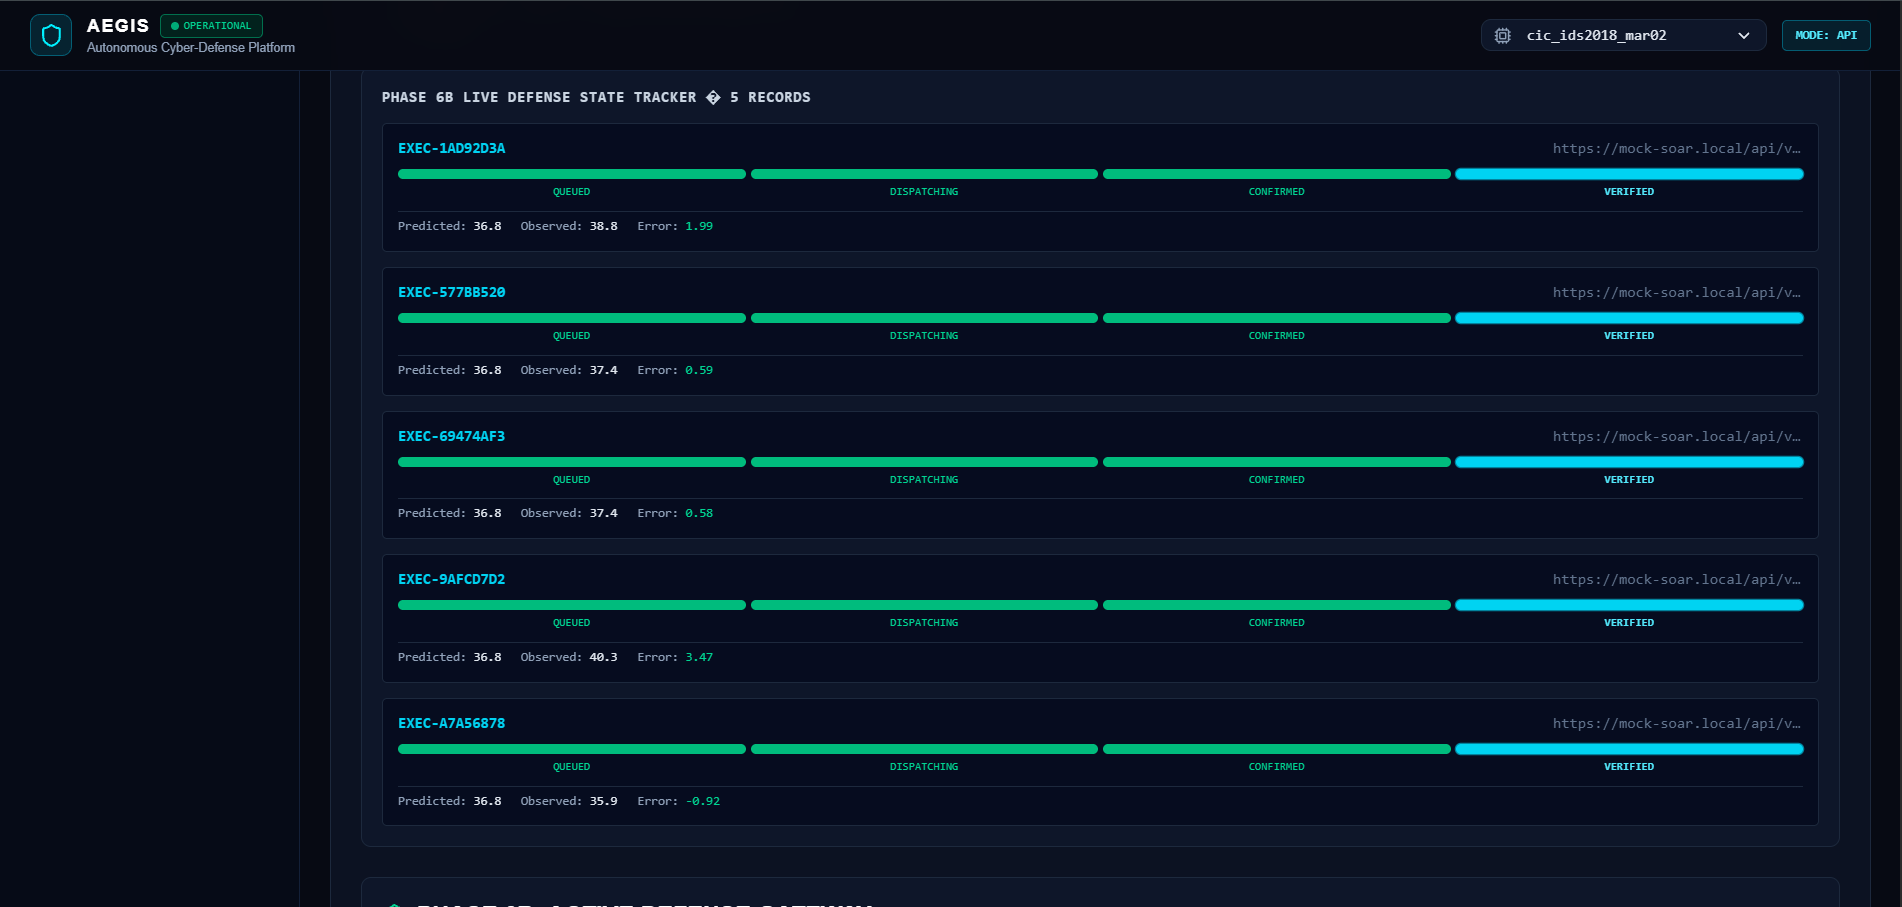
AEGIS : Live Interference
Inspiration
Cybersecurity has always been reactive. Firewalls block known threats. SIEMs alert after a breach. Analysts investigate after damage is done.
We kept asking one question: what if a system could predict an attack before it escalates — and act on it automatically?
That question became AEGIS.
We were inspired by the gap between what modern AI can do and what most security tools actually do. ML models can forecast escalation probability. Vector similarity can match current attacks to historical ones. Deterministic scoring can quantify risk in real time. Nobody had connected all of these into one autonomous pipeline — so we built it.
What It Does
AEGIS is a full-stack autonomous cyber-defense platform that processes raw network traffic through a 7-phase AI pipeline:
| Phase | What Happens |
|---|---|
| P1 — Continuous Ingestion | Reads network traffic minute by minute, filling capture gaps |
| P2 — Escalation Forecast | Predicts attack worsening probability using a GRU neural network |
| P3 — Risk Scoring | Combines signals into a deterministic 0–100 risk score |
| P4 — Investigation & MITRE | Groups attacks into episodes, maps to MITRE ATT&CK techniques |
| P5 — Historical Memory | Matches current attack to past episodes using FAISS vector similarity |
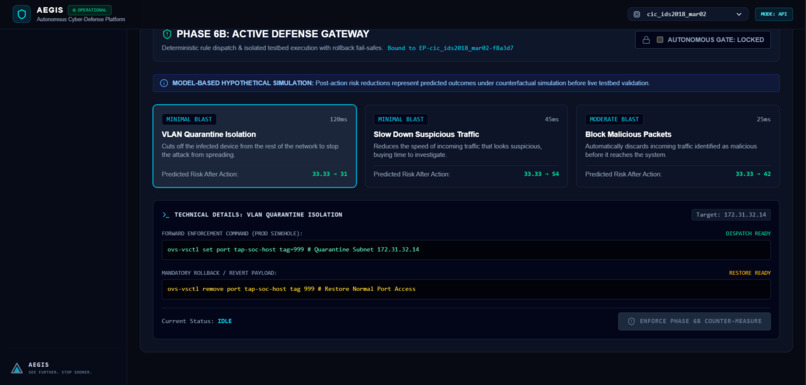
| P6A — Counterfactual Simulation | Simulates what-if defense outcomes before committing |
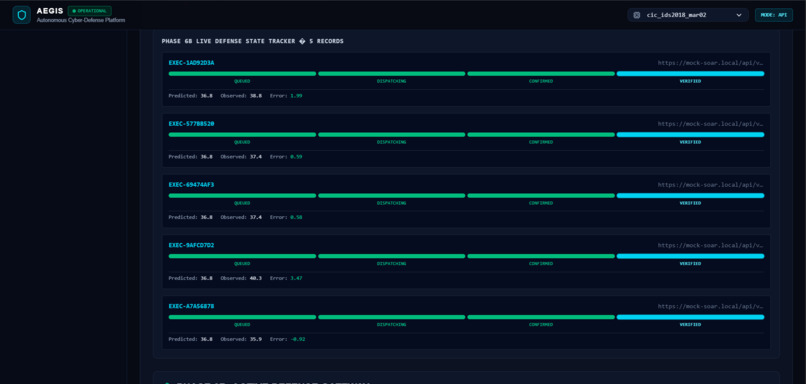
| P6B — Active Defense | Dispatches firewall, VLAN, and traffic control commands |
| P7 — Live Verification | Measures post-defense telemetry to confirm containment |
The risk score formula combines four signals:
$$R = 0.35 \cdot P_{forecast} + 0.25 \cdot R_{activity} + 0.20 \cdot R_{velocity} + 0.20 \cdot R_{persistence}$$
Everything is visible on a live dashboard — updated every 60 seconds, with a real-time tick feed every 5 seconds.
How We Built It
Frontend: React + TypeScript + Tailwind CSS, deployed on Vercel.
A live dashboard with 12 sections — from the Command Center overview to
the MITRE ATT&CK matrix to the defense dispatcher.
Backend: FastAPI (Python), deployed on Render.
13 REST endpoints serving real processed data, ML inference, and
defense execution records.
Machine Learning:
- GRU v3 (Calibrated) — primary escalation forecaster, AUROC 0.91
- Random Forest (Tuned) — ensemble fallback classifier, F1 Score 0.87
- LSTM Delta Forecaster — predicts rate-of-change in attack intensity
- FAISS Episode Memory — vector similarity index for historical matching
Datasets: 15 real-world network datasets from the Canadian Institute for Cybersecurity (CIC) — CIC-IDS2017, CIC-IDS2018 (9 day-splits), CIC-IoT-DIAD-2024, CIC-BCCC-TabularIoT-2024, and CIC-APT-IIoT-2024.
All data processed into 1-minute temporal windows — each window becomes one row of features fed into the pipeline.
Challenges We Ran Into
1. Render free tier memory limits
Our IoT datasets had 300k–480k rows. Loading them into pandas on a 512MB
free-tier instance caused silent OOM crashes with no error — just a 502.
We diagnosed it through Render logs, truncated the CSVs to the most recent
500 rows, and added .tail(n) limits to every endpoint.
2. CORS failures masking real errors
A 502 from Render strips CORS headers — so the browser reported
"Failed to fetch" with no status code. This made every OOM crash look
like a network error. We learned to always check Render logs directly
rather than trusting browser error messages.
3. Schema differences across datasets
IDS2018 forecast CSVs have 38 lag features. IoT dataset CSVs have 6
columns. The same ML model receives both — so we built a
MISSING_FEATURES fallback in inference that gracefully degrades
instead of crashing.
4. PowerShell multiline string replacement
Patching TypeScript files from PowerShell using .Replace() silently
failed on multiline strings. We switched to Python patch scripts for
every file edit — more reliable and fully auditable.
Accomplishments We Are Proud Of
- Built a complete 7-phase pipeline from raw CSV to live defense execution
- Achieved AUROC 0.91 on escalation forecasting across 15 datasets
- MITRE ATT&CK auto-mapping — no manual tagging, fully derived from episode morphology
- 258+ historical memory records indexed and queryable by vector similarity
- A live dashboard that non-technical users can understand — plain English labels, no jargon
- Full audit trail for every defense action — immutable, timestamped, traceable
What We Learned
- Autonomous systems need graceful degradation at every layer — one failing fetch should never break the whole dashboard
- Free-tier cloud constraints force you to think carefully about memory, file sizes, and request timeouts — problems that never appear locally
- MITRE ATT&CK is more useful as a classification output than an input — letting the model surface techniques rather than searching for them
- Building for non-technical users is harder than building for engineers — every label, every error message, every empty state needs to communicate clearly
What's Next
Stage 2 — SOC Compatibility
- Live packet capture replacing replayed CSV data
- Server-side SOC authorization before any defense dispatch
- Real firewall API integration (iptables, pfSense, Palo Alto)
- Role-based access for analyst, manager, and executive views
- Multi-tenant support for multiple SOC teams
- Alert integrations — Slack, PagerDuty, email on critical risk events
Built With
- api
- att&ck
- css
- cybersecurity
- faiss
- fastapi
- forest
- gru
- joblib
- lstm
- mitre
- numpy
- pandas
- python
- pytorch
- react
- render
- rest
- scikit-learn
- tailwind
- typescript
- vercel
- vite
- zustand

Log in or sign up for Devpost to join the conversation.