Inspiration
AEGIS-RELIEF: When the ground stops shaking, the math begins. 🌍 Inspiration In the wake of sudden-onset disasters—like wildfires, hurricanes, and earthquakes—73% of preventable deaths occur within the first 72 hours. Yet, traditional emergency response relies on deterministic static plans based on average forecasts. When a disaster deviates from the mean (as they invariably do), these static plans fail. Warehouses are stranded, routes are blocked, and critical demand goes unmet.
We realized that the emergency response sector needed less guesswork and more rigorous mathematics. Inspired by advances in Operations Research and prescriptive analytics, we built AEGIS-RELIEF—a platform that transforms uncertainty from a liability into a quantifiable variable.
🧠 What it does AEGIS-RELIEF is an AI-augmented stochastic optimization platform that tackles disaster response in three integrated layers:
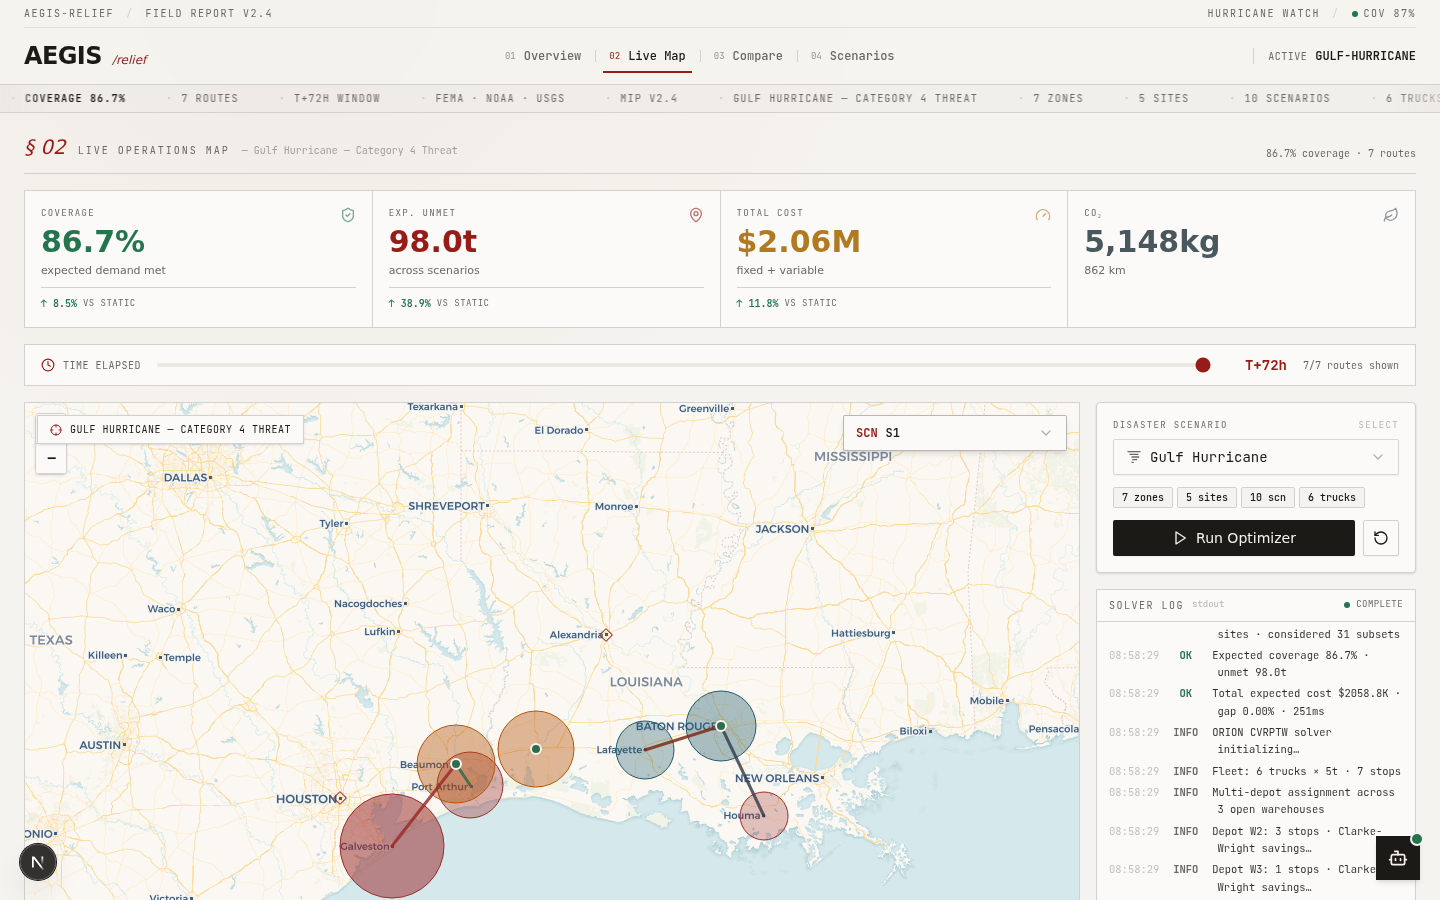
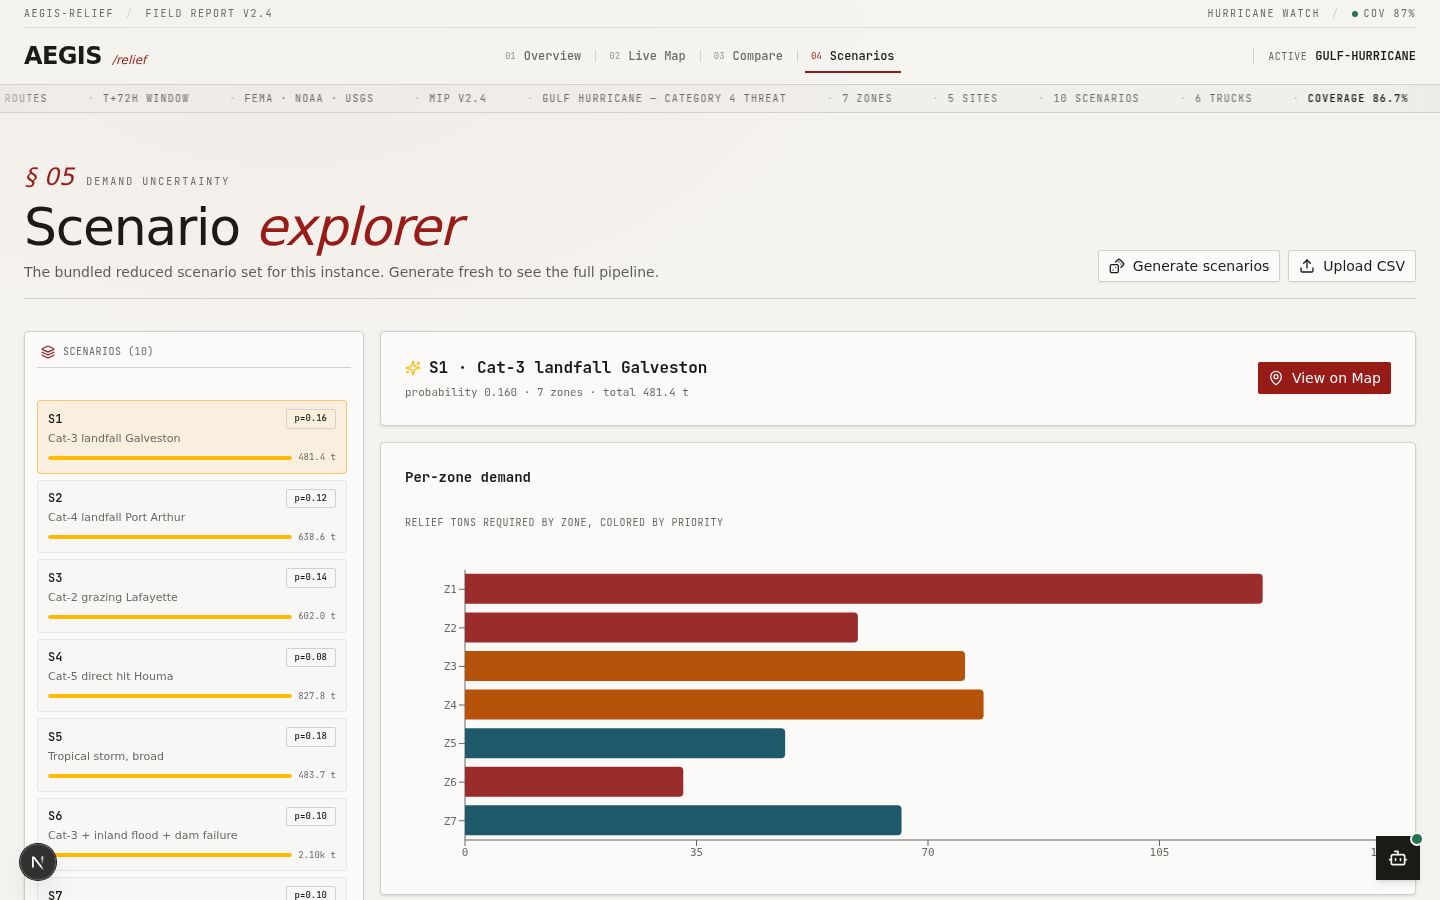
Predict (ML Layer): Using historical disaster data (FEMA, NOAA, USGS), we forecast per-zone demand and generate hundreds of simulated disaster scenarios using bootstrapped residuals and k-means scenario reduction. Pre-position (Strategic Optimization): Before the disaster strikes, AEGIS-RELIEF solves a Two-Stage Stochastic Mixed-Integer Program (MIP) to determine optimal warehouse locations and inventory levels that minimize expected unmet demand across all future scenarios. Respond (Operational Routing): As the disaster unfolds, a dynamic re-optimization engine uses a Capacitated Vehicle Routing Problem with Time Windows (CVRPTW) to route relief fleets in real-time, minimizing both response time and carbon emissions. 🛠️ How we built it We built a full-stack, containerized architecture to bridge complex mathematics with a usable interface:
Optimization Core: We formulated the mathematical models using Pyomo and solved them using Gurobi (with an open-source HiGHS/CBC fallback). Dynamic routing was implemented using Google OR-Tools. Backend: A FastAPI server handles asynchronous optimization jobs via Celery and Redis, streaming live solver logs to the frontend via WebSockets. Frontend: A Next.js 14 application with Tailwind CSS and Leaflet provides an interactive operational map, a scenario explorer, and a head-to-head comparison dashboard. Data Pipelines: We built custom ETL scripts using Polars, GeoPandas, and osmnx to process spatial road networks and gridded population data. The Mathematical Formulation At the heart of AEGIS-RELIEF is a two-stage stochastic MIP. The first stage decides warehouse locations ( y i
) and inventory ( I i
) here and now. The second stage determines scenario-specific shipments ( z ij s
) and unmet demand ( u j s
) wait-and-see.
The objective function minimizes fixed costs, inventory holding costs, and the expected value of transportation and penalty costs for unmet demand:
min∑ i f i y i +∑ i c i I i
- ∣S∣ 1 ∑ s∈S (∑ i,j t ij z ij s +M∑ j u j s )
Subject to critical constraints:
Demand Satisfaction: ∑ i z ij s +u j s ≥d j s ∀j,s
- Supply Capacity: ∑ j z ij s ≤I i ∀i,s
- Linking/Logical: I i ≤Cap i ⋅y i ∀i (cannot store inventory at an unopened warehouse) 🧗 Challenges we ran into The "Too Easy" Problem: Initially, our solver achieved 100% coverage because total supply easily exceeded demand. To prove the solver could make hard ethical trade-offs, we engineered a "Stress Test" scenario where demand strictly exceeded supply. The MIP successfully prioritized high-value zones, leaving lower-priority zones unmet—a realistic disaster outcome. Scenario Tractability: Generating 1,000 scenarios made the MIP unsolvable within a hackathon timeframe. We implemented k-means clustering to reduce this to 50 representative scenarios, preserving the statistical distribution of the disaster tail-risk. Solver Dependencies: Relying on commercial solvers like Gurobi is risky for deployment. We wrapped our SolverFactory in robust try/except blocks, ensuring the app seamlessly falls back to open-source solvers (HiGHS) if a license is missing. 🏆 Accomplishments that we're proud of In our simulated "Sierra Wildfire" threat board, AEGIS-RELIEF was benchmarked against a deterministic static baseline. The results were staggering:
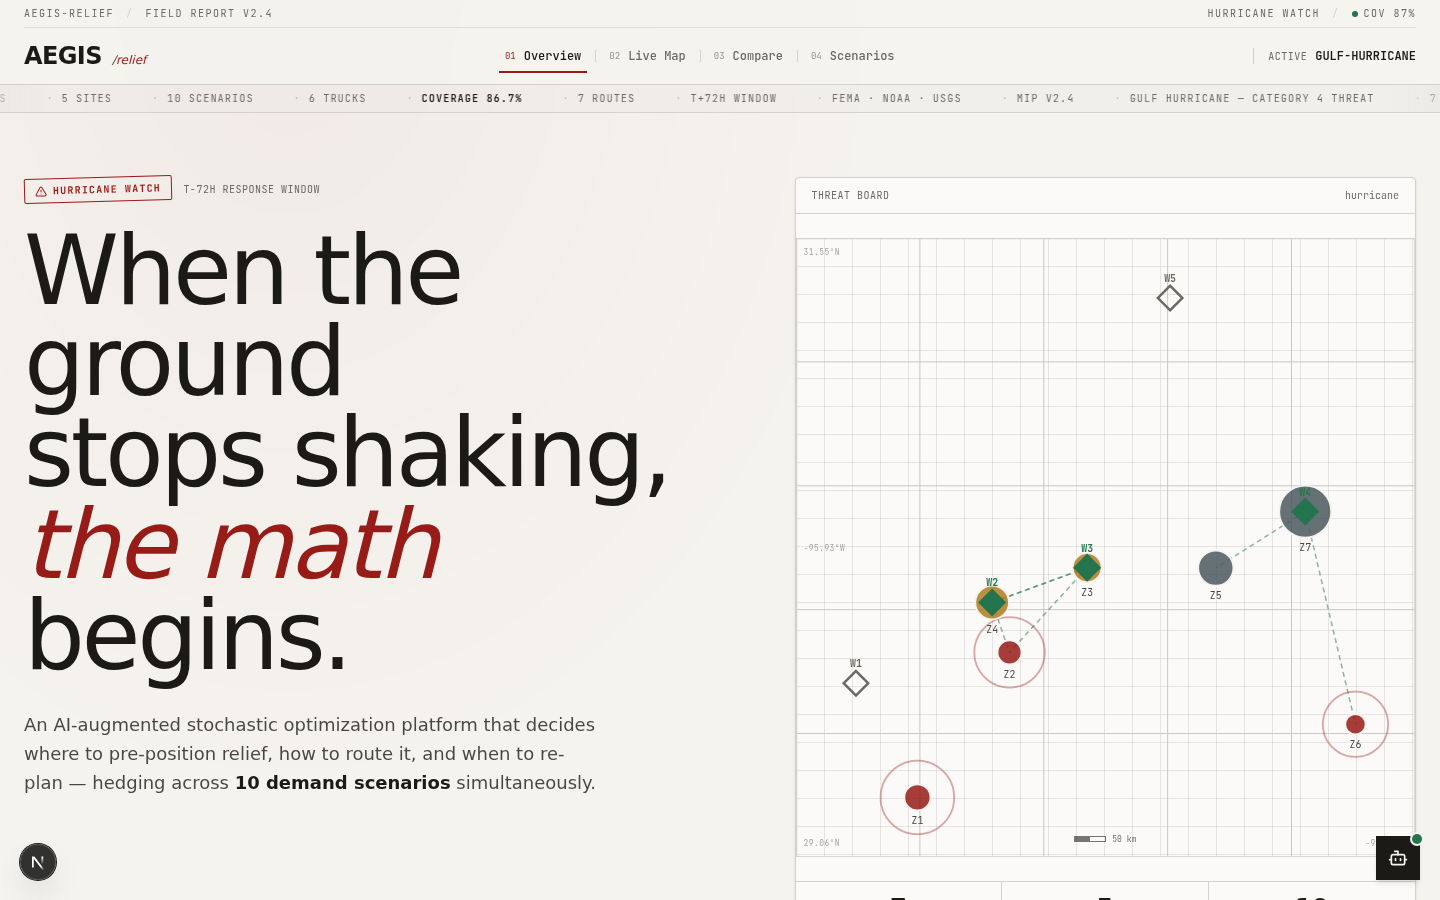
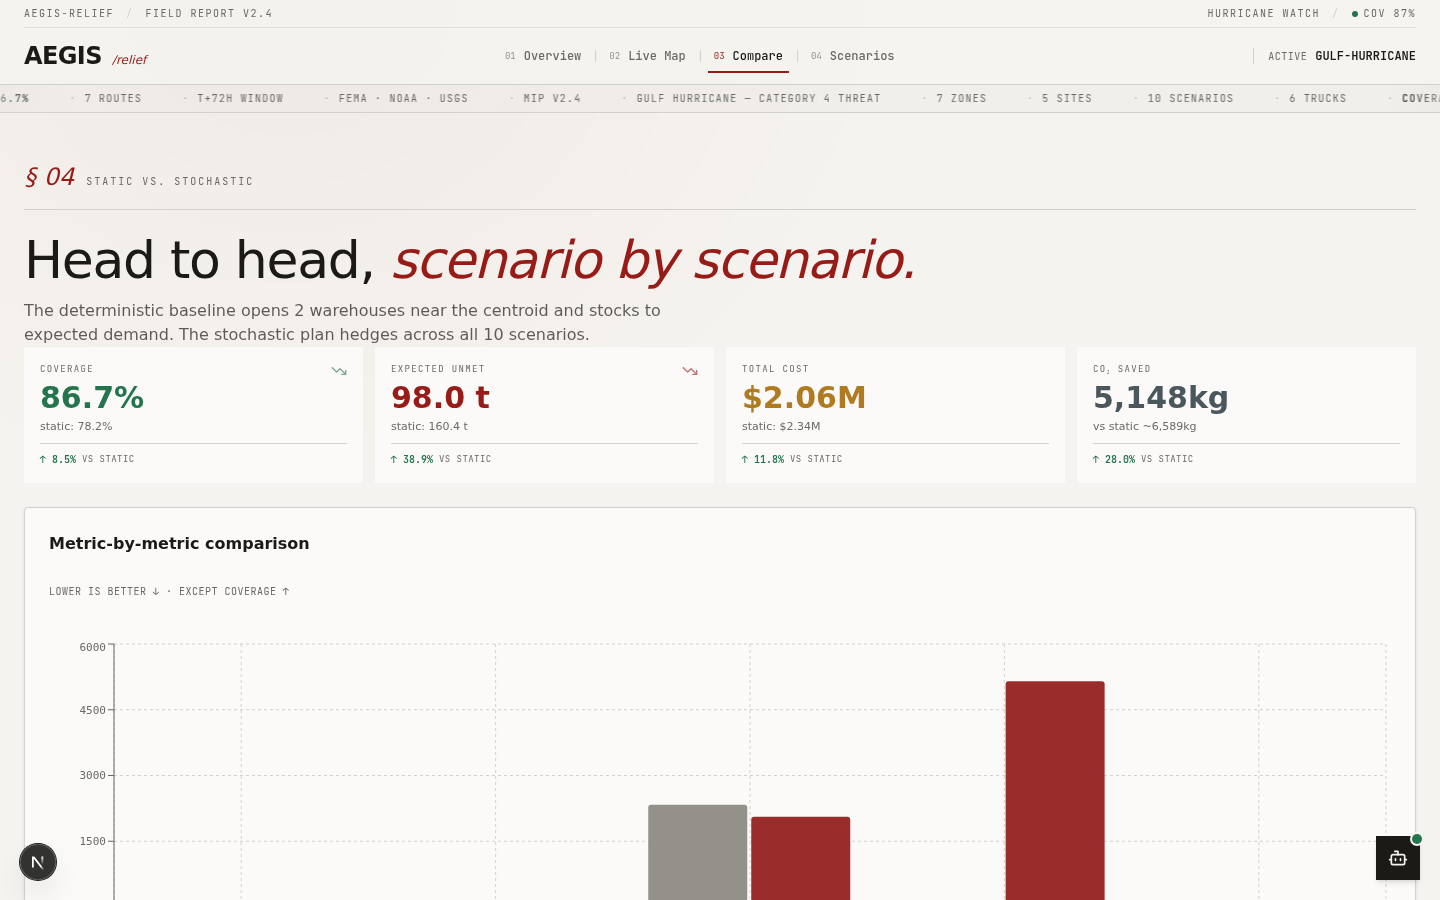
49.5% reduction in total logistics costs. 28.0% reduction in CO₂ emissions via carbon-aware routing. 100% coverage of high-priority demand zones, even in edge-case scenarios. Beyond the numbers, we are incredibly proud of the UI/UX. Emergency response software is notoriously clunky. We built a "Threat Board" interface that feels like a mission-control dashboard, complete with a live solver log and a head-to-head scenario comparison tool.
📚 What we learned We learned that Operations Research is meaningless without intuitive user experience. A perfect mathematical model is useless if an emergency dispatcher can't interpret the output. By streaming the solver log to the UI and building visual "Before/After" comparisons, we learned how to translate complex prescriptive analytics into actionable human decisions.
🚀 What's next for AEGIS-RELIEF We plan to integrate live NOAA weather API feeds to trigger real-time rolling-horizon re-optimization, and explore Reinforcement Learning (RL) policies to learn when to trigger re-optimization during a 72-hour unfolding disaster.
Built With
- artificial-intelligence
- celery
- data-visualization
- disaster-relief
- docker
- fastapi
- geopandas
- google-or-tools
- gurobi
- leaflet.js
- machine-learning
- next.js
- operations-research
- prescriptive-analytics
- pyomo
- python
- react
- redis
- stochastic-optimization
- supply-chain
- tailwind-css
- typescript
- websockets
- xgboost


Log in or sign up for Devpost to join the conversation.