-
-
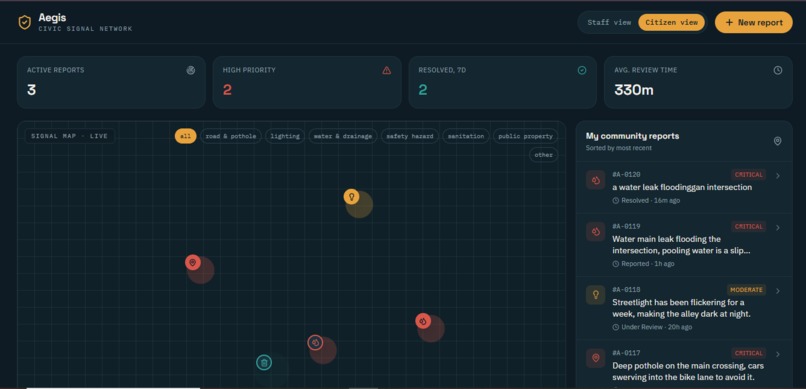
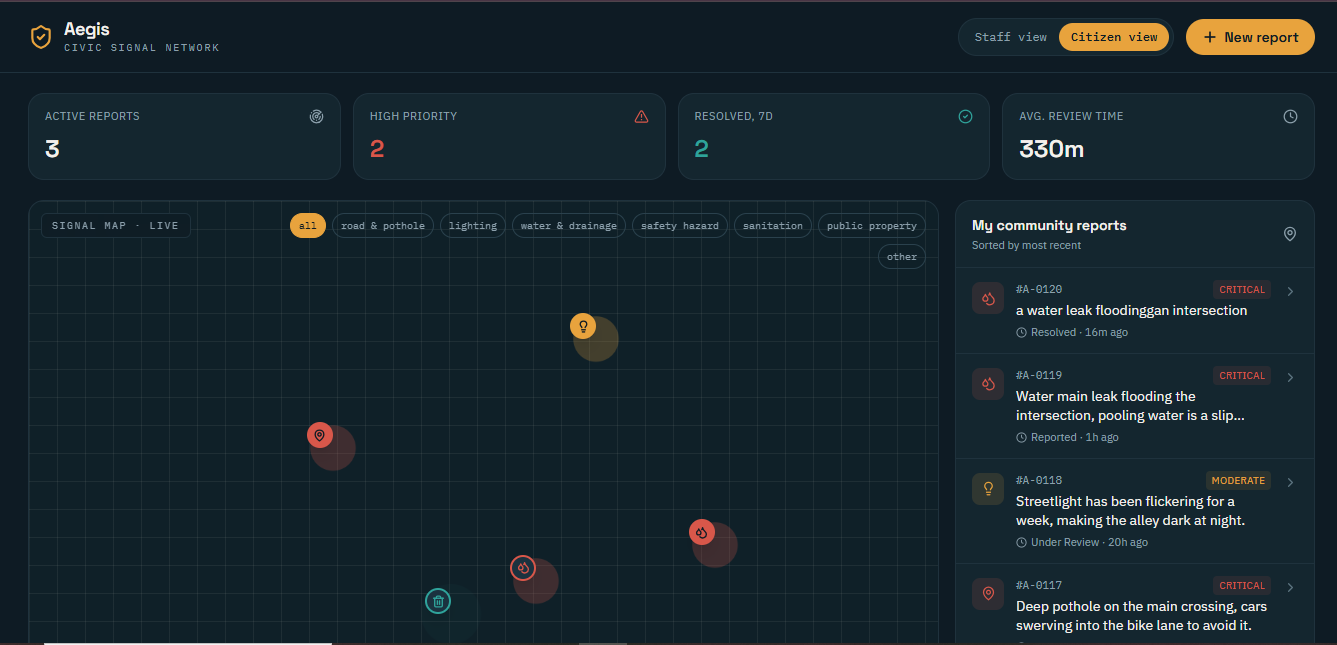
Citizen view: track your own reports from submission to resolution, alongside a live signal map of everything nearby.
-
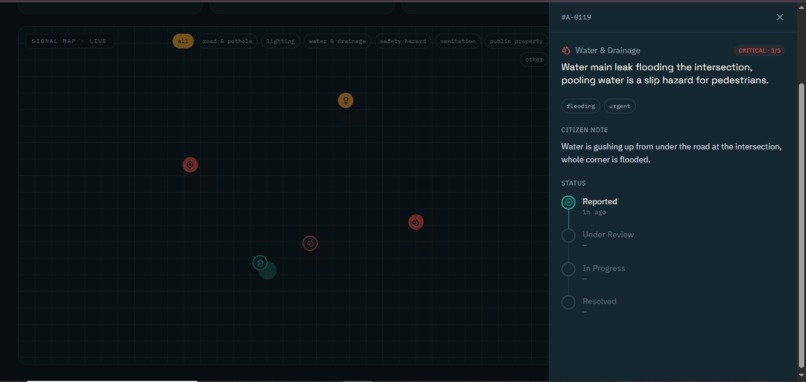
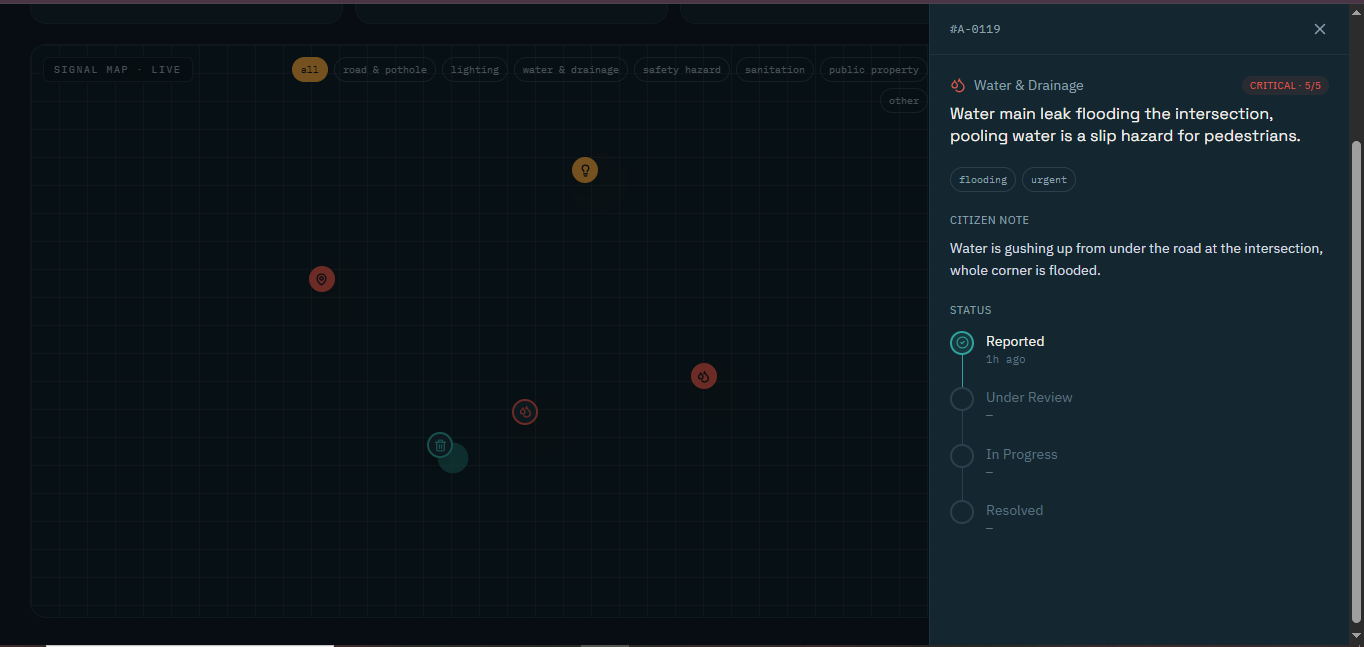
Every report gets an AI-generated severity score, tags, and a staff-ready summary , with a full status timeline citizens can follow.
-
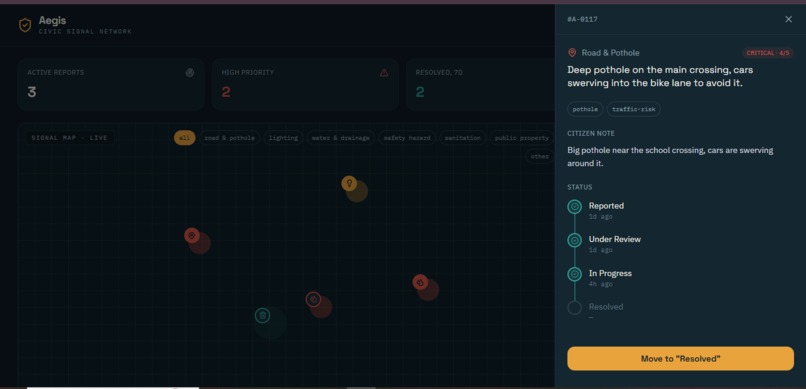
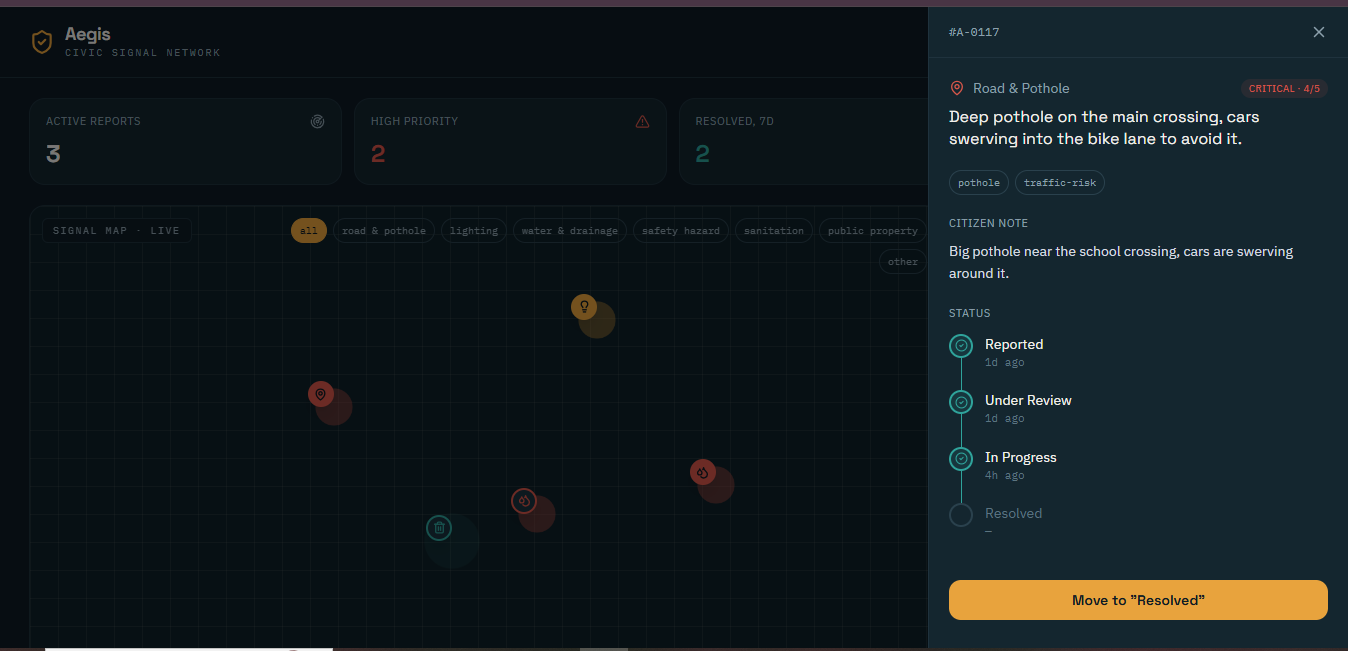
Staff view: one click moves a report through Reported → Under Review → In Progress → Resolved.
-
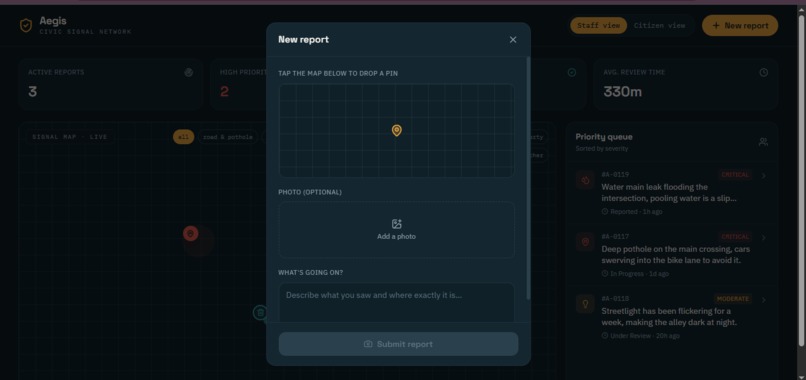
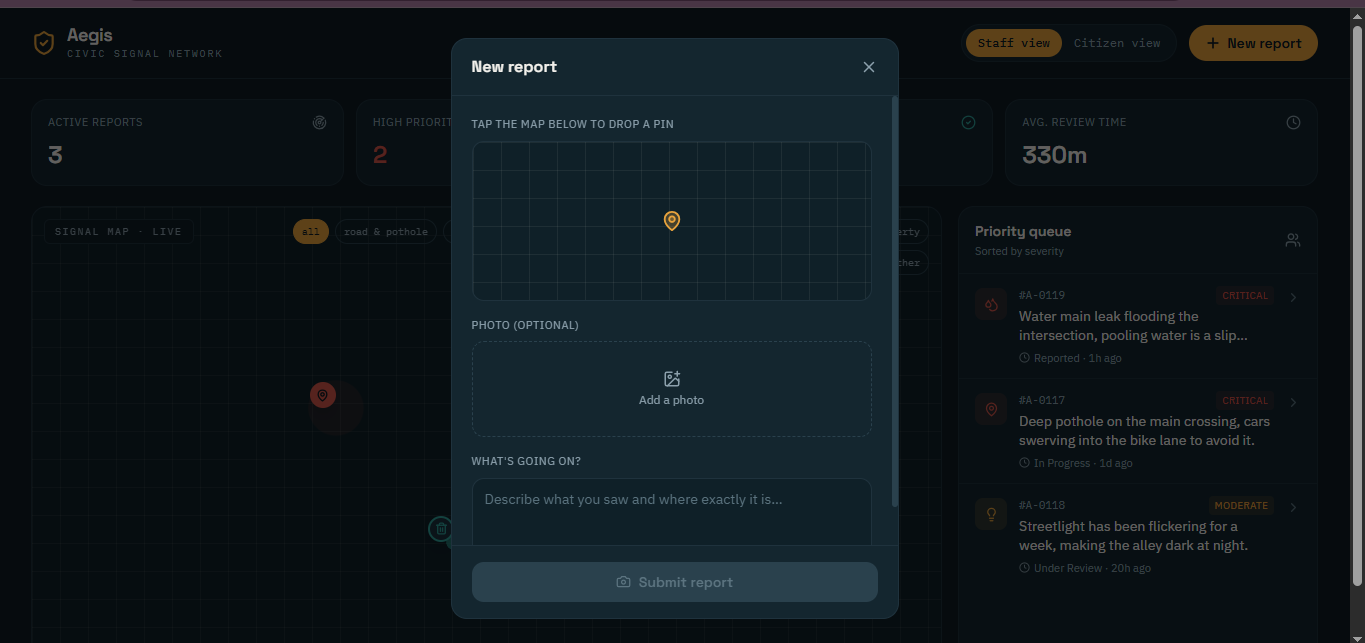
Reporting an issue takes seconds: drop a pin, optionally add a photo, describe what you see ,GPT-4o mini handles the rest.
Inspiration
What it does
How we built it
Challenges we ran into
Accomplishments that we're proud of## Inspiration
Every city drowns in the same problem: potholes, broken streetlights, water leaks, and safety hazards get reported through scattered channels — texts, calls, random apps — and nobody triages them well. Small issues turn into big ones, and the neighborhoods that need help most are often the ones that get seen last, because there's no system ranking urgency.
We wanted to build the "911 dispatch" model for civic infrastructure: report an issue in seconds, and have AI instantly figure out how urgent it is — instead of a human digging through a backlog days later.
What it does
Aegis lets a citizen drop a pin on a map, add a photo, and describe an issue in plain language. The moment they submit, GPT-4o mini reads the photo and description together and returns structured data: category, a 1–5 severity score, a staff-ready one-line summary, and relevant tags — all in a couple of seconds.
That triaged report instantly appears on a live "Signal Map" and in a priority queue sorted by severity, so city staff see the most urgent issues first instead of a flat, unsorted list. Nearby reports of the same category are automatically flagged as possible duplicates.
The app has two views:
- Staff view — a live ops dashboard: priority queue, status controls, filters by category.
- Citizen view — a simple tracker so the person who reported an issue can watch it move from Reported → Under Review → In Progress → Resolved, closing the transparency loop.
How we built it
- Next.js 14 (App Router) + React + TypeScript for the frontend and API layer
- Tailwind CSS for a custom civic/infrastructure design system — a dark "blueprint grid" map, severity-coded pulse markers (teal → amber → coral), and monospace data typography for report IDs and timestamps
- GPT-4o mini via a server-side Next.js API route (
/api/classify), so the OpenAI key never touches the browser. It's prompted to return strict JSON (category, severity, summary, tags, reasoning) from a photo + text description - lucide-react for iconography
- Deployed on Vercel
Challenges we ran into
- Getting the AI to reliably return clean, parseable JSON every time , we constrained it with a strict schema prompt and forced JSON mode, plus added a keyword-based fallback classifier so a live demo (or a flaky API call) never breaks the experience.
- Designing a "map" experience without a real mapping API , we built a stylized blueprint-grid interface where pins are placed by percentage coordinates, which turned into a distinctive visual signature for the product instead of a limitation.
- Balancing two very different user needs (city staff triage vs. citizen transparency) in one interface without it feeling like two separate apps.
What's next
- Swap the stylized grid for real geocoding (Mapbox/Google Maps) so pins reflect actual addresses
- Move report storage from browser-local to a real database (Supabase/Postgres) for true multi-user, multi-city persistence
- Add automatic duplicate merging (not just flagging), and SMS/email notifications when a citizen's report changes status
- Explore fine-tuning the classification prompt per city, since severity thresholds (e.g., what counts as "critical") vary by municipality
What we learned
What's next for Aegis — AI-Triaged Civic Infrastructure Reporting
Built With
- ai
- css
- generative-ai
- gpt-4o-mini
- javascript
- lucide-react
- nextjs
- openai
- react
- tailwindcss
- typescript
- vercel

Log in or sign up for Devpost to join the conversation.