-
-
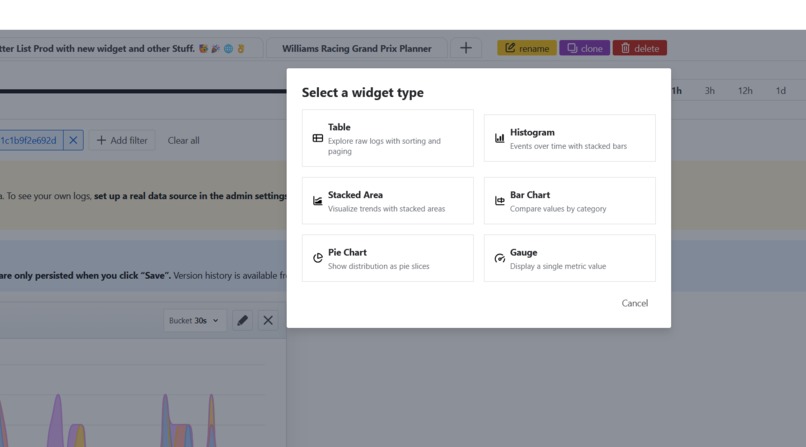
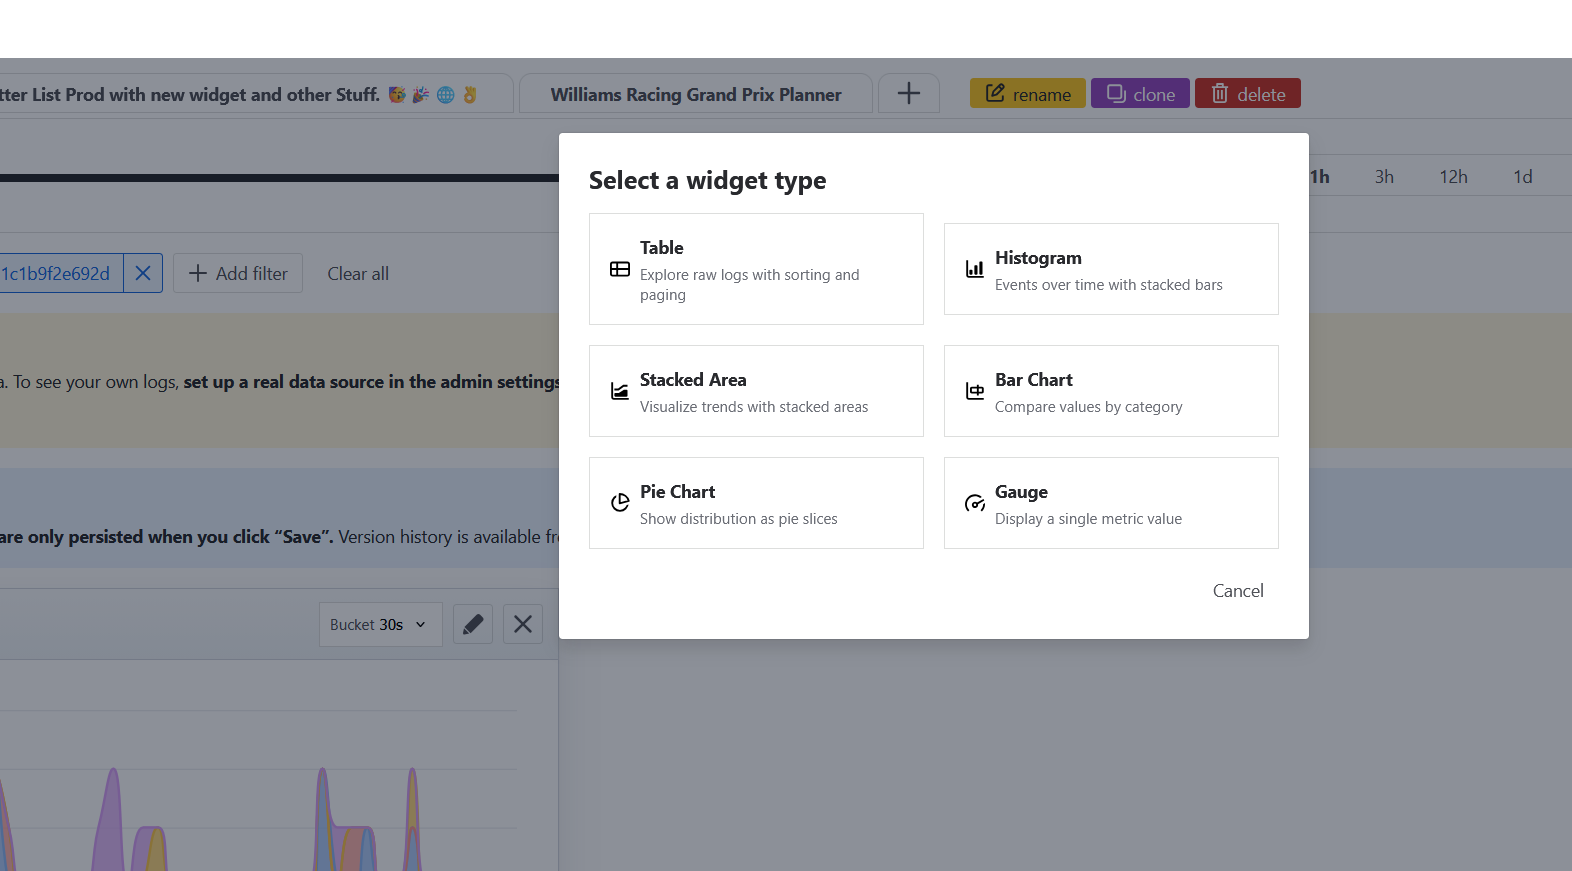
Add new Widgets
-
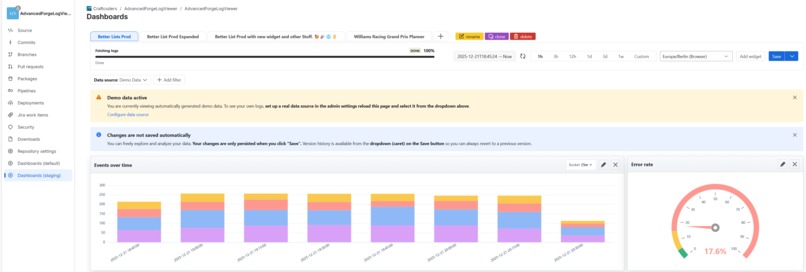
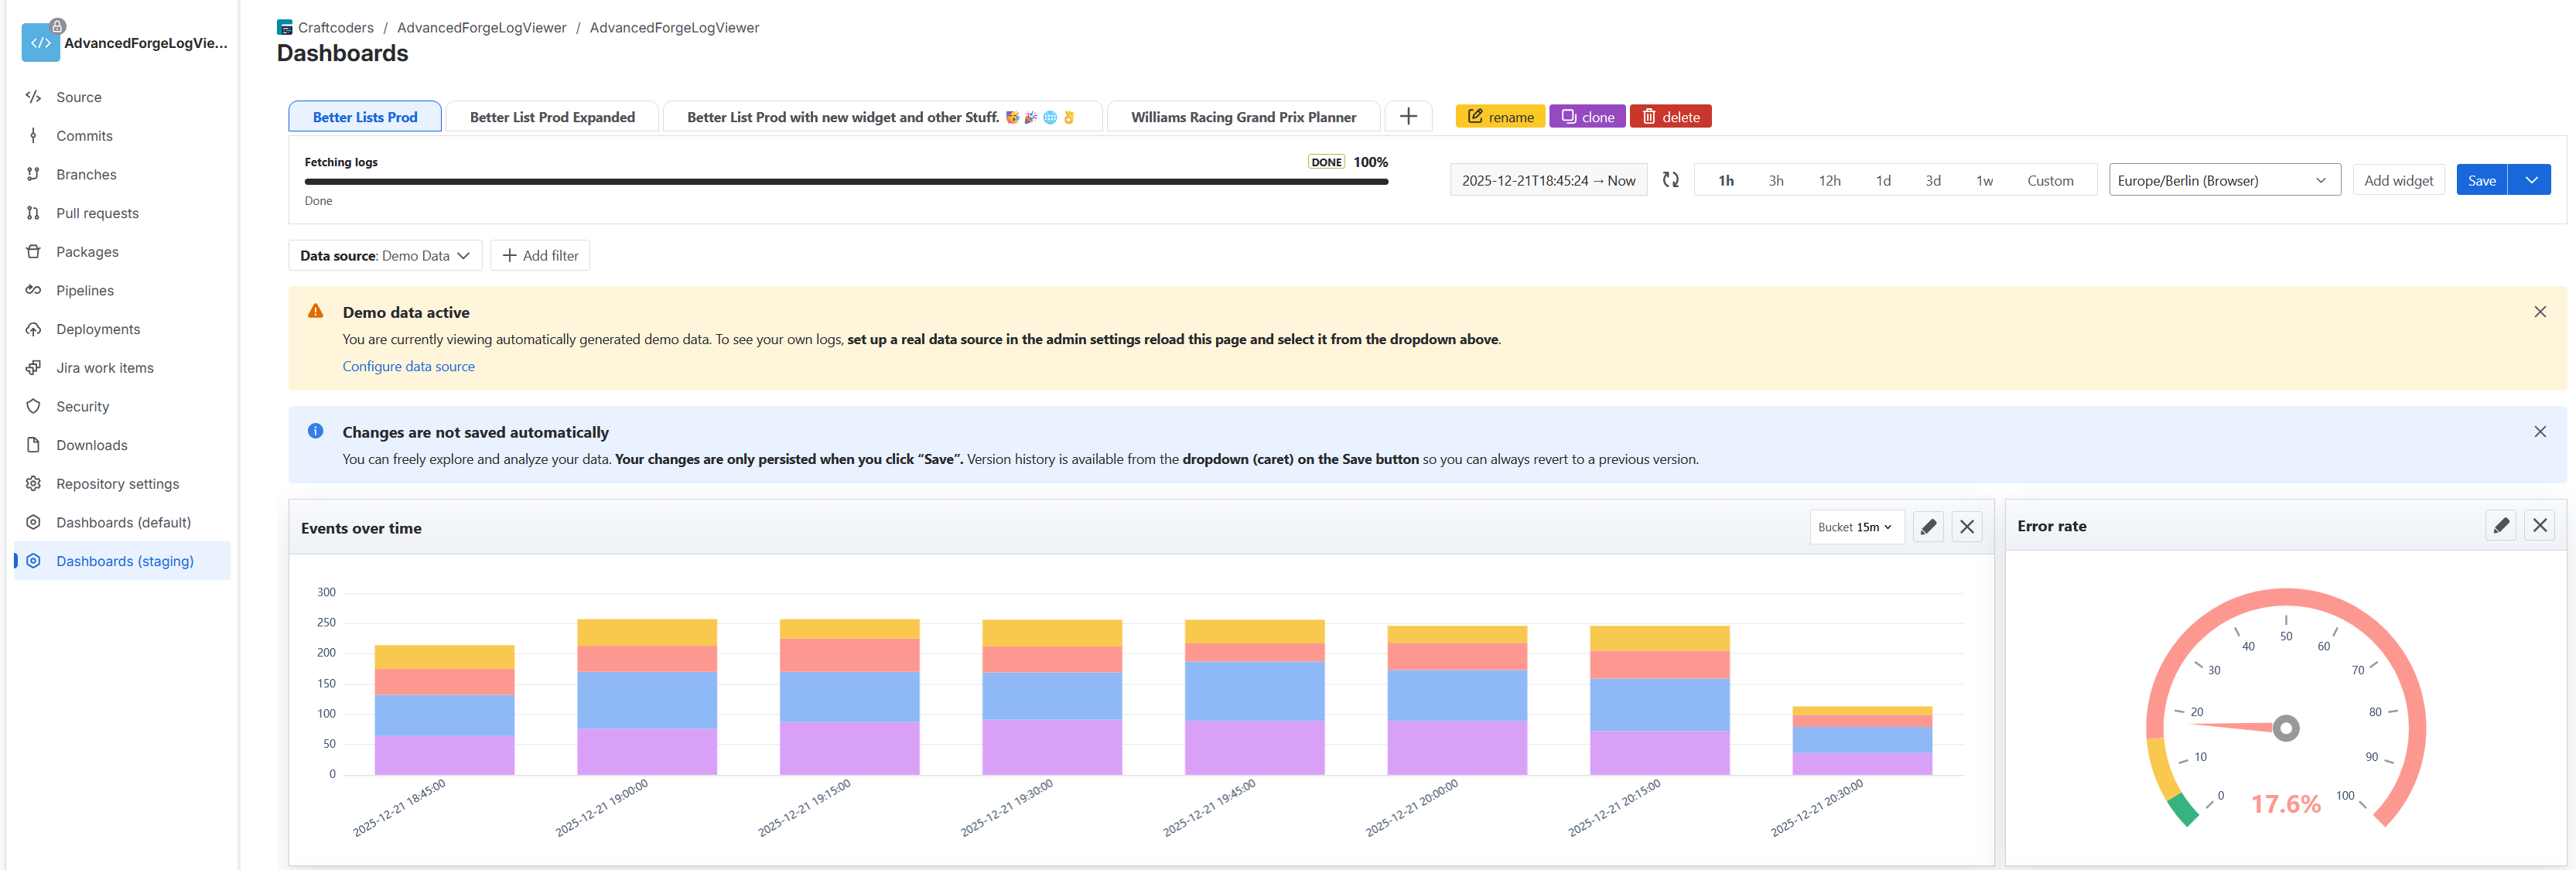
Dashboard
-
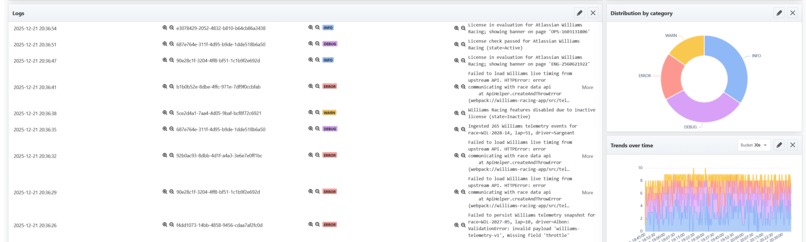
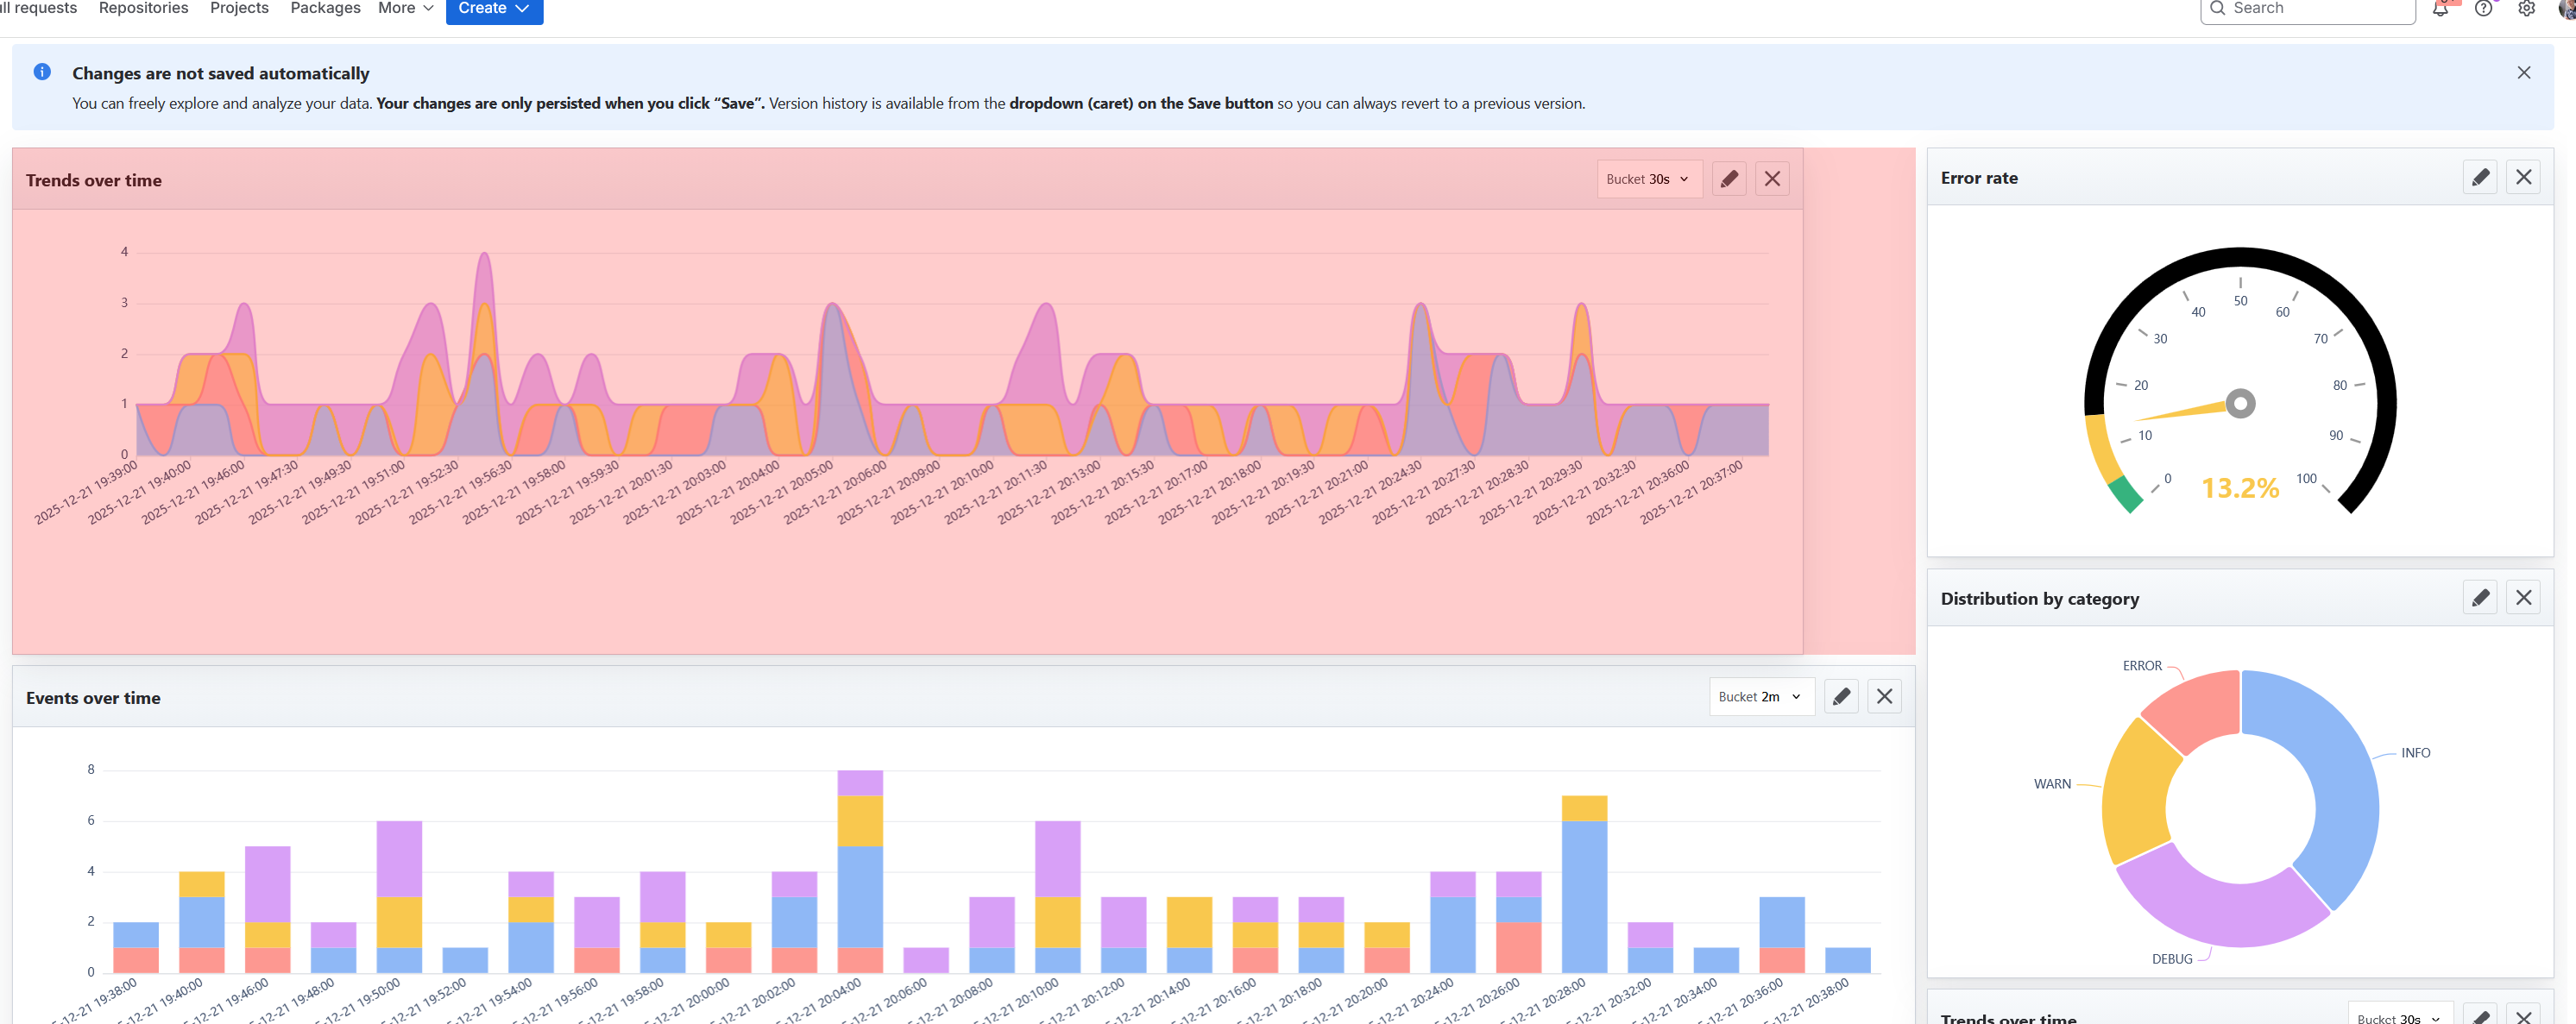
See Logs
-
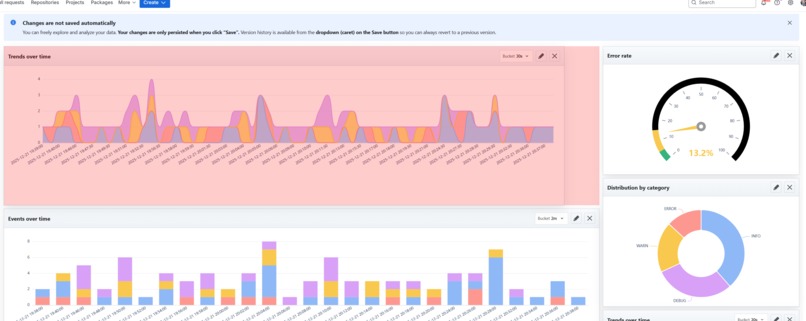
Resize and replace Widgets

Inspiration
This year, we built extensively with Atlassian Forge. As our apps moved beyond “toy” complexity, we ran into a familiar challenge: observability.
Forge provides built-in logging and a log explorer in the developer console, which works well for small apps. For larger apps and deeper analysis, Atlassian recommends external tools such as Datadog, Grafana, Splunk, or ELK.
We asked ourselves whether there was a middle ground: a solution that keeps log data inside the Atlassian ecosystem, integrates directly with Bitbucket, and provides the analytical power of tools like Grafana or Kibana—while also extending log retention beyond Forge’s 14-day limit.
We envisioned a tool that feels like an F1 pit wall: a single dashboard showing real-time insights into your Forge app
We wanted answers to questions like:
- What changed after the last deployment?
- Are errors trending up or down?
- Which function or module is generating noise?
- Can issues be correlated across invocations without switching tools?
- How can log data be researched quickly for customer tickets?
What we built
Forge Log Dashboards for Bitbucket brings interactive, SQL-powered log dashboards directly into a Bitbucket repository.
Architecture
To account for Forge’s stateless nature and to minimize backend load, most processing happens on the frontend.
Frontend (React)
- Uses DuckDB-Wasm, a WebAssembly build of DuckDB, optimized for analytical queries, time-series data, and visualizations.
- Persists dashboards in OPFS (browser storage) for fast reloads.
- Tracks loaded log ranges to avoid redundant backend requests.
Backend (Forge app)
- Fetches logs via Forge APIs and caches them in key-value storage (kvs).
- Compresses log data using Brotli, achieving very high compression ratios (in our testing up to 10000x).
- Uses a custom algorithm to remap and repack paged log data efficiently for frontend consumption.
- Designed to migrate to Forge Object Storage for improved scalability once available.
Dashboards and widgets are stored as JSON in kvs for persistence and easy sharing.
Key features
Dashboards live next to the repo
Versionable, shareable, and reviewable alongside the code they observe.Grid-based widgets
Widgets can be added, moved, and resized freely.SQL-powered widgets (core feature)
- Write arbitrary SQL queries, not just predefined filters.
- Express complex aggregations and correlations directly in SQL.
- Iterate quickly, as queries run locally in the browser database.
- Write arbitrary SQL queries, not just predefined filters.
Global filters
Instantly update all widgets.Timezone switching
Analyze data in UTC, your timezone or in the timezone of your customers.Clone, export, and import dashboards
JSON-based portability.Live editing for debugging
- Changes apply immediately for fast feedback.
- Persistence is explicit by design (save/export when ready).
- Changes apply immediately for fast feedback.
Getting started
After installation, each Bitbucket project gains a new Dashboards menu entry.
To simplify onboarding, we include:
- A demo data module that generates synthetic Forge-like log data.
- Two example dashboards:
- My Racing Example, tailored to the demo data and showcasing highly specific visualizations.
- My Dashboard Example, designed as a base to work with any Forge log data.
Security & privacy notes
Classic SQL injection is not the primary concern
- Users intentionally write their own queries.
- Queries execute locally in DuckDB-Wasm, isolated in the browser or worker context.
- There is no shared server-side SQL engine.
Primary hardening focus: untrusted log content
- Log lines are treated as input data (future).
- Unsafe parsing or escaping could enable “injection via logs.”
Platform constraints help
- Forge and Atlassian security boundaries limit arbitrary outbound connectivity compared to self-hosted solutions.
Challenges we faced
Forge request and payload limits
- Platform constraints strongly influenced log retrieval and transport.
- Compression, paging, and caching were essential.
Performance at scale
- Maintaining fast queries and responsive filters required careful optimization.
Hackathon reality
- One developer’s laptop crashed a day before the deadline. This was a very real (and painful) challenge in the final stretch.
- Code had to be partially recovered from source maps, which was painful but ultimately successful.
Accomplishments we’re proud of
Runs entirely on Atlassian
- No external observability stack required.
- No third-party infrastructure to provision or operate.
SQL over logs inside Bitbucket
- Dashboards embedded next to the code they monitor.
- Flexible queries instead of rigid templates.
A real investigation workflow
- Fast iteration, interactive exploration, and shareable dashboards.
Limitations
Dashboards are currently global
- They are not yet cleanly scoped per repository or workspace.
Safari is not supported
- Required browser features (notably modern storage and runtime APIs) are unreliable or unavailable.
Privacy-first by design
- Data stays inside Atlassian and the browser.
- This is not a “ship logs everywhere” solution.
Live editing favors investigation
- Ideal for debugging and exploration.
- Persistence is explicit rather than automatic.
What we learned
- Logs need structure to become actionable; queryable data beats raw text.
- Consistent schemas enable correlation and reusable dashboards.
- In-browser databases are a strong fit for exploratory observability.
- UX matters: observability only works when it is fast and pleasant to use.
Outlook
- Proper scoping of dashboards (per project, per workspace).
- Additional widget types (percentiles, anomaly detection, top offenders).
- Further security hardening, especially around log ingestion.
- Background jobs to prefetch logs for faster initial load times.
- Support for additional log sources.
- Dataset export (CSV or Parquet) directly from the browser database.
Built With
- atlaskit
- bitbucket
- duckdb
- echarts
- forge
- jest
- react
- typescript


 Gellweiler")


 Gellweiler")
Log in or sign up for Devpost to join the conversation.