-
-
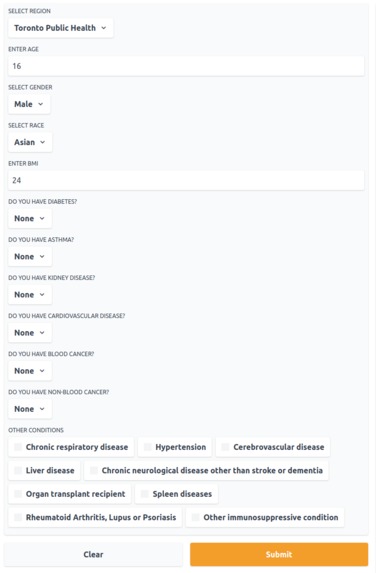
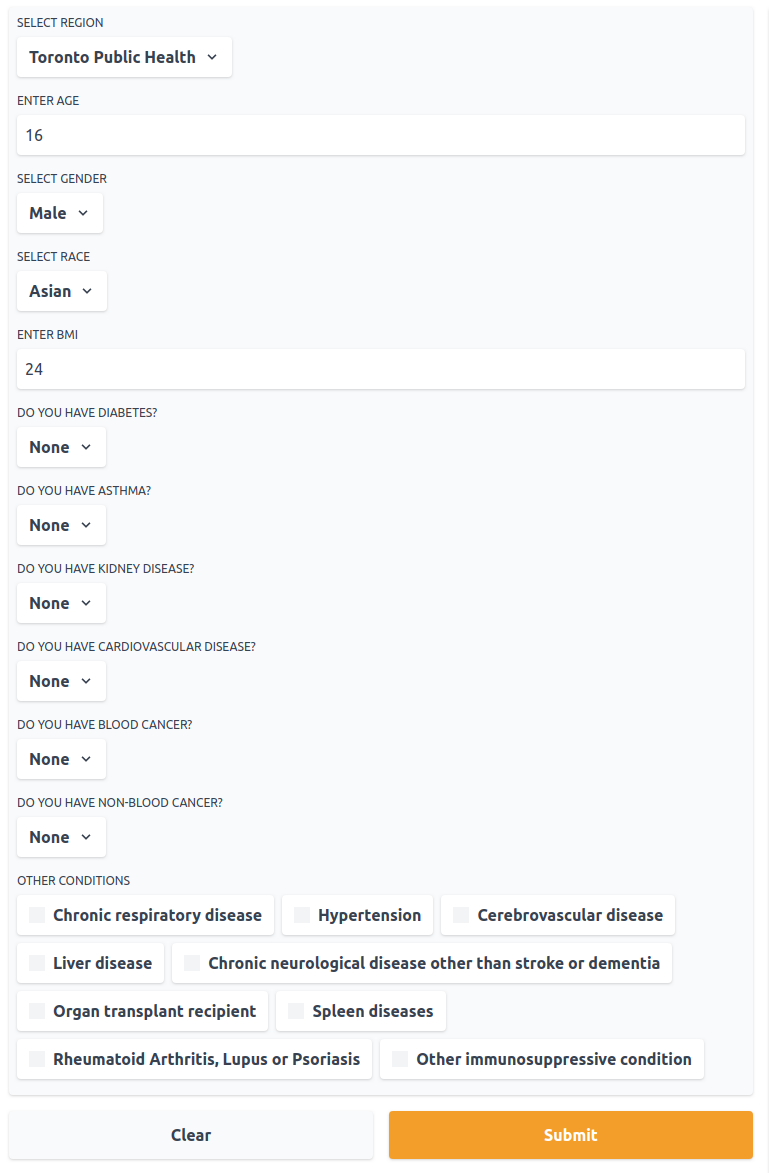
PyVID User Inputs
-
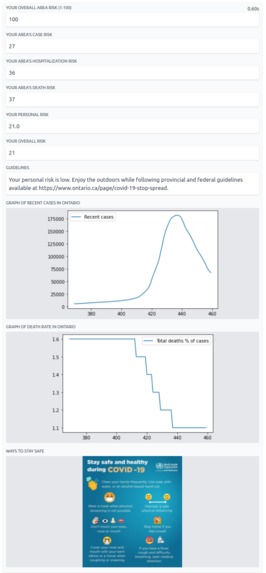
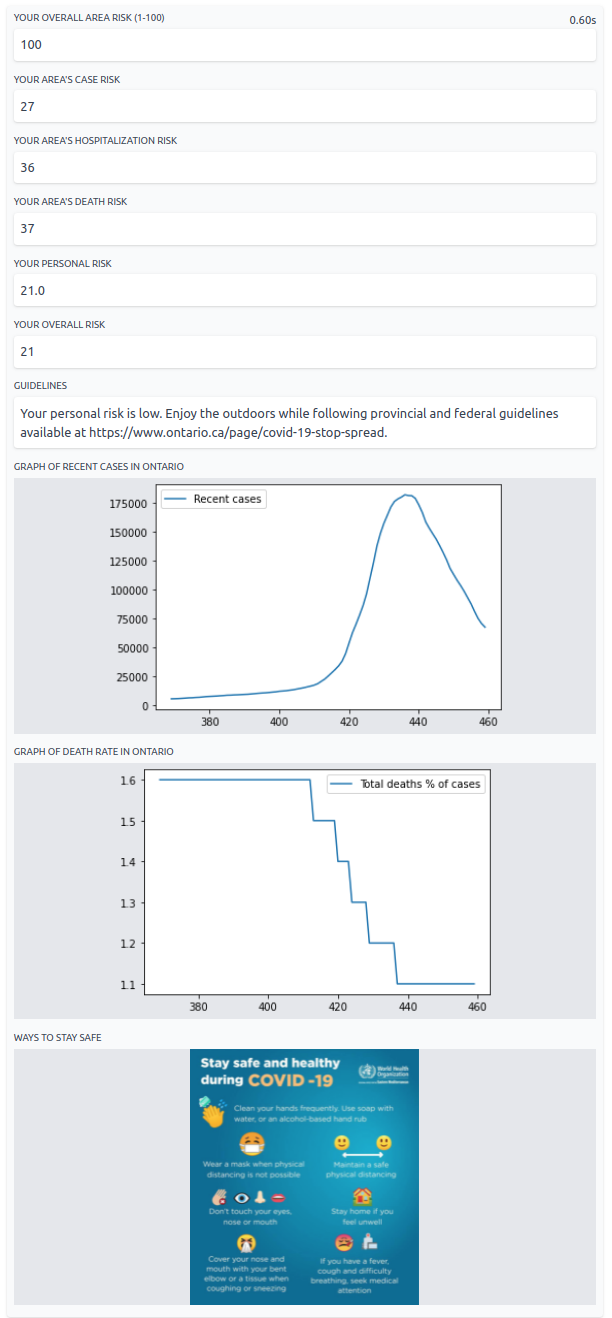
PyVID Outputs
Inspiration
Life is slowly transitioning back to normal. Time dances around us and suddenly, we find the need to go outside more. As restrictions are lifted across Ontario, we must slowly transition back to the old, normal outdoor lifestyle. However, this comes at great risk and many people don’t feel comfortable going back to the way things used to be. PyVID-19 aims to help users through this transition, by evaluating their COVID-19 risk and giving them tips to stay safe.
What it does
The user inputs their health region (in Ontario) and some of their personal information such as age, BMI, and preexisting health conditions. Based on this data, PyVID outputs relevant statistics which tell the user their risk level for COVID-19 in this new restriction-free era. PyVID also displays graphs on the number of recent cases and the death rate in Ontario and offers some guidelines on how to stay safe.
How we built it
We first did some research on similar products available and ways we can improve upon these models. The first method of improvement was to create a single metric using both area statistics and personal data. We used a "COVID age" formula developed by researchers at Alma.org.uk and created our own algorithm to compute area risk from data taken from publichealthontario.ca. We researched some lightweight, easily deployable UI tools and settled on Gradio, a Python library. We utilized Gradio to create an easy-to-use and comprehensive website that runs smoothly and reliably. To give the user more insight, we used Panda dataframes and Seaborn plots to create relevant line graphs related to COVID-19 in Ontario.
Challenges we ran into
One of the challenges was simply finding the right tools to create PyVID, especially as beginner programmers. However, we eventually managed to find Gradio which allowed us to program completely in Python, a language we were already familiar with, without having to learn JavaScript and frontend frameworks. Another challenge was time management. As a two person team, we found managing the project under such tight time constraints very challenging, especially since we have a lot of school work and other extracurricular activities. However, we were able to work together to come up with a schedule that worked for both of us while also fitting in our other extracurriculars and school work.
Accomplishments that we're proud of
This is our first hackathon and we are proud of finishing our ambitious project within the allocated time. We learned a lot about programming, collaboration, technical communication, and project management. This is our first coding project and hackathon at this scope and we enjoyed this experience and plan to participate in many more.
What we learned
We learned many technical and soft skills in this hackathon. We brushed up on the basics of Python syntax and learned about functions, dataframes, plots and web development. This hackathon improved our confidence in turning ideas into tangible products that can be deployed in the real world. On top of this, we strengthened our teamwork and communication skills which will be useful for a wide variety of projects in many different fields.
What's next for PyVID-19
Due to PyVID-19's scalable design, it will be easy to expand further into different provinces and even different countries, as long as data is available. We could also make PyVID cross-platform and create a mobile application to further expand our target audience and make PyVID more accessible. Finally, we could add some more features such as locating nearby vaccination and COVID-testing sites to aid in the global recovery from COVID-19.


Log in or sign up for Devpost to join the conversation.