-
-
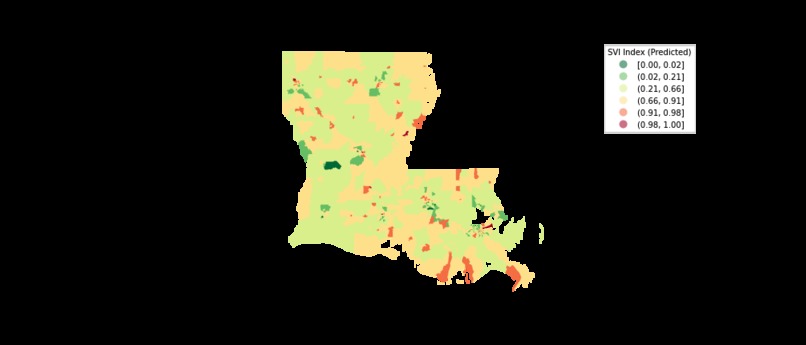
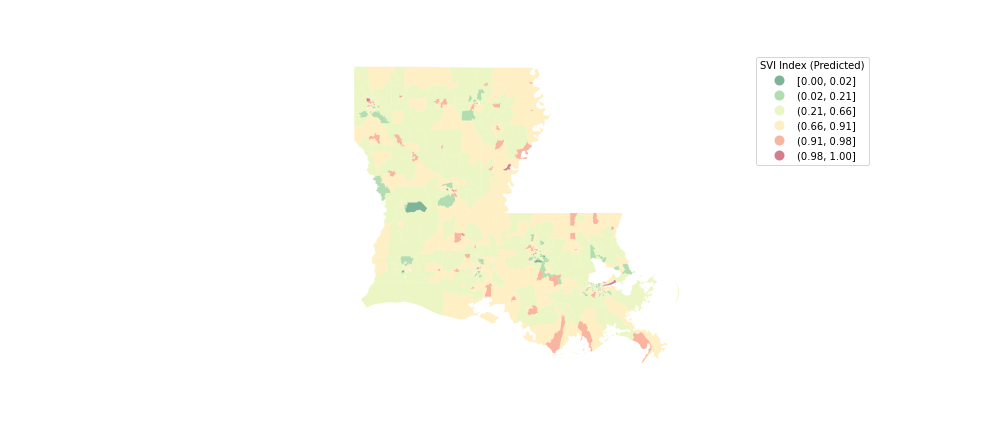
Louisiana Regular SVI
-
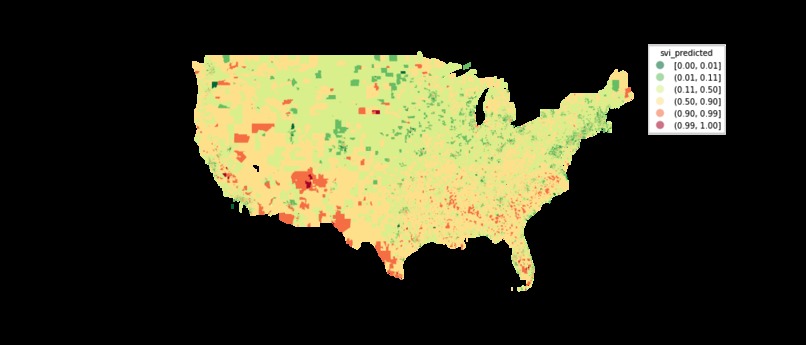
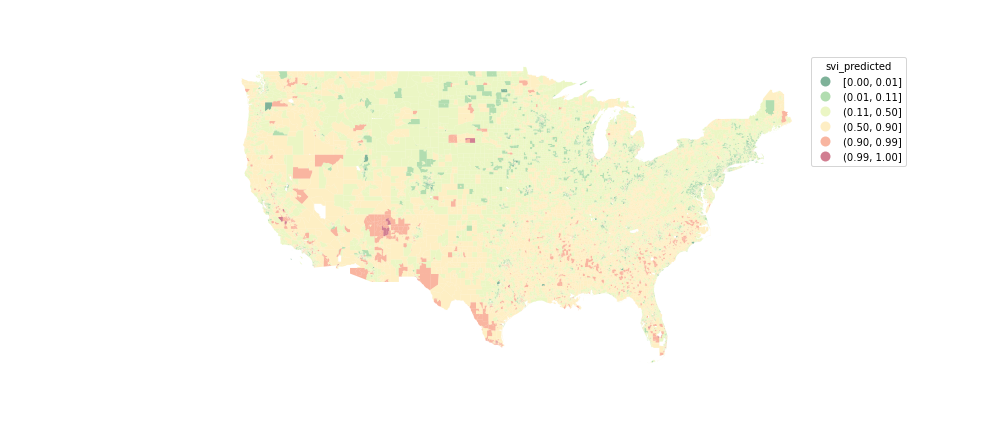
US SVI
-
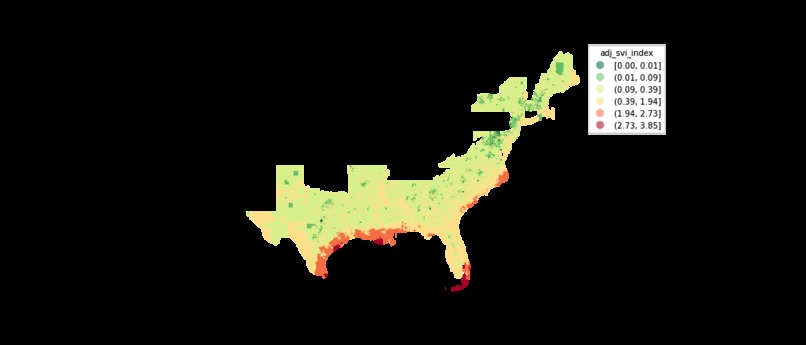
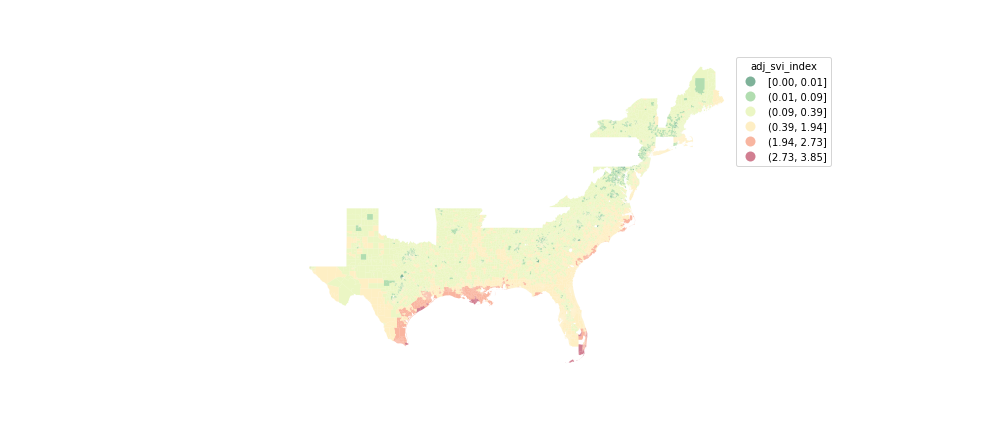
Atlantic and Gulf Coast Adjusted SVI
-
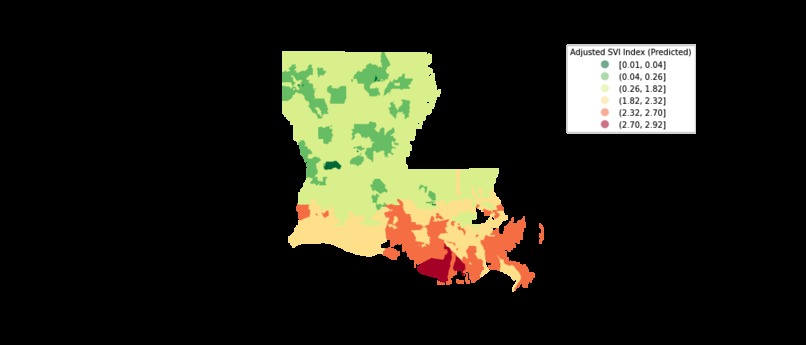
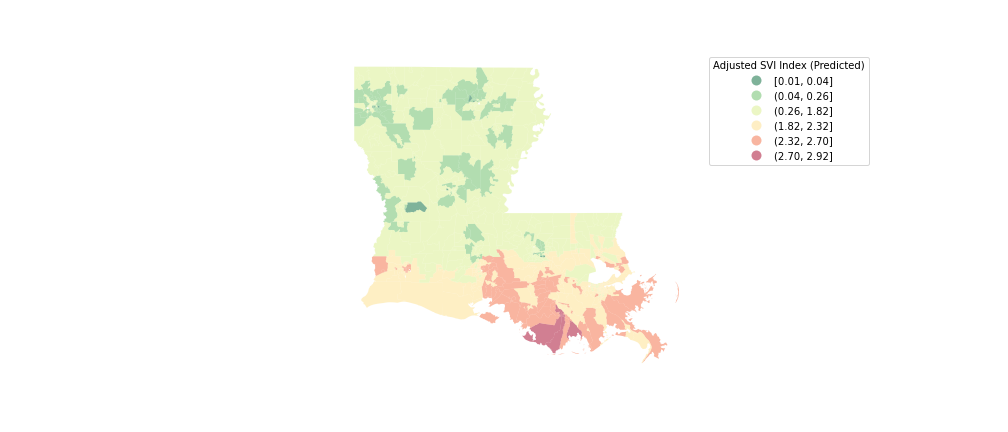
Louisiana Adjusted SVI
Inspiration
The inspiration for this project stems from the growing prevalence of severe weather events as a result of climate change, particularly hurricanes. Adjusting the CDC's Social Vulnerability Index to account for particular natural disasters can help determine where resources should be prepared and delivered prior to natural disasters.
What it does
Our model consists of two main components; a model we built for SVI and another we built called "Hurricane Risk Index." While SVI is a good indicator for which communities are generally at higher risks when exposed to catastrophe, our model goes a step further by revealing which communities are also at higher risks of hurricane impacts. Our model allows the user to receive the Adjusted SVI value (0-1) for any community in the US by simply typing in the corresponding FIPS code.
How we built it
First, we cleaned the data, removed some variables that were provided by the CDC, added interaction terms, and cross validated to create an accurate predictive model to estimate the SVI of every FIPS code. We did this since there was no formula supplied by the CDC. To create our Hurricane Risk Index, we integrated multiple datasets found online from sources such as the NOAA. After some parameter tuning, we normalized the variables to generate a value from 0-1 that determines a community's Hurricane Risk Index, 0 being no risk and 1 being the highest risk. Some of the variables included elevation, frequency of hurricanes over the past few decades, and the financial cost resulting from the hurricanes. Finally, we integrated the our own Hurricane Risk Index and the SVI to get our hurricane-adjusted SVI model.
Challenges we ran into
The main problem we ran into was finding the proper datasets to create our Hurricane Risk Index. Constructing a meaningful model for the index and determining which variables would be most significant was also a challenge. But overall, the most difficult challenge we ran into was the time constraint for this hackathon.
Accomplishments that we're proud of
The before/after pictures of Louisiana is something we were very proud of. The before shows the SVI of Louisiana communities while the after shows Louisiana with our hurricane-adjusted SVI. It is clear from the images that our adjusted SVI works given how much brighter the coast is.
What we learned
We learned a lot about preprocessing data before integrating it into a model. Our first attempt at making the hurricane index yielded a completely meaningless, horribly skewed curve. After we preprocessed some of the inputs and normalized our columns, we had a much better distribution.
What's next for Adjusted SVI for Determining True at-Risk Communities
This model only accounts for hurricanes, but the bigger idea is that our model can be used to account for any other disaster including tornado outbreaks, wild fires, disease outbreaks, and more. It can yield a much more powerful indicator of which communities are truly at risk to disasters.


Log in or sign up for Devpost to join the conversation.