-
-
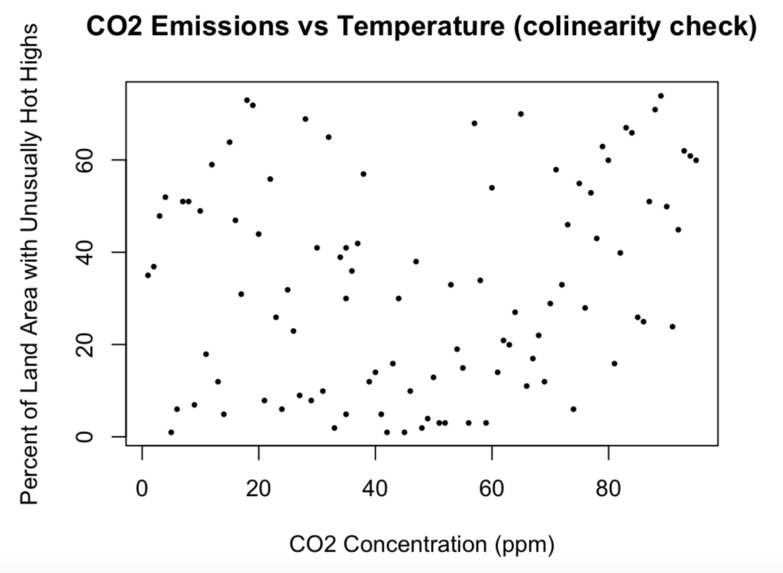
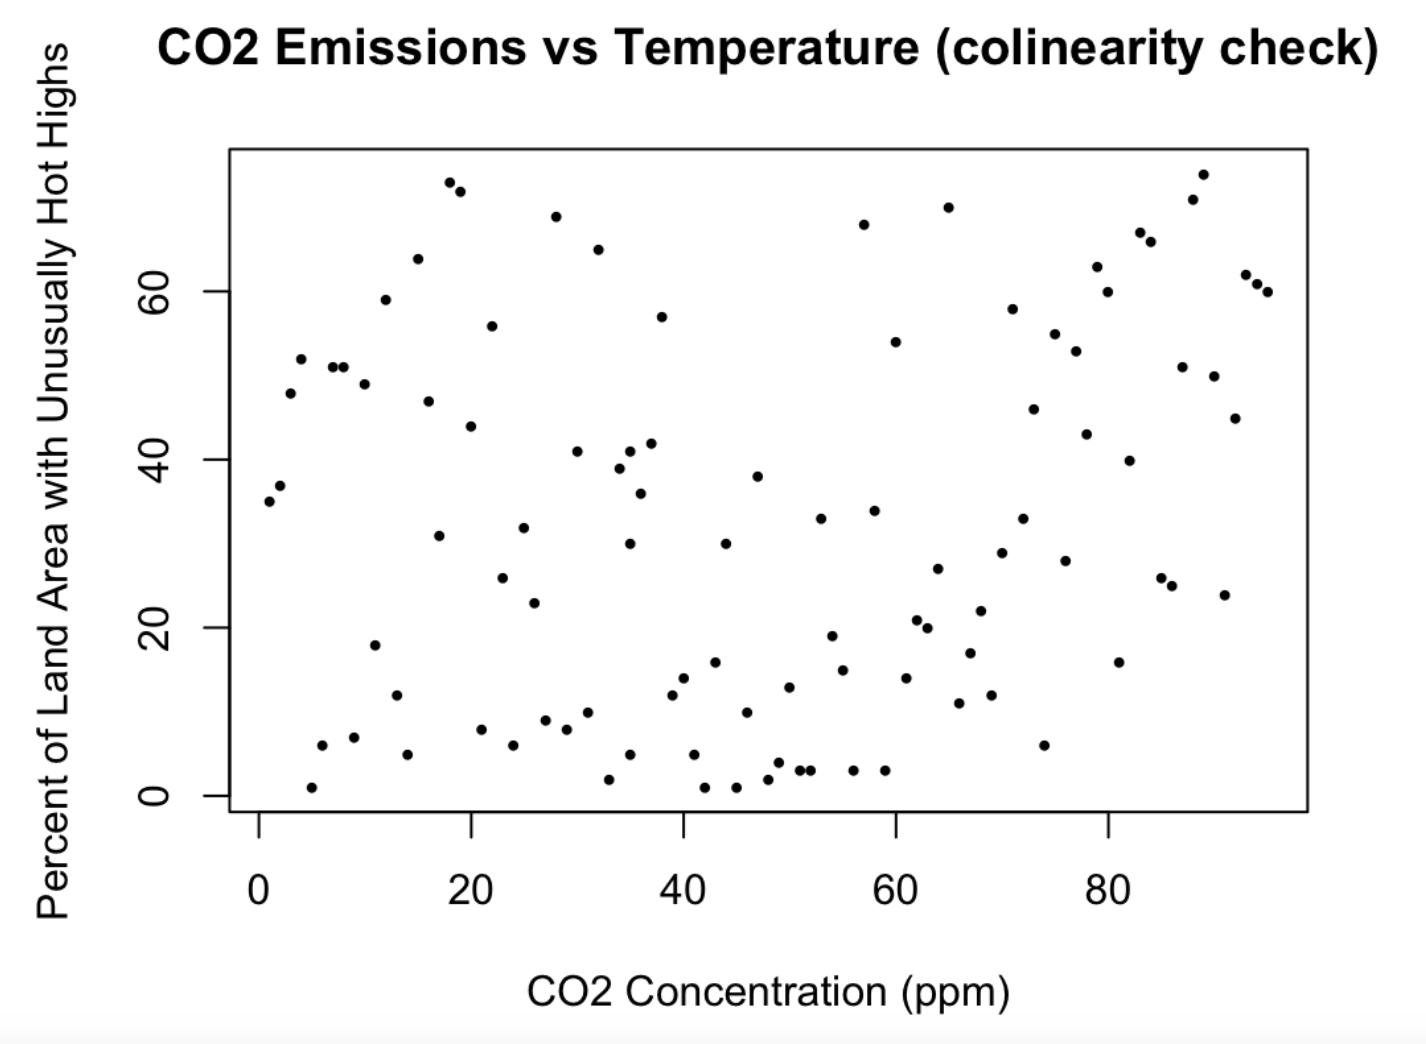
Multicollinearity Check
-
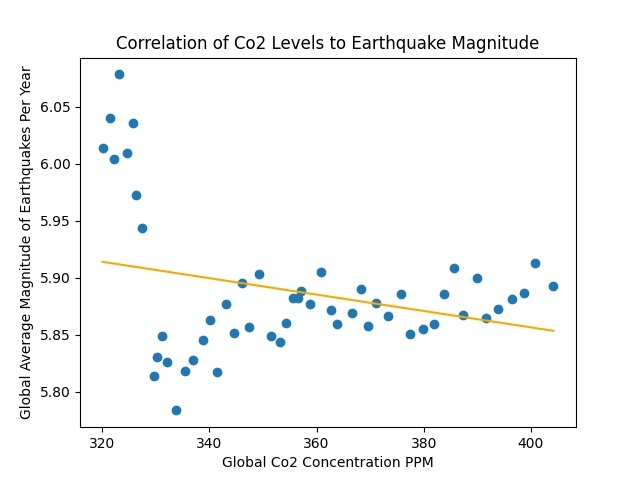
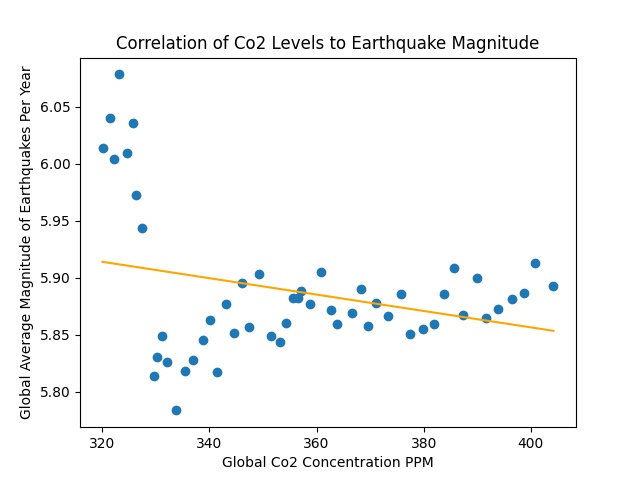
Correlation of CO2 Levels to Earthquake Magnitude
-
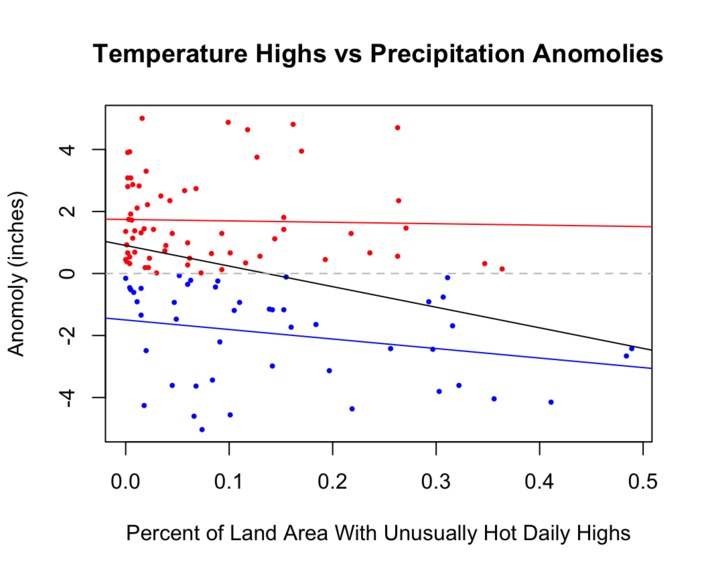
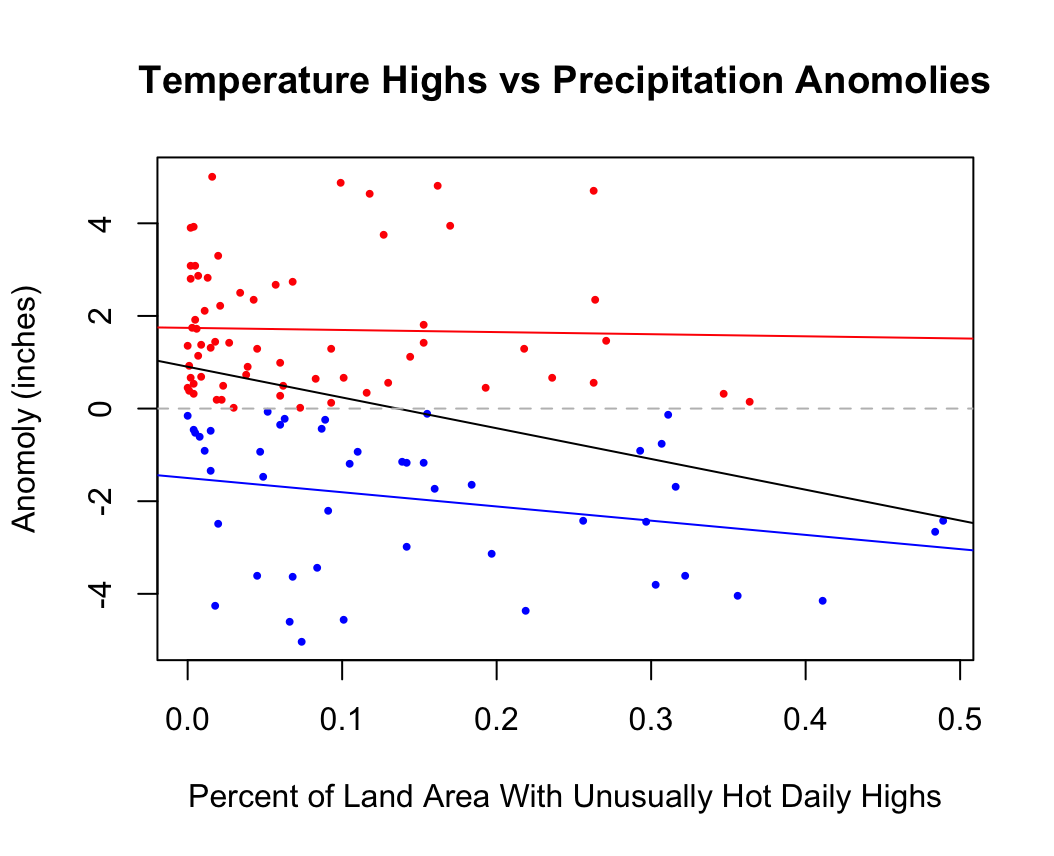
Correlation of Unusually Hot Temperature Highs and Precipitation Anomolies
-
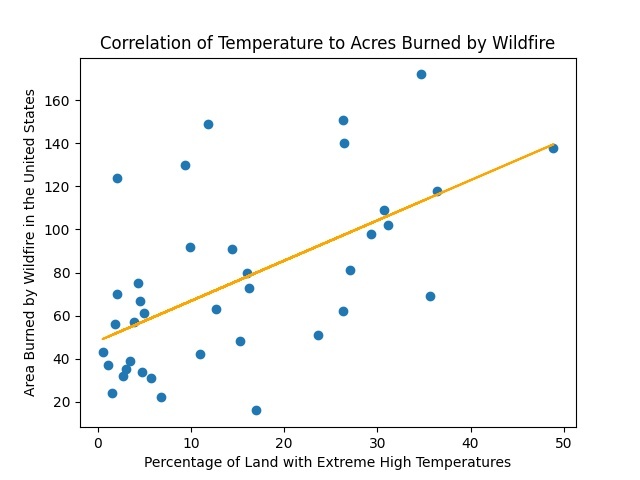
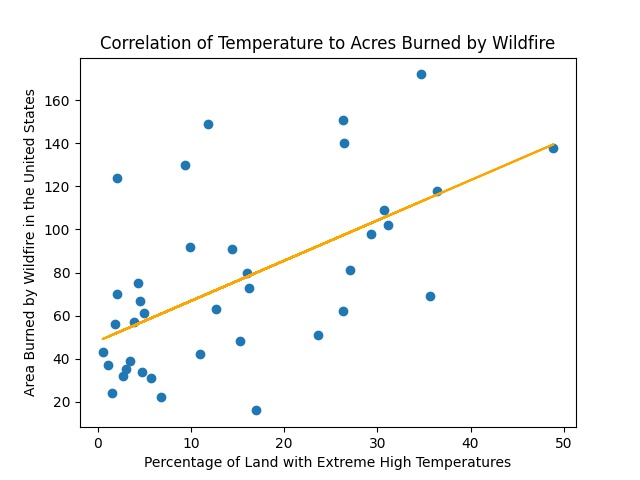
Correlation of Temperature to Acres Burned per Wildfire
Inspiration
In November of 2021, British Columbia, Canada experienced a series of unexpected floods. 17,000 people were forced to evacuate, Vancouver was cut off from the mainland, and thousands of students were forced to leave school. As high school students ourselves, the proximity and effects of this disaster made us wonder. The effects of climate change for most people may be just summertimes that are a little hotter, gasoline cars that are a little more expensive, or straws that are paper instead of plastic. But if we can prove that the rate and severity of serious natural disasters increase with the rising global temperatures and CO2 emissions, people of all backgrounds (including children or students like ourselves) will be more invested in the efforts of environmental protection and saving our planet.
What it does
Essentially, we are taking in .csv files, filtering, analyzing and displaying data. After that we compare the "controlled" to the "responding" variables and see which pairs have more of a correlation and more related.
How we built it
The first layer of basic dataset selection, filtering and graphical representation included initial data cleaning to take out unusable data points and adjust datasets to our needs. Then, we used libraries or modules to visualize this data in graphs. In the second layer of programming, we analyzed different sources of data together and compared their correlation and relevancy with each other. From there, we constructed a correlation comparison to see which pairs are the most strongly tied and visualized them again. We used built-in functions of R (Least Square Regression Line, Pearson’s Product-Moment, R-squared) and libraries in Python (Matplotlib.pyplot, Pandas).
Challenges we ran into
Initially our main challenge was how we simply could not find enough useful, reputable and compatible resources. Most of the information we could find were limited to within the US, which constrained the area of our approach. Our analysis does take into the consideration of how most of our data is US based. Most of our confusion can apply globally, but more accuracy resources from other countries and regions would have improved the accuracy.
What we learned
We learned that climate change, specifically increase in global temperature and Co2 emissions does increase the frequency and intensity of natural disasters, more specifically wildfires and heavy precipitation. If we consider the British Columbia flooding again, the vegetation that was originally holding the terrain together was getting destroyed because of the increasing number of wildfires this summer. This caused a greater unstableness in the landscape, which collapsed after heavy rainfalls, causing the massive flooding and landslides.
What's next?
To take our project a step forward, it could be very useful to write code with predictive features using tools such as regression lines or confidence intervals in order to anticipate the magnitude or frequency of future natural disasters. This could be important in order to foresee the real-life impacts that certain levels of CO2 or temperature could have—not only to predict what will happen in the future, but also to envisage what would happen if we reach the goal for maximum CO2 emissions set by the UN.
Social Media
Instagram: https://www.instagram.com/p/CXNOUpjl9Ni/ Youtube: https://www.youtube.com/watch?v=FM5zVuBCl6I Scratch: https://scratch.mit.edu/projects/613220730/ Little Red Book:http://xhslink.com/79413e


Log in or sign up for Devpost to join the conversation.