-
-
for the youtube video the actual link is in the title
-
-

Inspiration
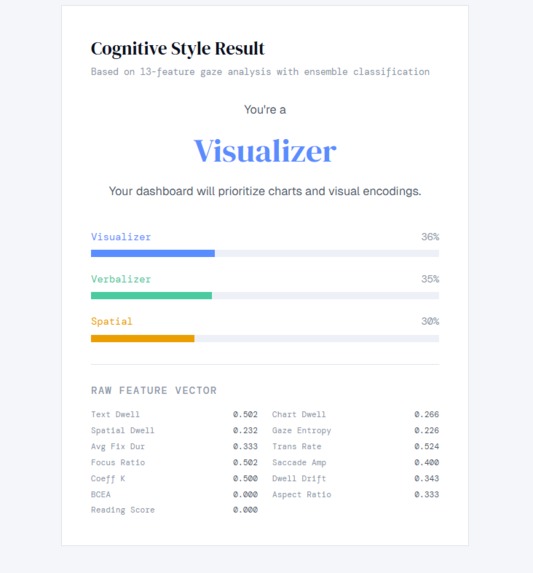
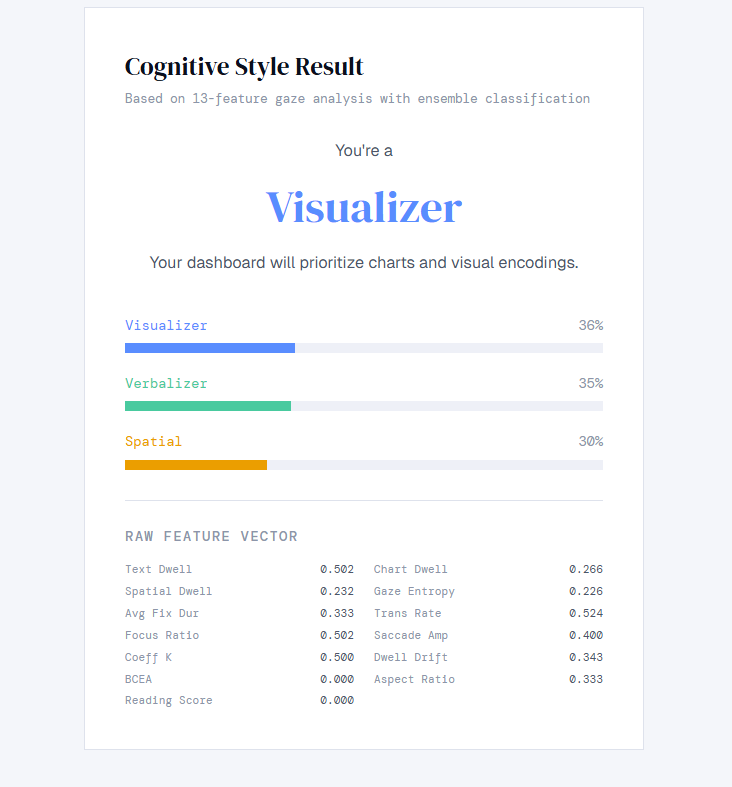
Data visualization is simply another form of communication, a language if you will. For too long it has been treated as a one-size-fits-all model. What I learned is that, just like verbal communication, people have preferences in visual communication and the eyes tell the whole story. You can track someone's focus through:
- blink rate
- pupil dilation
- saccade velocity
- head movement If you could track what they care about, you could learn their visual preferences and tailor the data to each person. Additionally from the presenter's side there is no true way to tell what people have reviewed or seen. This is critical in the clinical research process; if data is missed, lives are at stake. AdaptiView follows your focus and delivers visual metrics to make sure you see every important detail, eliminating miscommunication through data and continually improving over time. ## What it does AdaptiView is the first clinical data review platform that tracks where a reviewer's eyes actually go during a monitoring session. Using only a standard webcam, it maps gaze patterns across adverse event tables, lab values, and vital sign dashboards in real time. When a high severity item receives insufficient attention, AdaptiView flags it before the reviewer moves on. At the end of every session it generates an attention audit trail alongside the standard audit trail for the first time a clinical research organization can answer the question every FDA inspector eventually asks: not just "was the data there" but "did your team actually see it?"
Beyond compliance, AdaptiView learns over time. It builds individual reviewer attention profiles, identifying consistent blind spots, tracking whether review quality improves over time with experience, and adapting the data presentation to match how each person actually processes visual information.
How we built it
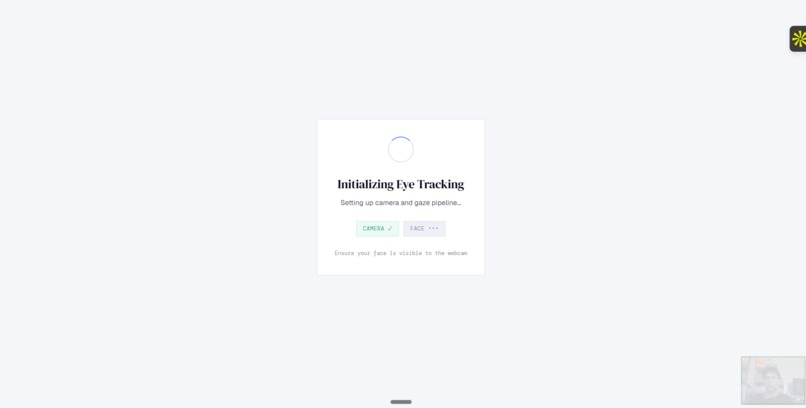
AdaptiView runs entirely in the browser using webgazer.js, which uses tensorflow.js to detect 468 facial landmarks from a standard webcam in real time. It isolates iris position on every frame and maps it to screen coordinates through a regression model personalized to each reviewer during a 30-second calibration.
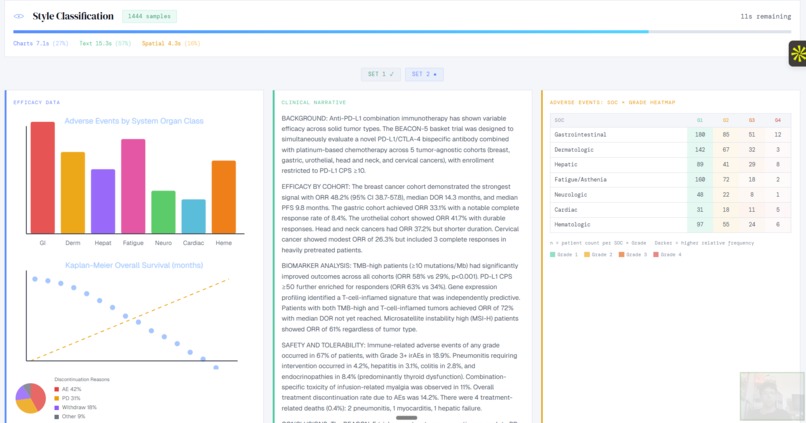
On top of the gaze stream we built an attention engine that maps every coordinate to the DOM in real time, identifying which patient record Adverse Event row the reviewer's eyes are over at any given moment. We accumulate fixation time per row and compare it against CTC-AE severity thresholds (grade 3, 4, and 5 adverse events must meet a minimum fixation threshold to count as reviewed). If a CRA's gaze passes over a critical row without meeting it (which is exactly what happens when someone scrolls instead of reads), the system flags it instantly.
Scan Path Analysis distinguishes genuine reading from passive scrolling. Accumulated gaze coordinates across a session render the attention heat map. All this runs client-side: no video, no raw gaze data, nothing leaves the browser; only the aggregated attention metrics that compose the audit trail are stored.
We intentionally designed the UI layout around the accuracy constraints of webcam-based tracking:
- larger row heights
- visual separation between severity tiers
- group data sections so that the measurement is scientifically defensible not just visually interesting ## Challenges we ran into Webcam eye-tracking accuracy is a central engineering tension in this project. WebGazer operates at roughly 4° of visual angle, which is enough to track a row level but not enough to go down to a single pixel. We had to design the entire interface and our regulatory claims around the constraint rather than ignoring it. Every layout decision was an accuracy decision so it took a lot of time to refine the logic of the webcam and how it tracked user preferences. We reviewed it with 20 people to test to make sure it was actually getting their visual preferences and each of them designed a unique layout for the person.
The second challenge is framing an eye-tracking system in a workplace can feel like surveillance. We had to think carefully about positioning and AdaptiView as more of a training and safety tool as opposed to a monitoring tool. That distinction matters legally, ethically, and for use or adoption.
Accomplishments that we're proud of
I'm incredibly proud of the layout connection and how it actually views visual profiles, understands what you care about and where your focus is, and adapts the dashboard to do so. This is the first clinical data review interface that integrates attention tracking directly into the regulatory workflow not as a bolt-on analytics later but as the core product mechanism. The attention audit trail we generate is a novel regulatory artifact and is a risk-based monitoring platform on the market. We also designed a scientifically grounded approach to a genuinely hard measurement problem. We did this without requiring any special hardware, just a natural computer webcam that could be easily adopted for anyone in the CRO process.
What we learned
We came in thinking we were solving a UX problem. We left knowing that it's a documentation problem for patient safety consequences. That reframe changed the decisions and on the technical side we learned fast that webcam eye tracking accuracy isn't just a performance metric; it's a legal boundary. Every claim of AdaptiView makes downstream is only as honest as the sensing layer underneath. Designed the UI around accuracy constraints rather than ignoring them. Larger rows, visual separation between severity layers and group data sections, taught us that the layout itself is part of the measurement system.
I also learned about how the eyes can track what is happening behind the brain and seeing how people focus and also I learned a little about the regulation around CROs and how implementation details you can't abstract away. The product getting the domain depth to write in a hackathon time frame pushed us harder than any technical challenge I have done so far.
What's next for AdaptiView
The immediate add on is replacing the Webgazer.js tracking with more professional, enterprise-grade security. This will allow us to refine the viewership of people tracking and actually understand focus a little better. There are a few more metrics we can add on, like:
- pupil dilation
- saccade pattern recognition
- gaze trajectory
- also scroll behavior to a single probabilistic attention confidence score that's far more defensible than our single standalone score. Additionally we would have to add the immediate metadata Rave API integration and get the actual software and data connected, in addition to refining our chart and data visualization metrics. On the regulatory side we are pursuing 21 CFR part 11 compliance validation and building infrastructure for a formatted regulator-auditor-friendly pack and attention report format that is specifically for FDA inspection packages. The long-term mode is to set the data from every session we run, train it, and build it for clinical data review. The more CROs use AdaptiView the better we understand what genuine review looks like and what a missing critical safety signal looks like. That's a network effect that competitors will not be able to replicate easily.
Built With
- claude
- css3
- html5
- javascript
- tensorflow.js
- vercel
- webgazer.js

Log in or sign up for Devpost to join the conversation.