Adalytics — Stop The Waste.
Creative intelligence for mobile advertisers. Stop wasting budget on ads that stopped working.
Inspiration
Every day, mobile advertisers are making expensive decisions in the dark.
You're running hundreds of ads across dozens of campaigns. Some are working. Some are bleeding budget. Most sit somewhere in between — quietly underperforming while you're too buried in spreadsheets to notice. By the time you realise an ad has stopped working, you've already wasted weeks of spend on something audiences have long since tuned out.
We'd seen this problem framed as a data challenge. But sitting with the Smadex dataset for the first time, we realised it was actually a communication challenge. The data wasn't missing — it was there, all 192,000 rows of it. What was missing was a way to read it that didn't require a data scientist and three hours of Python. Creative Directors can't act on a CSV. Media buyers can't explain a CTR decay curve to a brand team.
We built Adalytics to close that gap. Not just another dashboard — a system that reads the visual DNA of every ad, connects it to performance, and speaks in plain language to the people who need to make the call.
What It Does
Pick a company. Pick a campaign. Instantly understand what's happening to your creative.
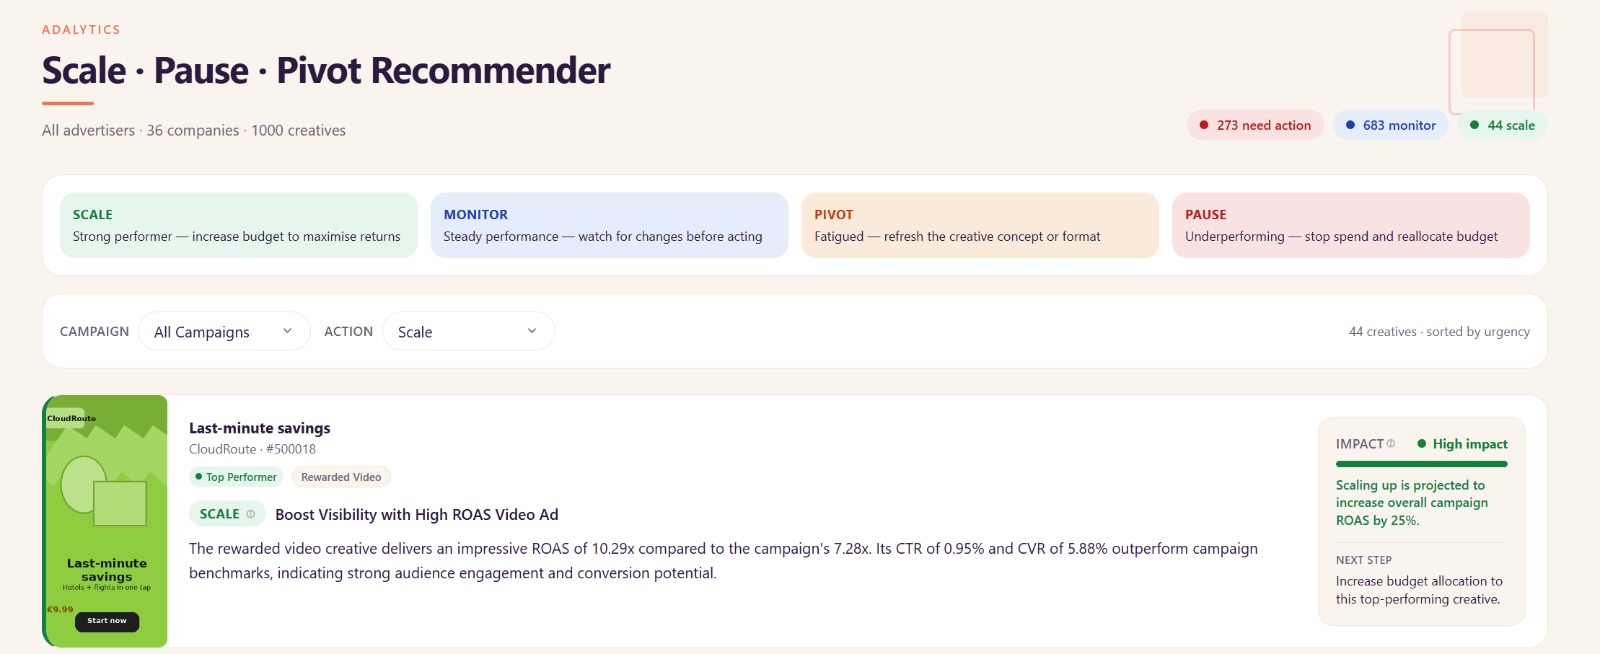
Every ad in Adalytics gets:
- A performance score — a single composite number derived from CTR, CVR, ROAS, and spend efficiency, normalised per KPI goal so campaigns are always compared fairly
- A status —
TOP PERFORMER,STABLE,FATIGUING, orUNDERPERFORMER - An AI-generated visual analysis — GPT-4o reads the actual creative image and explains why it's working: Is it the motion? The faces? The discount badge? The emotional tone?
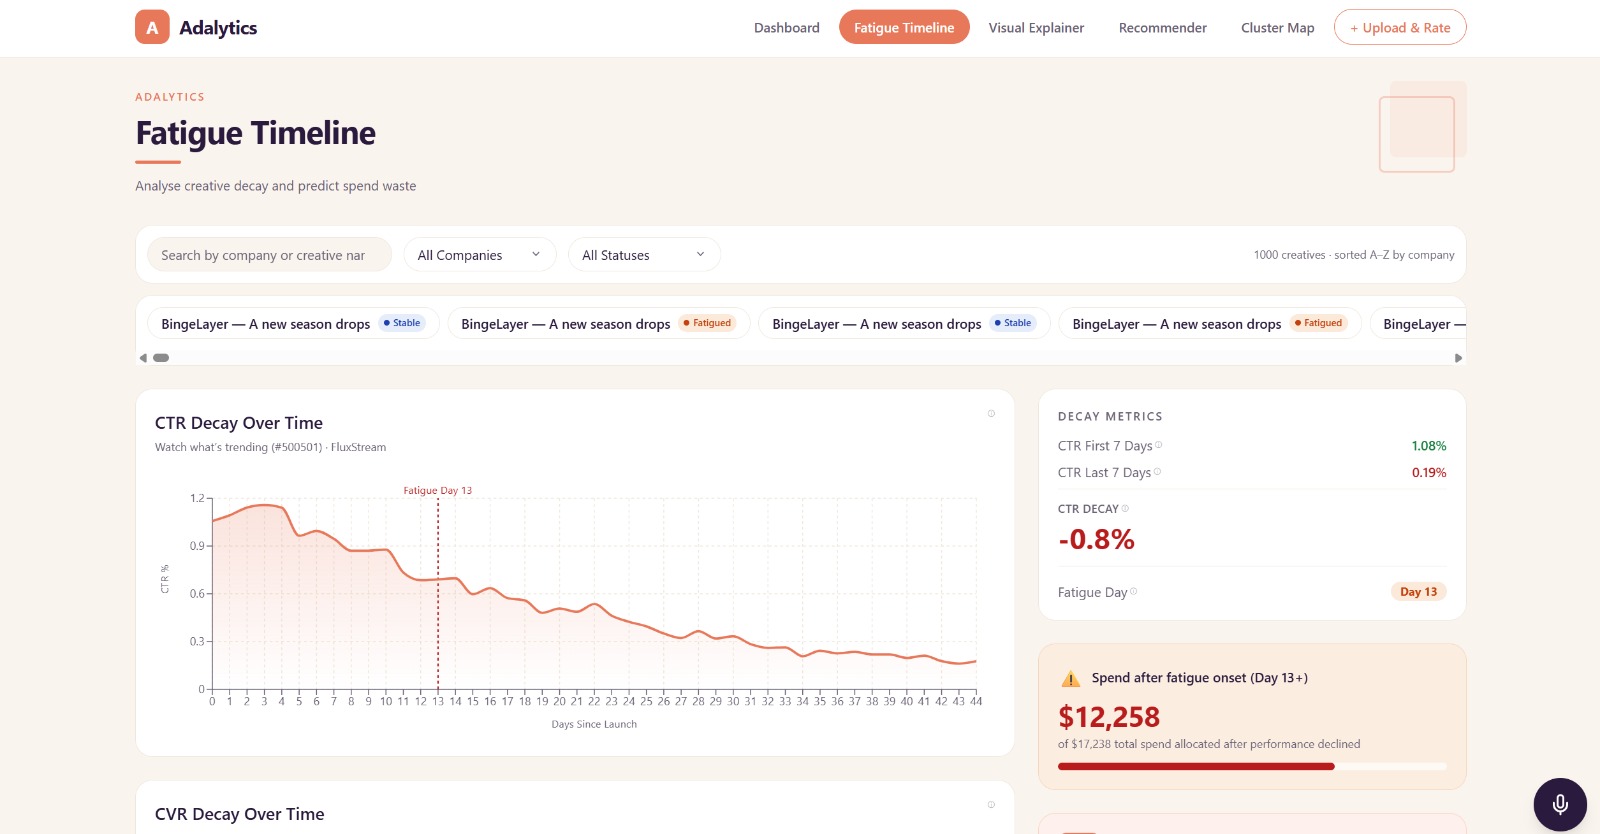
- A fatigue timeline — day-by-day CTR and CVR trends from launch to today, with the exact moment an ad starts falling off marked and quantified
- A concrete recommendation — Scale, Monitor, Pivot, or Pause — with reasoning and estimated spend saved
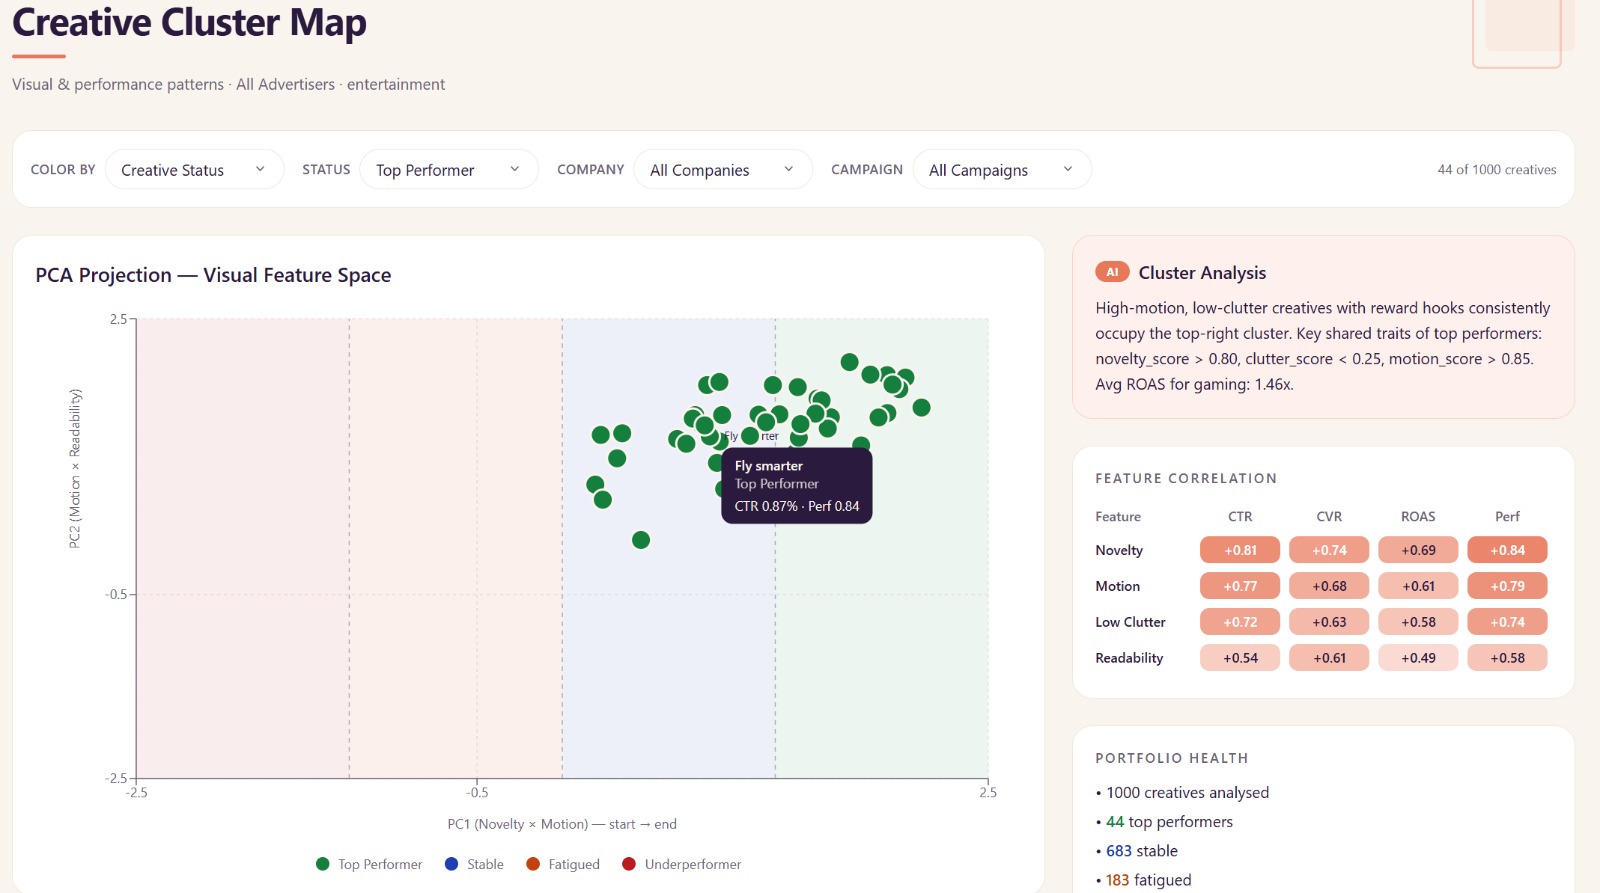
Beyond individual creatives, the Cluster Map runs a PCA on six visual feature scores across all 1,080 creatives and plots them in 2D. Click a cluster and GPT-4o labels it: "High-motion, low-clutter gaming creatives — 72% are top performers." That's the intelligence that informs your next brief.
And if you'd rather just ask? Jordi, our ElevenLabs voice AI advisor, has real-time access to the full dataset. Ask out loud: "Which creatives are fatiguing the fastest?" and get an answer in seconds.
How We Built It
The Stack
| Layer | Technology |
|---|---|
| Frontend | React 19 + Vite + TailwindCSS v4 + TanStack Router |
| Database | Supabase (PostgreSQL) |
| Asset Storage | Supabase Storage (1,080 PNG creatives) |
| AI — Vision + Text | OpenAI GPT-4o via Supabase Edge Functions |
| AI — Voice | ElevenLabs Conversational AI |
| Data Pipeline | Node.js + csv-parse → Supabase service role |
| Deployment | Vercel |
The Data Pipeline
The dataset arrived as six CSVs totalling ~192,000 rows and 1,080 PNG assets. We wrote a Node.js import script to ingest everything into Supabase PostgreSQL over the service role API, then uploaded all assets to a public Supabase Storage bucket. The join structure is clean:
$$ \text{advertisers} \xrightarrow{\text{advertiser_id}} \text{campaigns} \xrightarrow{\text{campaign_id}} \text{creatives} \xrightarrow{\text{creative_id}} \text{creative_daily_stats} $$
The Performance Score
Each campaign optimises for a different KPI — CPA, ROAS, IPM, or CTR — so raw cross-campaign comparison is meaningless. We normalise within KPI cohorts using min-max scaling before computing the composite perf_score:
$$ \hat{m}_i = \frac{m_i - \min(m)}{\max(m) - \min(m)} $$
The dataset's pre-engineered perf_score already encodes this logic, so we use it directly as our primary ranking signal rather than recomputing.
Fatigue Detection
The fatigue signal lives in ctr_decay_pct — the relative CTR drop between the first and last 7 days of a creative's life. Fatigued creatives in the dataset consistently show:
$$ \text{ctr_decay_pct} \in [-0.88,\ -0.78] $$
meaning CTR drops 78–88% from early life to end of life. We plot this as a timeline using days_since_launch as the x-axis, with a vertical marker at fatigue_day and a shaded region showing post-fatigue wasted spend.
The AI Layer
GPT-4o Vision runs server-side inside a Supabase Edge Function — the API key never touches the browser. Results are cached in a creative_ai_cache table (keyed by creative_id) so the same creative is never analysed twice. The prompt instructs the model to return structured JSON:
{
  "visual_summary": "...",
  "why_it_works_or_fails": "...",
  "key_signals": ["...", "..."],
  "fatigue_risk": "low | medium | high",
  "creative_grade": "A"
}
This lets us render each field independently in the UI rather than dumping a wall of text.
View-Through Attribution
We built a live attribution layer on top of the dataset using first-party localStorage — no third-party cookies, fully privacy-compliant. On impression, we write to Supabase's impression_log table. On conversion, we look up prior exposure and tag the conversion as view_through or click_through. Supabase Realtime surfaces the live counter in the Dashboard.
Jordi — The Voice Advisor
Jordi is an ElevenLabs Conversational AI agent with six client-side tools that query Supabase directly from the browser. A Supabase Edge Function issues a signed URL per session so the ElevenLabs API key stays server-side. The tools are:
| Tool | What it does |
|---|---|
get_fatigued_creatives |
Top fatiguing creatives by spend |
get_top_performers |
Best creatives by perf score |
get_vertical_summary |
Aggregate metrics by vertical |
get_wasted_spend |
Post-fatigue spend breakdown |
get_creative_recommendation |
AI action card for a specific creative |
get_creatives |
Filtered creative list by status + vertical |
Challenges We Faced
Cross-campaign KPI normalisation. Each campaign targets a different KPI. Comparing a gaming campaign (optimised for IPM) against a fintech campaign (optimised for ROAS) using raw numbers produces garbage rankings. It took longer than expected to build the mental model for when to filter, when to group, and when to normalise.
The AI cache invalidation question. GPT-4o vision calls are expensive and slow (~3–5s per creative). We needed every creative to feel instant on second load without serving stale data forever. We settled on a simple generated_at timestamp and refresh logic — not perfect, but good enough for a hackathon dataset that doesn't change.
Wiring ElevenLabs inside React. The @elevenlabs/react SDK requires useConversation to run inside a ConversationProvider. Our first attempt called the hook at the top level of the component, which crashed silently. The fix — wrapping the outer component in the provider and extracting the inner logic into a child — took an embarrassingly long time to diagnose.
Visual scores as ML features vs UI labels. The six numeric scores (text_density, readability_score, etc.) are powerful ML features but confusing to display raw. A clutter_score of 0.74 means nothing to a creative director. We spent time writing contextual labels and tooltips that translate the numbers into plain language without losing precision.
Supabase Storage + CORS. Getting the 1,080 PNG assets to render in the browser from Supabase Storage required the bucket to be public and the correct CORS policy on the Supabase project. A missing header cost us a full hour of debugging a problem that looked like a React rendering issue.
What We Learned
- Data quality beats model complexity. The dataset's pre-computed visual scores (
novelty_score,clutter_score, etc.) turned out to be more immediately useful than running our own CV model. Clean, well-documented features beat a black box every time. - Voice UI has a much higher activation bar than we expected. Getting Jordi to feel useful rather than gimmicky required careful system prompt design, strict tool descriptions, and making sure the agent always calls a tool before speaking — never invents numbers.
- Server-side AI is non-negotiable for production. Keeping OpenAI and ElevenLabs keys inside Supabase Edge Functions from day one saved us from a security incident later. The architecture cost 30 minutes to set up and protected us for the rest of the hackathon.
- PCA for creative clustering is surprisingly legible. We expected the cluster map to need a lot of hand-holding to interpret. In practice, the six visual scores cluster naturally — gaming creatives with high motion and low clutter form a tight group that's visually obvious on the scatter plot without any labelling.
What's Next
- Real-time fatigue alerts — Supabase Realtime watching
creative_daily_statsfor creatives whose 7-day rolling CTR drops below a configurable threshold, with push notifications to a Slack channel - Variant generator — give GPT-4o the current creative's visual scores and ask it to suggest a new creative brief targeting the opposite fatigue-risk profile
- Actual CV pipeline — replace the synthetic visual scores with a real vision model (CLIP embeddings + custom classifiers) so the system works on any uploaded creative, not just the synthetic dataset
- Advertiser-level benchmarking — vertical-normalised percentile rankings so an advertiser can see not just their own performance but where they sit in the market
Built With
React · Vite · TailwindCSS · TanStack Router · Supabase · PostgreSQL · OpenAI GPT-4o · ElevenLabs · Recharts · Radix UI · TypeScript · Vercel
Built With
- claude
- postgresql
- typescript
- vite

Log in or sign up for Devpost to join the conversation.