-
-
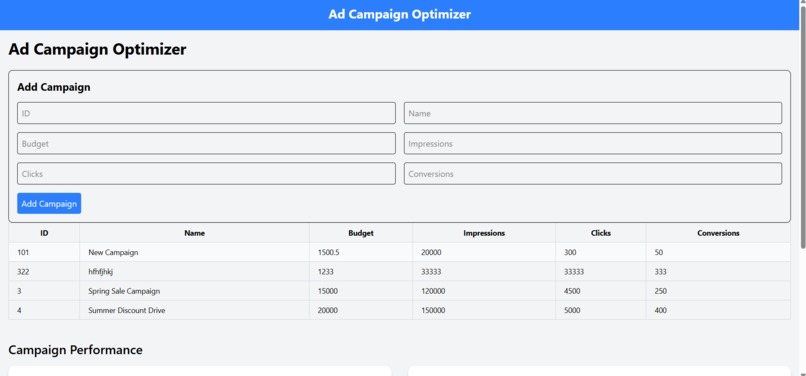
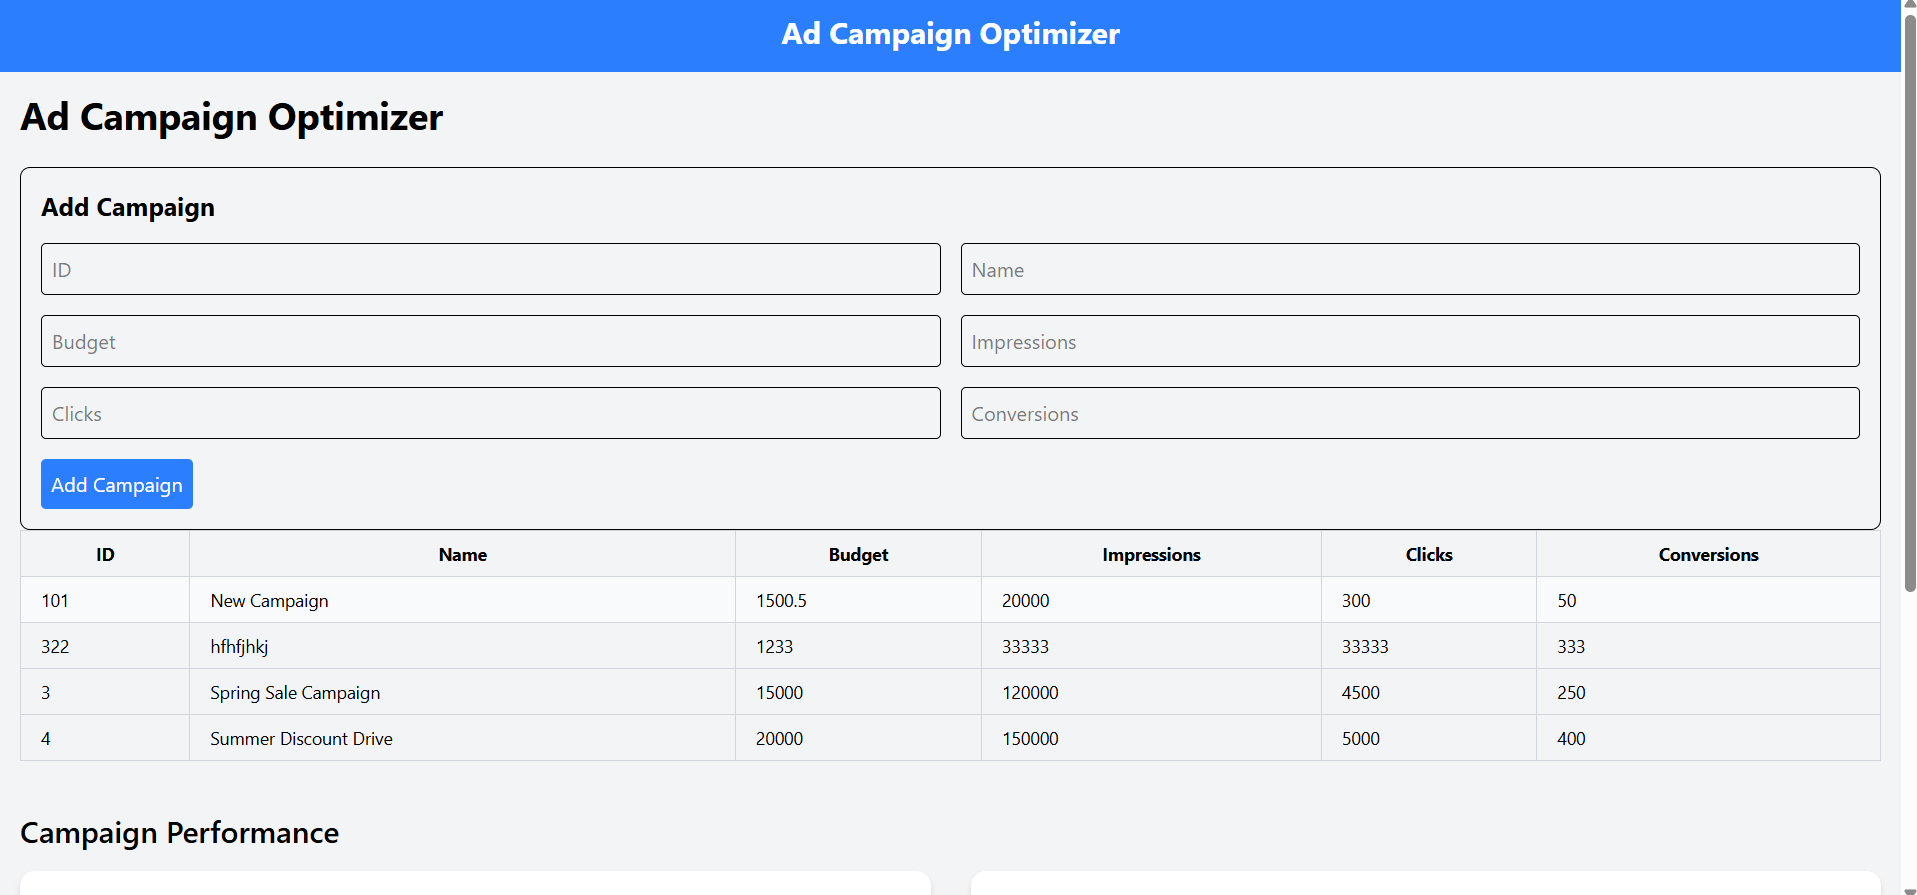
add campaign and table with sorting
-
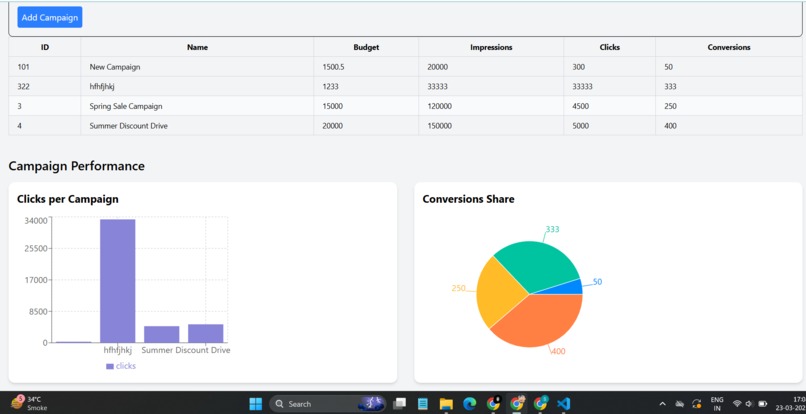
graph for visual representation
-


About the Project: Ad Campaign Optimizer Inspiration In today’s digital world, running successful marketing campaigns is all about understanding and acting on data. But keeping track of metrics like clicks, impressions, and conversions can be complicated without the right tools. This project was inspired by the need to simplify campaign management and make data visualization accessible for marketers, small businesses, and anyone working in digital advertising.
What I Learned This project was a journey of growth and discovery. Here’s what I gained along the way:
Building APIs: I learned how to create and work with RESTful APIs using Flask to manage data effectively.
Front-End Development: Using React and TypeScript, I discovered how to build dynamic, responsive, and user-friendly interfaces.
Data Visualization: With Recharts, I explored how to make data insights more engaging and intuitive.
Error Handling and Debugging: I realized how critical robust error handling is for both user experience and system stability.
How I Built It Backend: I used Flask to create a lightweight server that reads, writes, and manages campaign data stored in a CSV file. It handles API requests to fetch and update campaign details.
Frontend: The user interface was built with React, styled using Tailwind CSS, and written in TypeScript for better code structure and error prevention.
Features:
A table to view campaigns, with sortable columns for quick analysis.
A form to add or edit campaign details.
Interactive charts to visualize performance metrics like clicks, impressions, and conversions.
Data Handling: The app reads data from a CSV file on the backend and dynamically updates the frontend, ensuring seamless synchronization between the two.
Challenges and How I Solved Them Data Integrity: Working with a CSV file meant ensuring no blank or malformed data entries caused errors. Adding validation and error handling resolved this issue.
Frontend-Backend Sync: Ensuring smooth communication between the backend API and the React frontend required careful debugging of CORS settings and API responses.
Visualizing Data: Designing charts that could handle both small and large datasets dynamically was tricky, but learning the flexibility of Recharts helped me overcome this.
Real-World Edge Cases: I learned to anticipate unexpected inputs from users, which helped me make the app more robust and user-friendly.
Why It Matters This project is more than just a tool for managing ad campaigns; it’s about empowering users to make smarter decisions through clear, actionable insights. It’s a step toward making data work for everyone, whether they’re seasoned marketers or small business owners looking to optimize their efforts

Log in or sign up for Devpost to join the conversation.