-
-

Login, Member Dashboard, or Personalized Watchlist
-

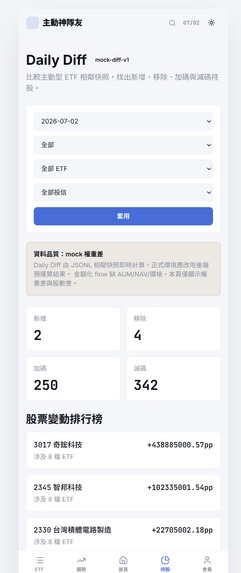
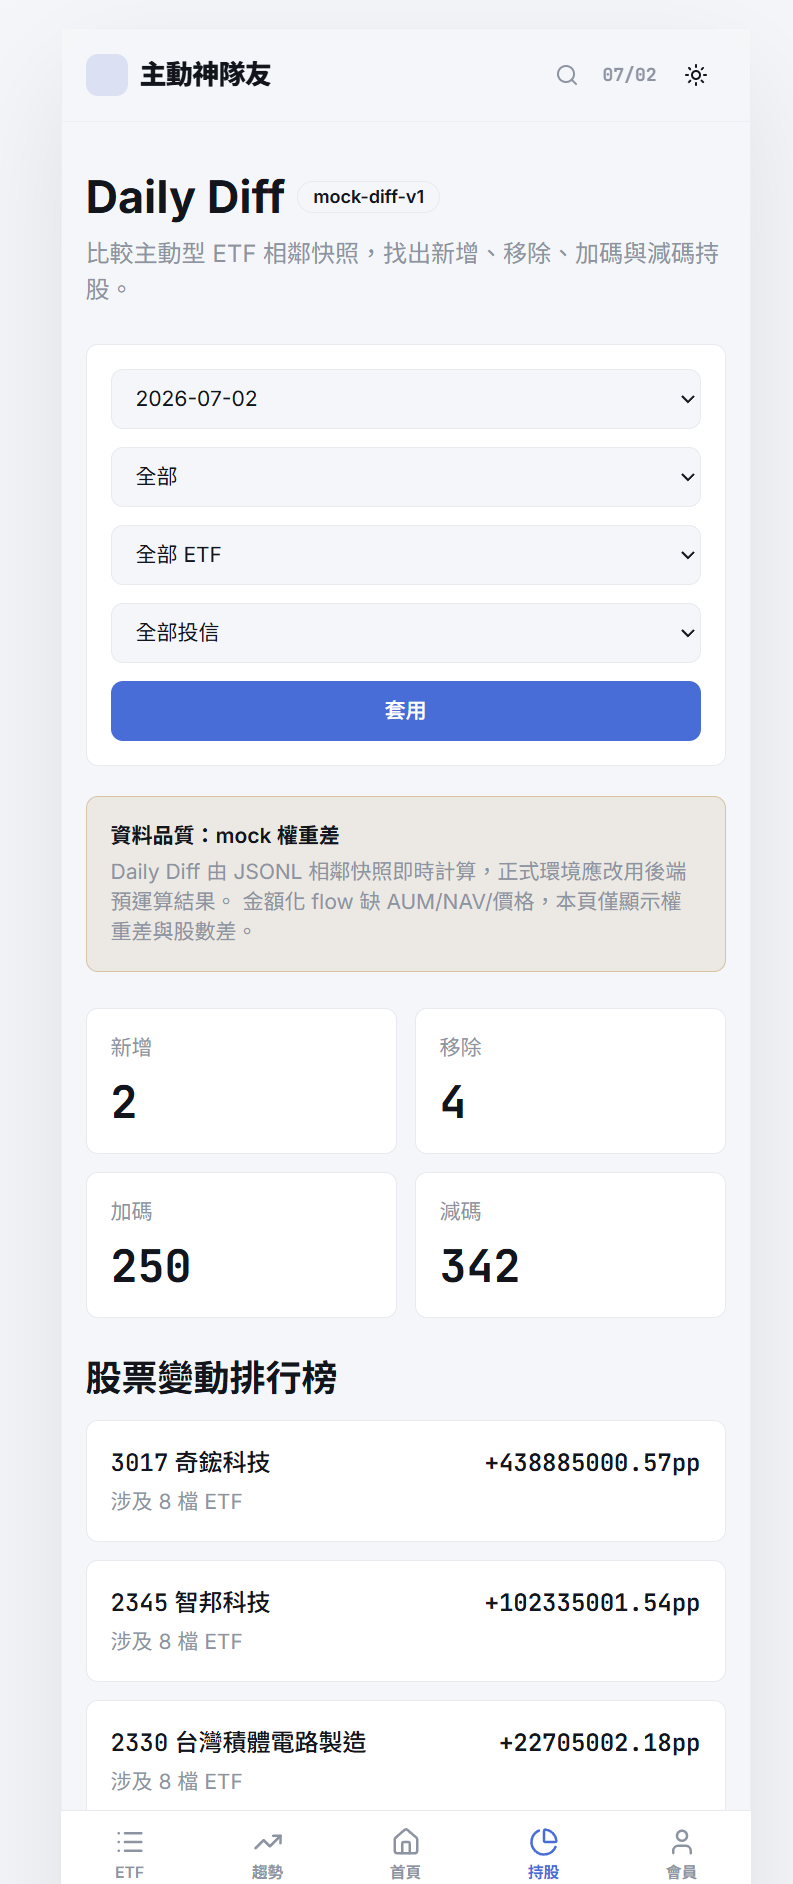
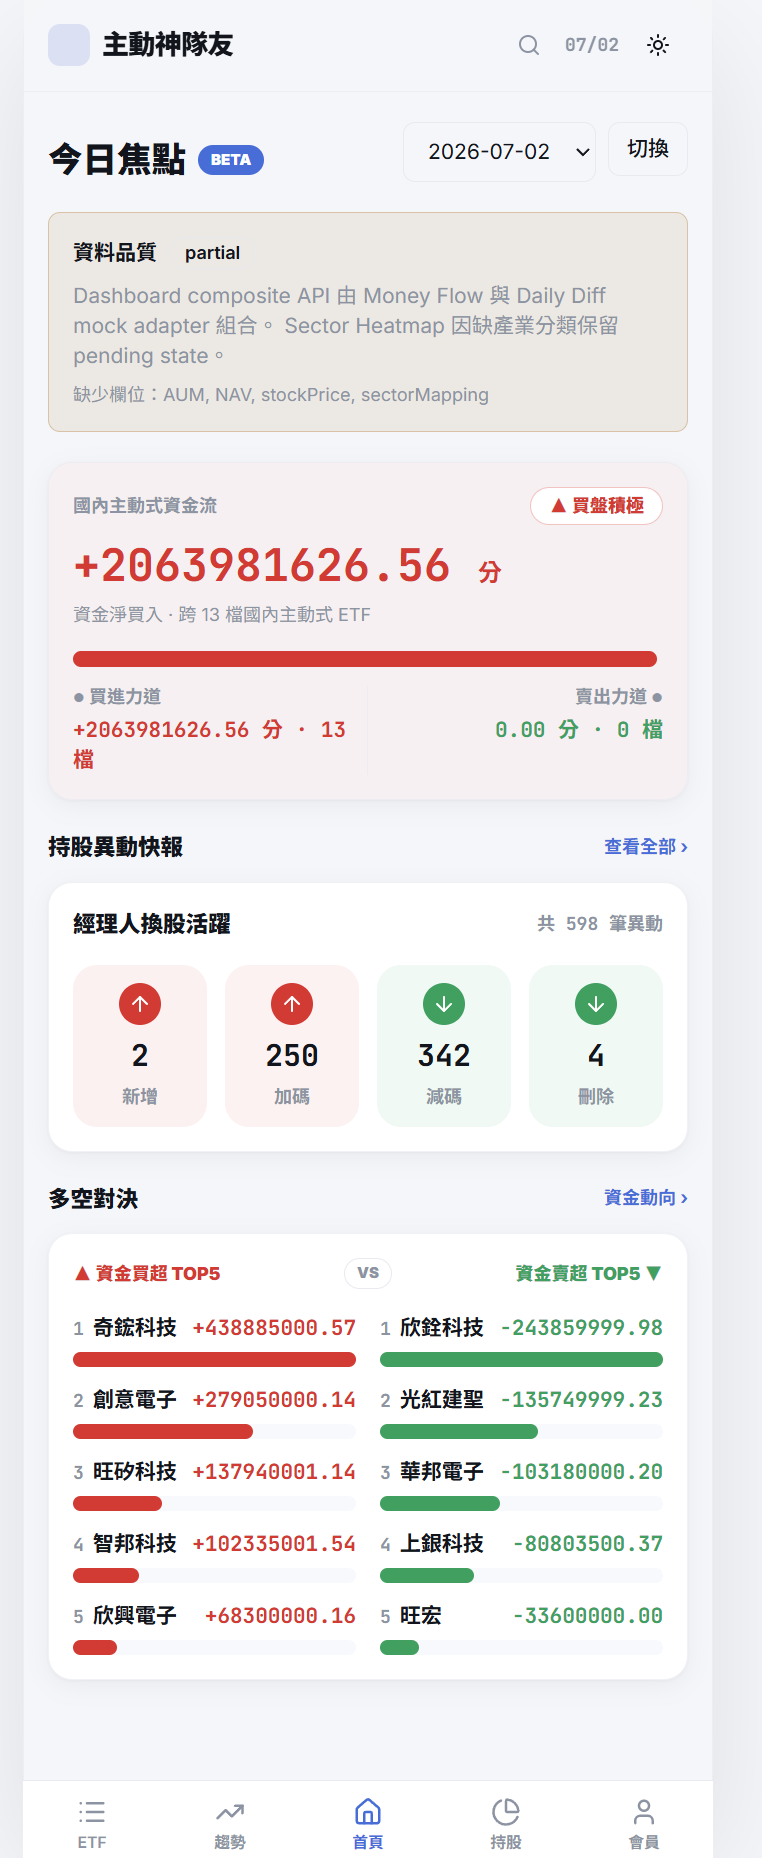
Track which securities fund managers increased or reduced each day.
-

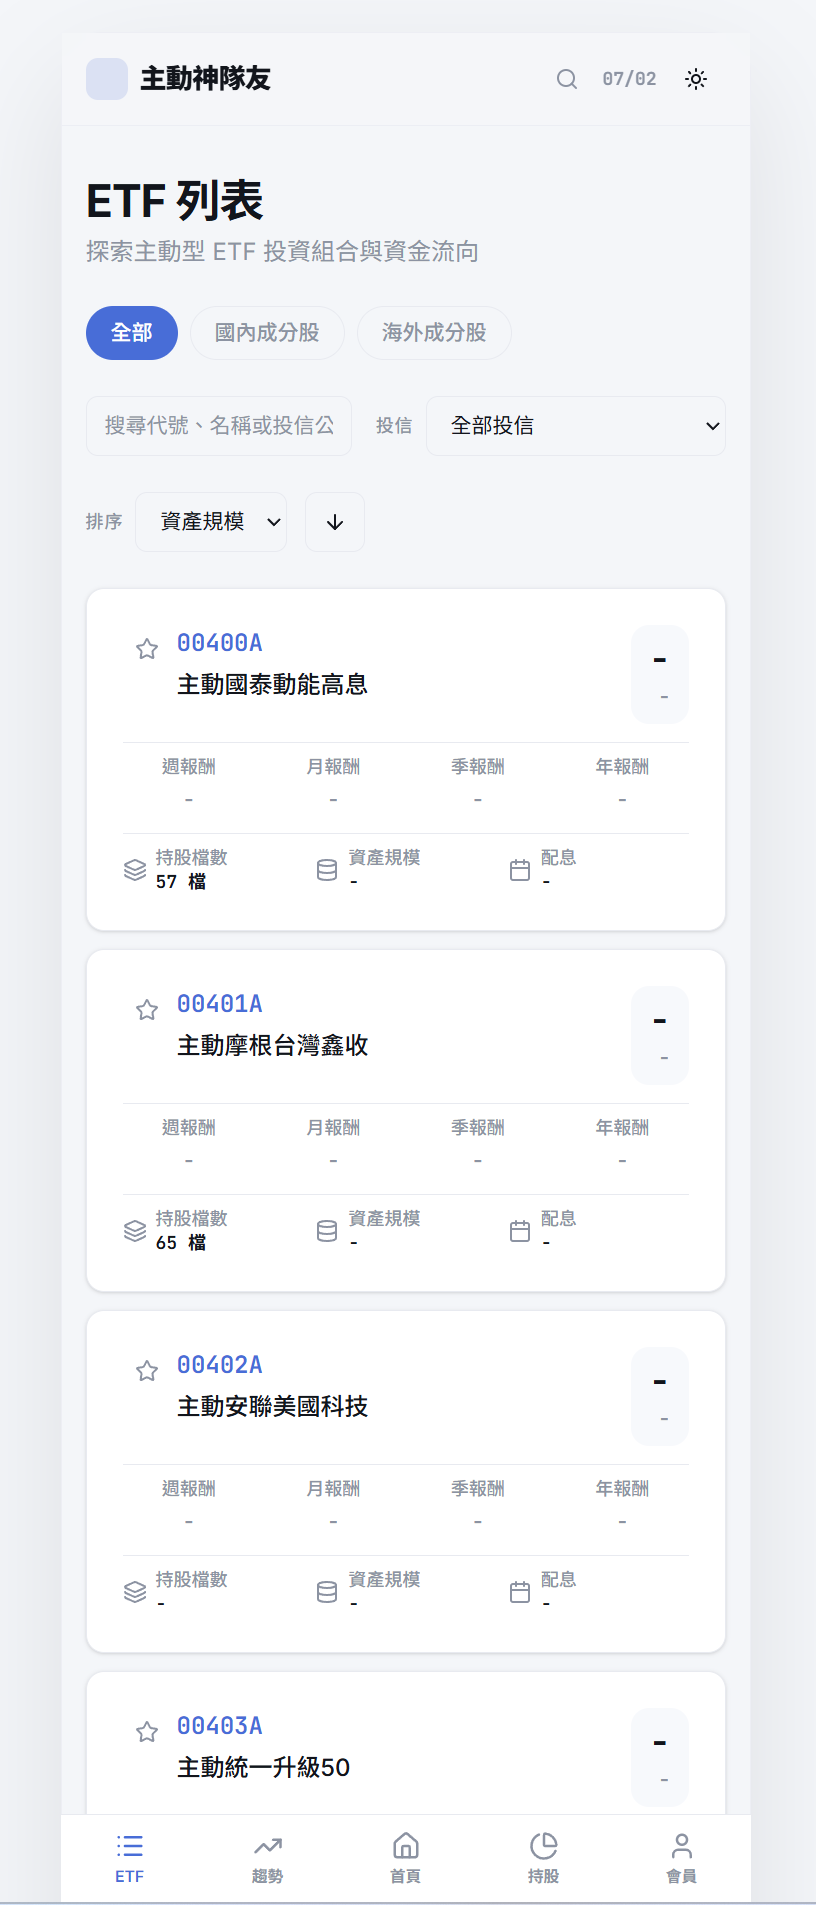
Explore and compare Taiwan active ETFs in one unified interface.
-
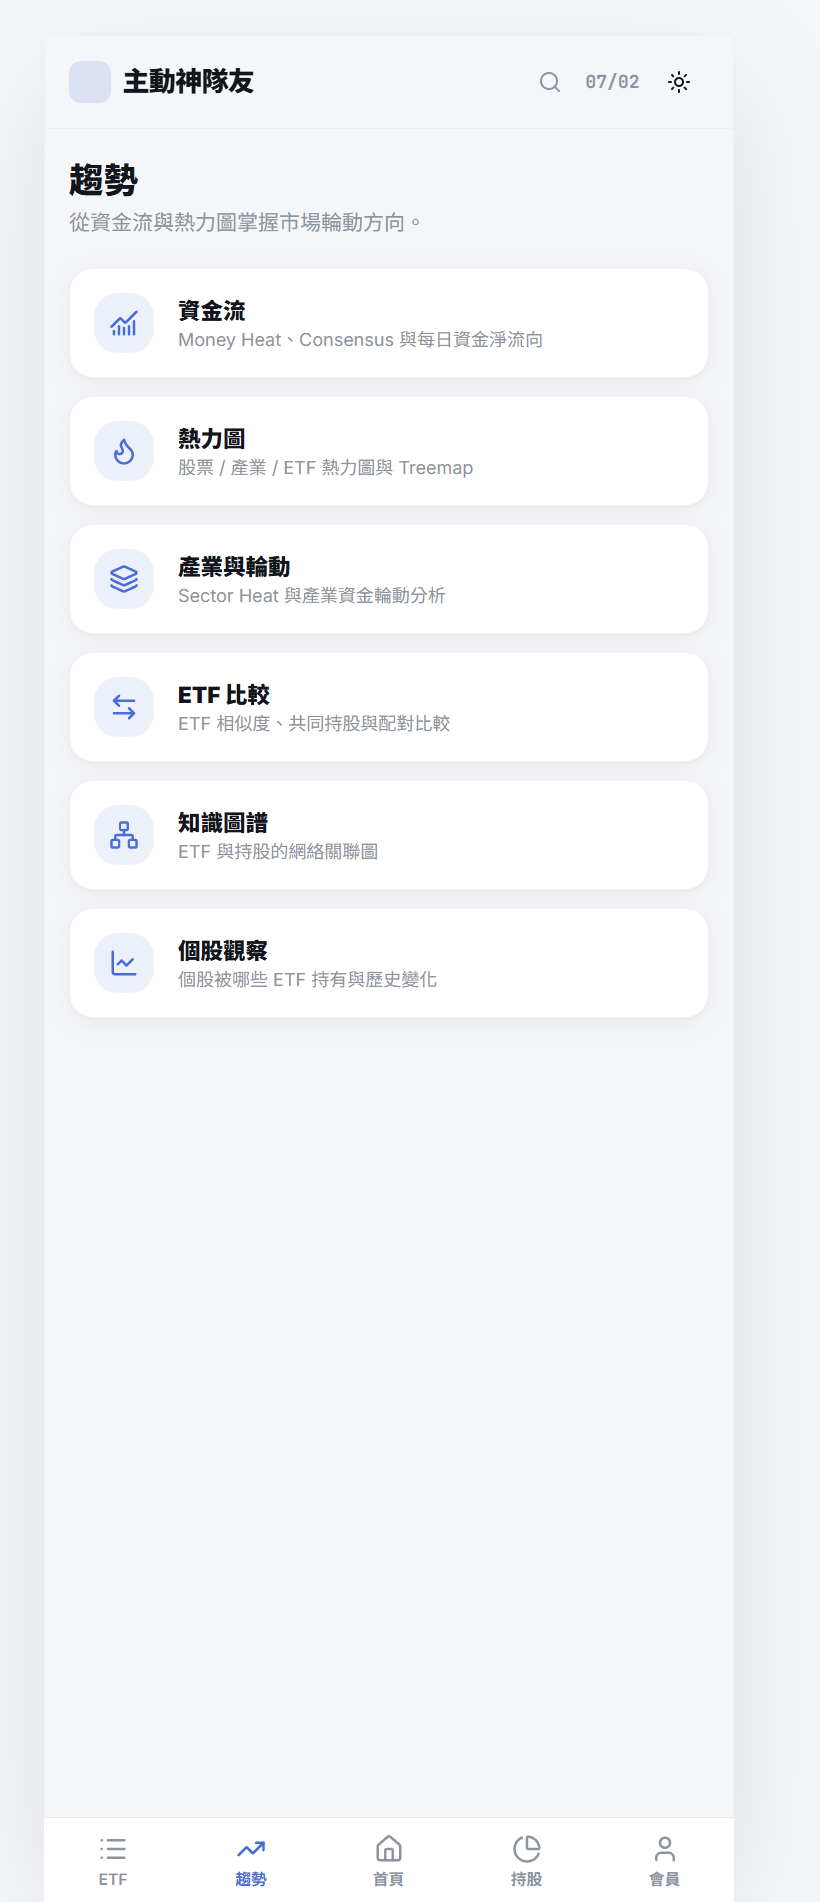
Compare portfolio overlap to identify shared positions and diversification differences.
-
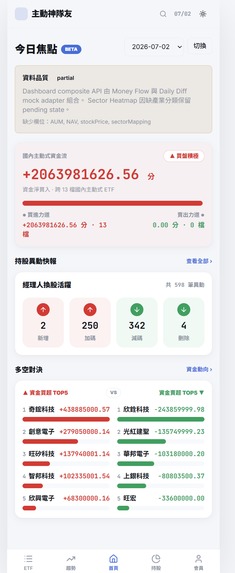
ActiveETF turns fragmented ETF holdings into clear, actionable market insights.

Inspiration
Taiwan’s active ETF market is growing rapidly, but portfolio data remains fragmented across asset management websites, spreadsheets, and inconsistent disclosure formats. Investors can find individual holdings, but it is difficult to understand how portfolios change over time, where active capital is moving, or how similar different ETFs are.
We built ActiveETF to transform fragmented public data into structured and actionable insights, making professional fund managers’ portfolio decisions easier for retail investors to understand.
What it does
ActiveETF is a data intelligence platform for Taiwan active ETFs. It automatically collects, normalizes, and analyzes portfolio data to provide:
- Daily holding increases and reductions
- Historical portfolio changes
- Fund allocation and money flow trends
- Sector concentration analysis
- Portfolio overlap between ETFs
- Stock-level views showing which ETFs hold the same company
ActiveETF does not predict investment returns or provide financial advice. Its purpose is to help investors understand portfolio positioning through transparent, data-driven analysis.
How we built it
We designed ActiveETF using a CQRS-inspired architecture that separates data processing from public data access.
The backend pipeline is built with Node.js, Fastify, and TypeScript. It retrieves portfolio data from multiple ETF providers, parses Excel files and web-based data, resolves security identifiers, validates records, and stores normalized historical data in Microsoft SQL Server.
After ingestion, the system calculates daily portfolio changes, sector concentration, fund flows, and cross-ETF similarity. Weighted portfolio overlap can be represented as:
$$ Overlap(A,B)=\sum_i \min(w_{A,i},w_{B,i}) $$
where $w_{A,i}$ and $w_{B,i}$ are the portfolio weights of security $i$ in ETFs $A$ and $B$.
The results are converted into lightweight read models and synchronized to Firebase Firestore. The public application is built with Next.js, React, TypeScript, and Tailwind CSS, allowing users to query precomputed insights without placing analytical workloads on the source database.
The pipeline follows these stages:
- Collect public ETF portfolio data
- Parse provider-specific formats
- Normalize and validate securities
- Store raw and historical records
- Calculate portfolio analytics
- Publish optimized read models
- Present insights through a responsive web interface
Challenges we ran into
Inconsistent provider formats
Each ETF provider publishes holdings differently. Some provide Excel files, while others embed data in web pages or use internal identifiers. We created modular provider adapters that convert each source into a shared data model.
Security identifier resolution
The same security may appear as a local stock code, an exchange-qualified symbol, an English name, or a provider-specific identifier. Overseas holdings make this even more complicated. We implemented a validation and resolution process that records unresolved securities instead of silently creating incorrect mappings.
Reliable daily updates
External websites can change without notice, and one failed provider should not prevent every ETF from being updated. The pipeline isolates failures by provider and preserves the most recent verified read model when a collection or analysis cycle fails.
Fast public queries
Running historical comparisons directly against the transactional database would increase latency and infrastructure load. We precompute analytical results and publish query-optimized documents to Firestore, keeping the public application fast and scalable.
Accomplishments that we're proud of
- Built an end-to-end pipeline from fragmented public data to investor-friendly insights
- Created a normalized model that supports multiple ETF providers
- Preserved historical holdings for day-to-day portfolio comparisons
- Separated analytical workloads from public queries using CQRS principles
- Designed failure isolation so one provider cannot break the entire daily update
- Delivered a responsive interface for exploring holdings, changes, flows, and ETF overlap
- Added automated testing and CI checks for both the data pipeline and web application
What we learned
We learned that collecting data is only the beginning of building a trustworthy financial product. Data normalization, validation, traceability, and failure recovery are just as important as analytics and user interface design.
We also learned to treat freshness and correctness as separate dimensions. A slightly older verified dataset is more valuable than a newer dataset containing incomplete or incorrectly mapped records. This principle shaped our validation rules and publishing workflow.
Finally, precomputed read models proved valuable beyond performance. They gave the public interface a stable contract while allowing the internal data pipeline and analytical models to evolve independently.
What's next for ActiveETF
Our next steps include:
- Expanding coverage to more active ETF providers
- Improving overseas security identification
- Adding data freshness and quality indicators
- Building alerts for significant portfolio changes
- Providing interactive historical trend visualizations
- Supporting personalized ETF watchlists
- Generating explainable AI-powered daily summaries
- Adding notifications through email and messaging platforms
Our long-term goal is to build a transparent intelligence layer for Taiwan’s active ETF market and make professional portfolio activity easier for every investor to understand.

Log in or sign up for Devpost to join the conversation.