-

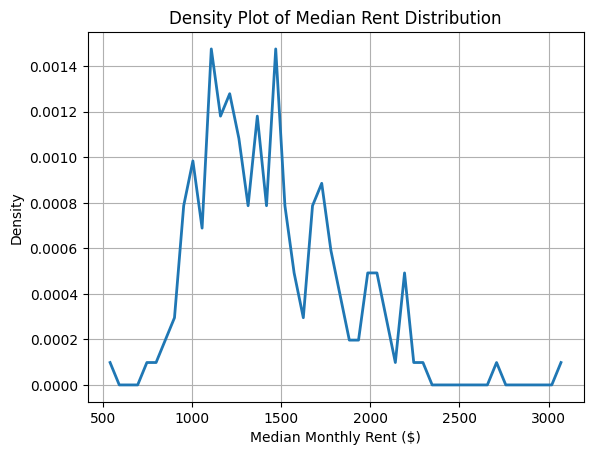
Density Plot of Median Rent Distribution
-

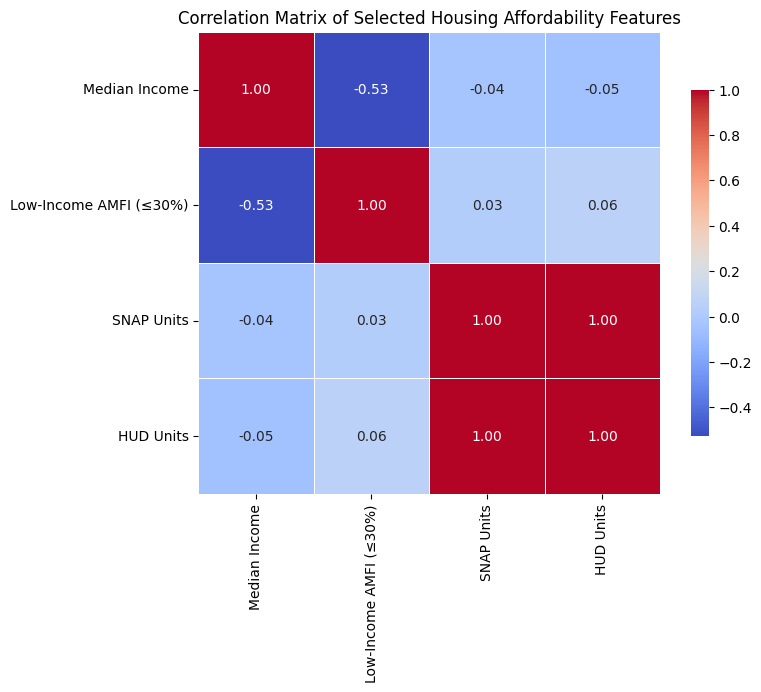
Heatmap
-
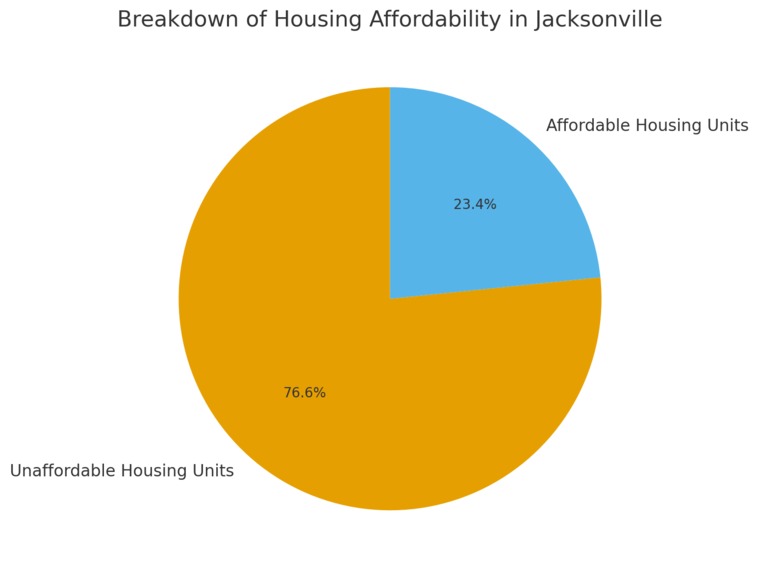
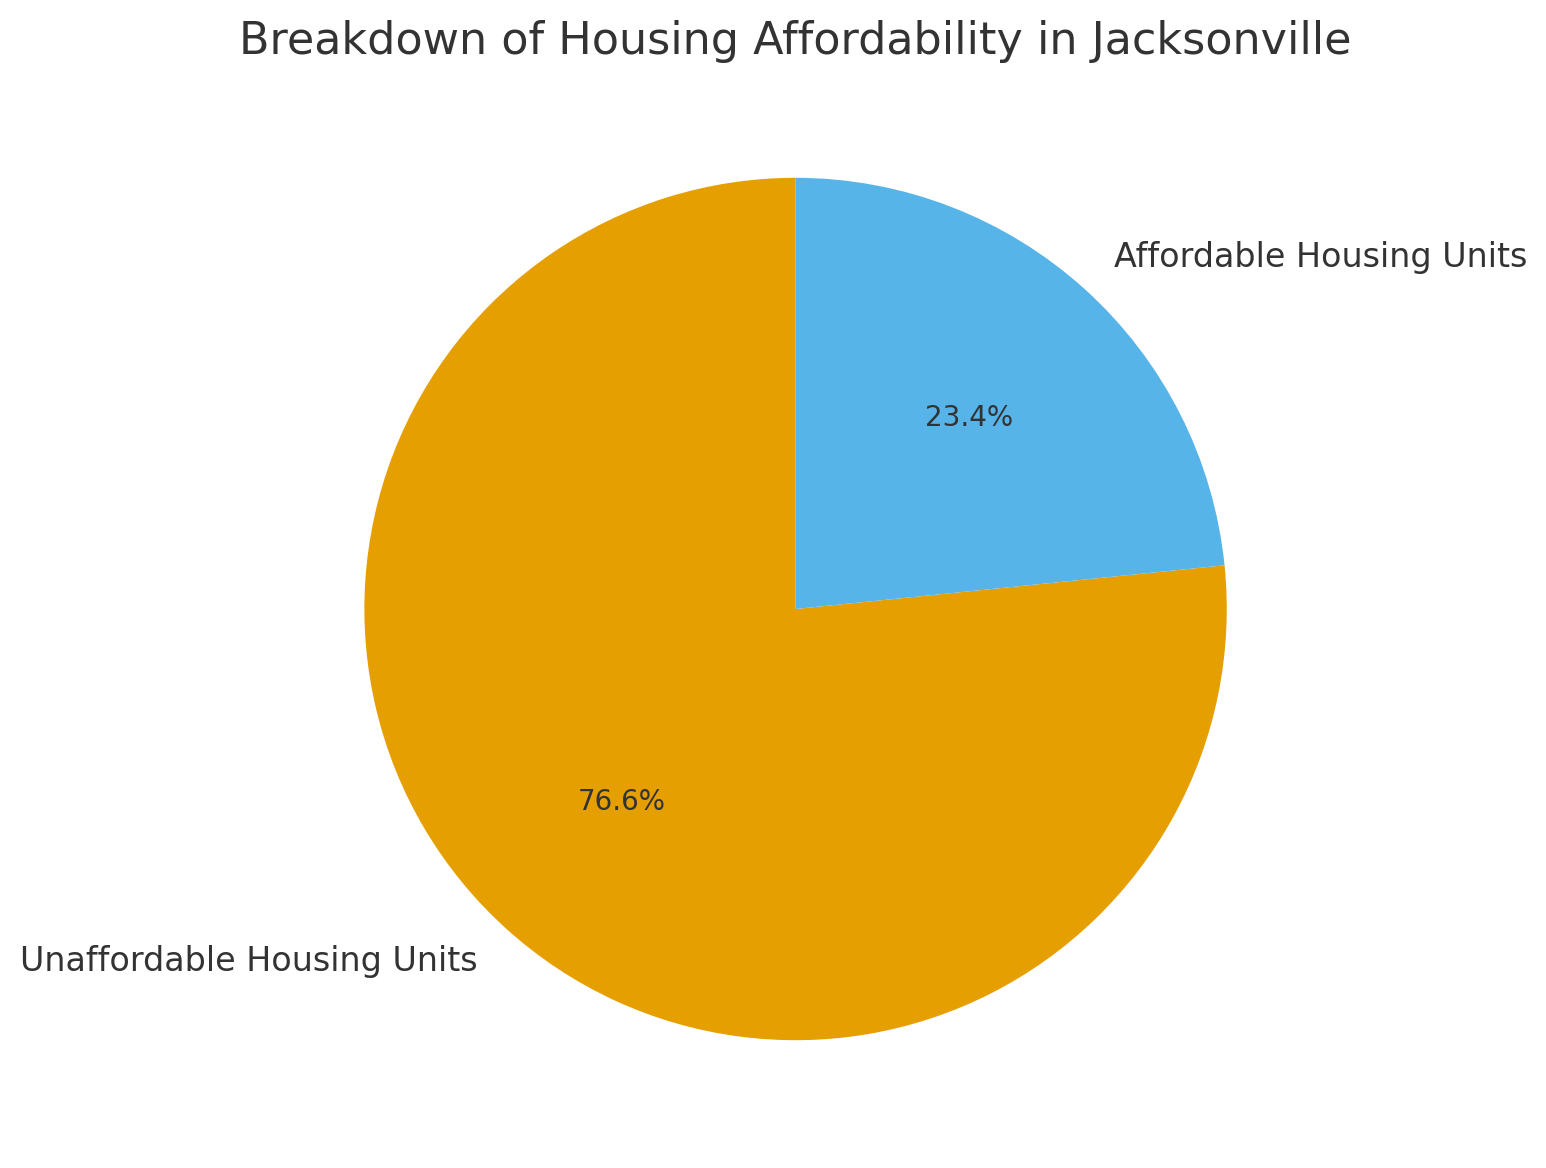
Percentage of Unaffordability
Inspiration
The project was inspired by the urgent need to address Jacksonville’s growing affordable housing crisis. Rising rent burdens, aging subsidized units, and income disparities are displacing vulnerable residents. We wanted to support smarter, more equitable investment by revealing where housing unaffordability is emerging, before displacement happens.
What it does
Our project produces a Housing Investment Index that scores every census tract in Jacksonville on its likelihood of becoming unaffordable, based on a set of socioeconomic and housing indicators. Using this score, we ranked neighborhoods from least affordable to most affordable, directly aligning with the investment risk. This makes it easy for policymakers to see which communities need investment now, where affordability is vulnerable but not yet critical, and which neighborhoods are currently secure but should continue to receive protection. In short, it turns analytics into action in support of community wellbeing.
How we built it
We began by merging all available datasets for all cities and cleaning the variables to form a unified tract-level data structure. To place Jacksonville’s housing conditions into a broader context, we performed PCA and exploratory analysis to identify peer cities with similar affordability dynamics. From this analysis, we selected Miami, Denver, San Antonio, Orlando, and Memphis as our five focus cities. For each of these cities, we built a comprehensive dataset with 123 variables from the hackathon data package. We applied Random Forest feature selection to each city to determine the most consistent drivers of affordability outcomes. Across multiple peer cities, four variables repeatedly emerged as the strongest predictors: Median Household Income, Area Median Family Income ≤30% for rent-occupied houses, Housing Units with SNAP Benefits, and HUD-Subsidized Housing Units. We validated these variables by training a Random Forest model on Jacksonville data. To ensure interpretability for policy use, we then trained a logistic regression model using the four key features. We used the predicted probability of unaffordability as our Investment Index and ranked tracts accordingly, identifying where investment has the highest potential to preserve affordability.
Challenges we ran into
Managing multiple datasets from different sources required substantial effort to standardize formats, align variable naming, and address gaps in the underlying data. With no descriptions provided for specific variables, we had some conflict interpreting them. Additionally, determining the best peer cities for comparison demanded analytical rigor. We also faced the challenge of creating a model that not only performs well but is easily explainable and credible for real-world decision-making. Along with this, we considered whether the chosen response variable was the most appropriate for our final goal. With a high number of potential indicators and limited time, we had to be strategic in selecting the most relevant features and continuously validating our results to ensure they reflected true housing conditions.
Accomplishments that we're proud of
We are proud to have built a real-world interpretable model that connects housing analytics with actionable decision-making within a matter of 48 hours. Our Investment Index simplifies complex affordability risk into an intuitive and impactful format that can be used immediately by city staff.
What we learned
We gained a deeper understanding of the complexity of housing affordability and the importance of careful data engineering in civic analytics. We learned that a model is only useful if its outputs are understandable and aligned with real policy needs. This project reinforced the importance of collaboration between data science and community stakeholders to make sure that insights lead to outcomes that benefit real people.
What's next for Actionable Analytics for Housing Affordability
Going forward, we plan to incorporate additional drivers of affordability, including owner vs renter influence, transportation access, and future housing development pipeline data. We also aim to forecast changes in housing stress over time to help the city intervene proactively before displacement occurs. Scaling this approach to the five peer cities will allow Jacksonville to benchmark its progress and adopt strategies that have proven successful elsewhere. Ultimately, we envision this tool becoming part of a publicly accessible dashboard that helps both residents and policymakers ensure that Jacksonville remains an affordable and welcoming place for all.

Log in or sign up for Devpost to join the conversation.