Inspiration
I felt it is really hard to sort the data in the STAT homework to get Q1 and Q3, and feel wast time for me to confirm Q1, Q3 and standard deviation that I get from the calculator since sometimes the data is too many. There I want a website where I can input data quicker and et solution quicker.
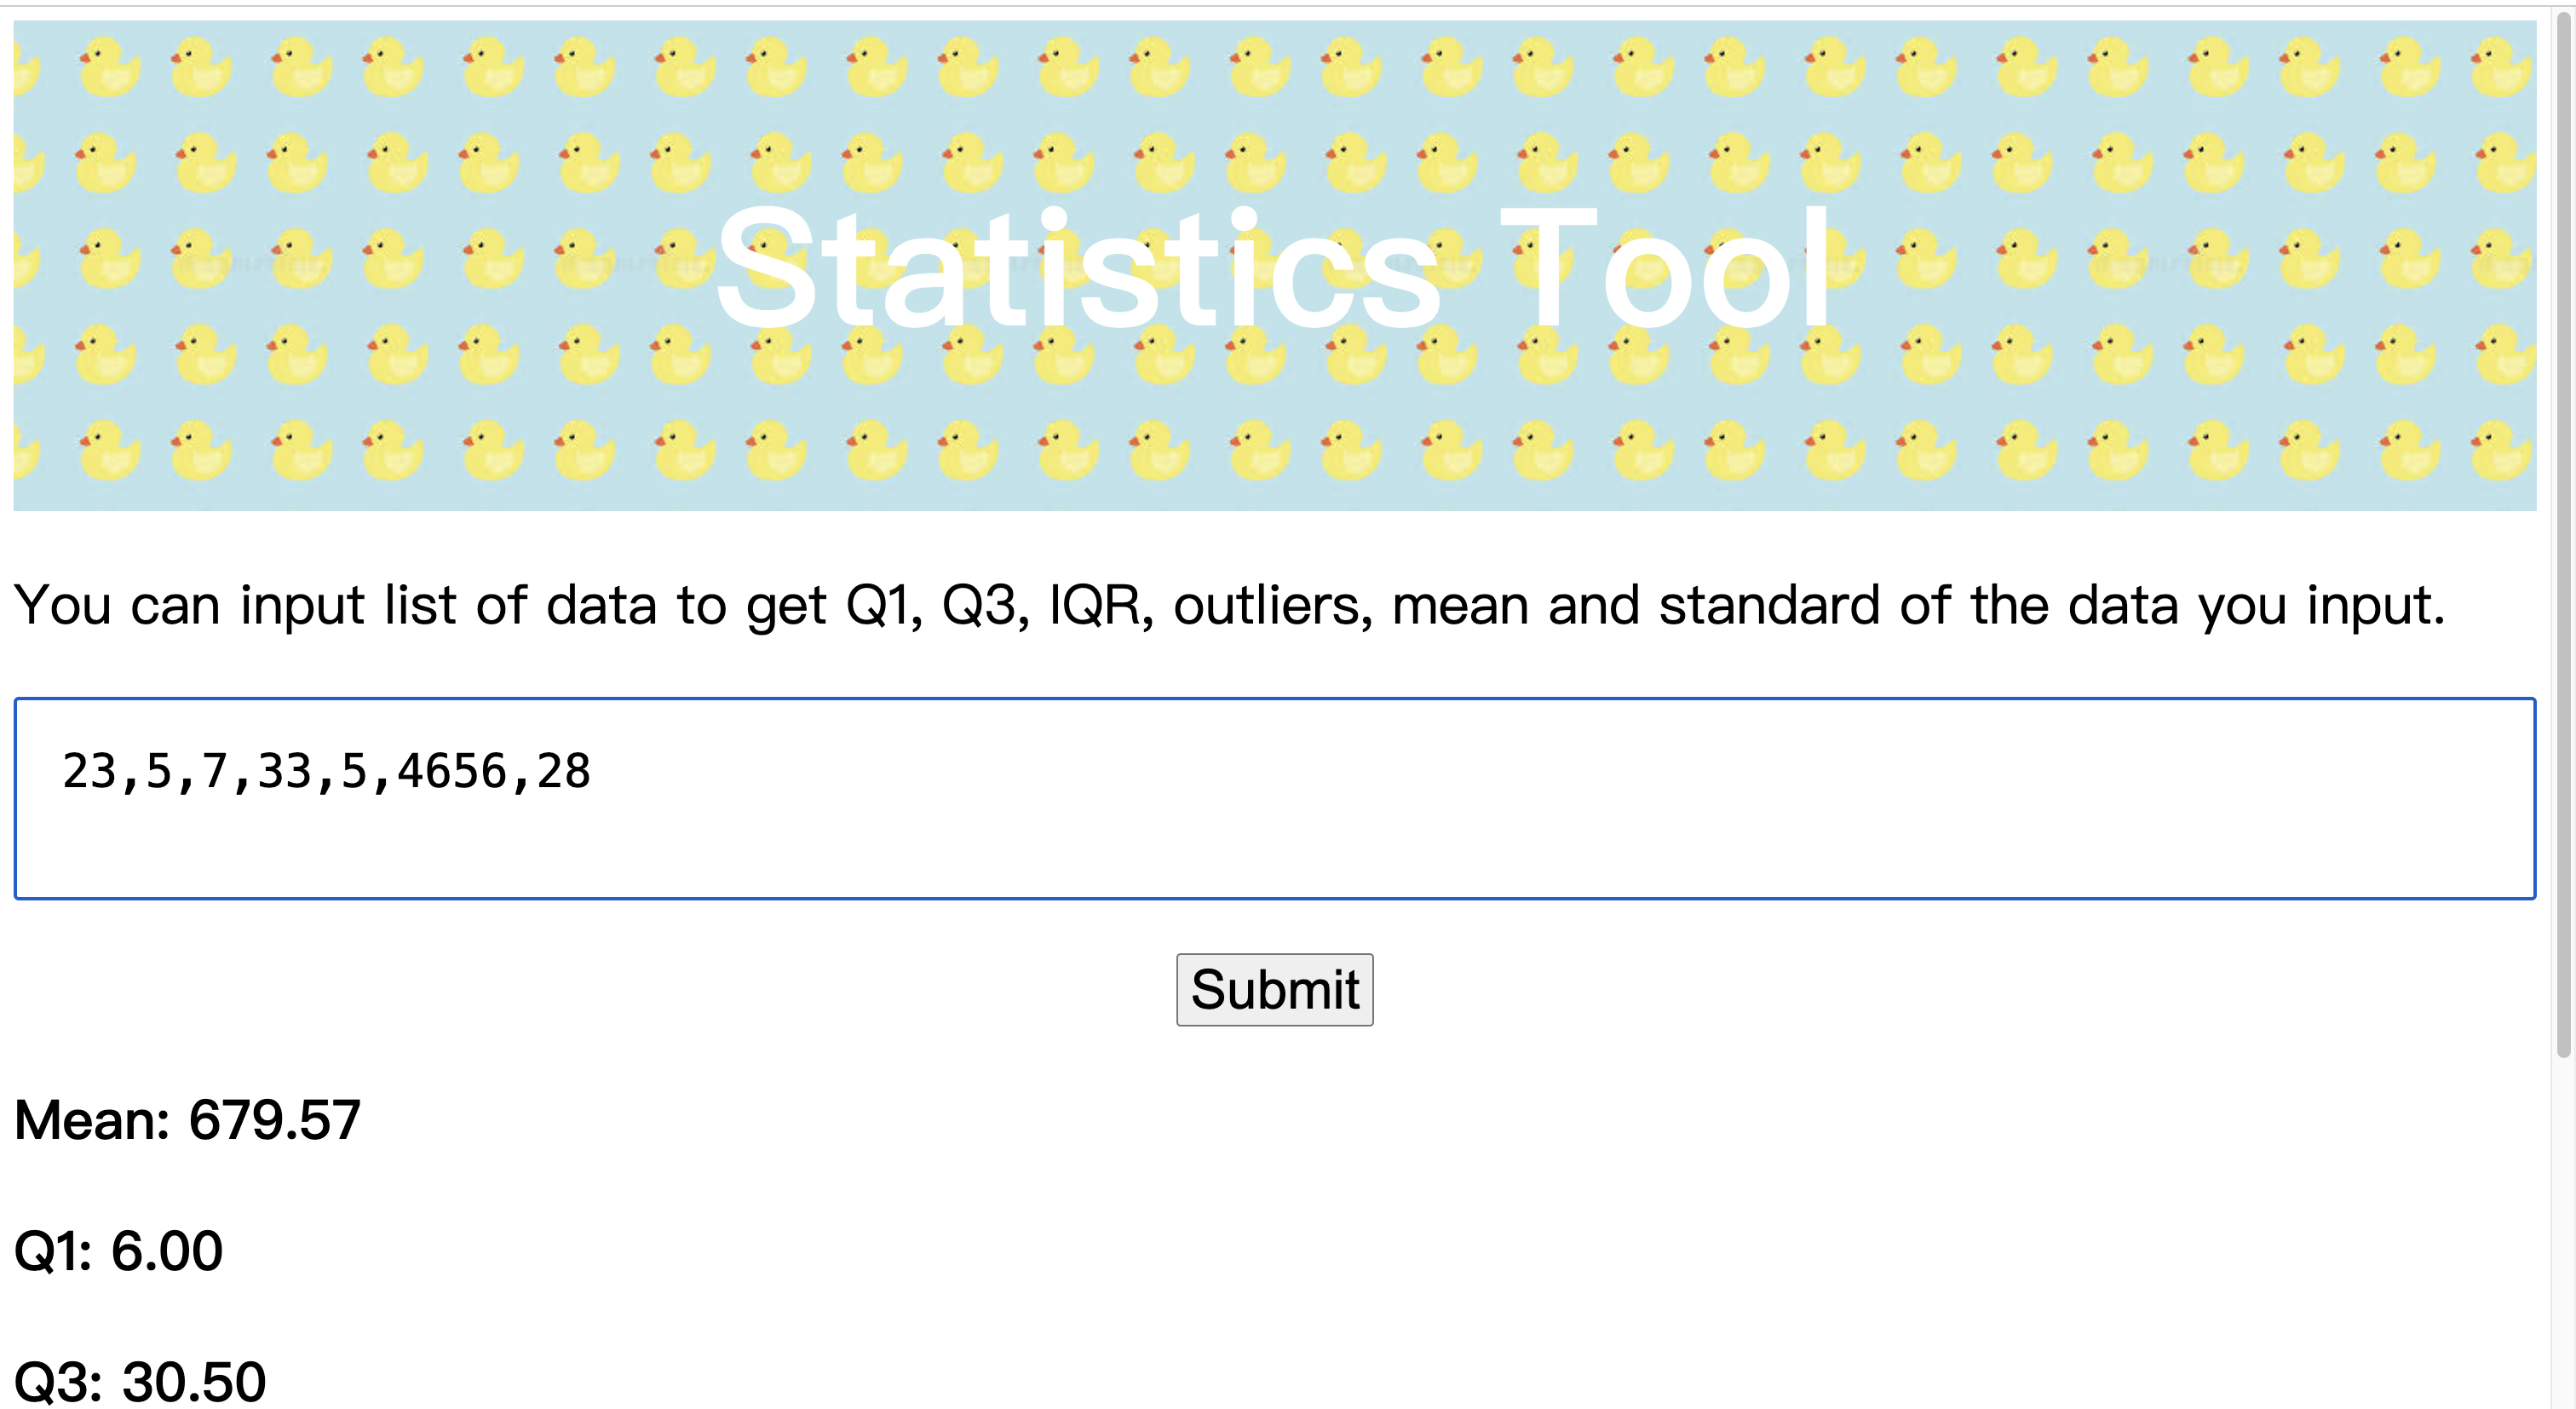
What it does
Output Q1, Q3, IQR, standard deviation and outlier of data user input.
How we built it
I just HTML and CSS to build the front, javascript as API and python as a serve.
Challenges we ran into
How to make a API by Javascript and serve by python is a new region for me. So it is hard for me to make this website even the base logic is easy.
Accomplishments that we're proud of
I use python to make a HTTP serve and make a small website along
What we learned
How to use javascript as a API and transform data to the serve to the back side and how to use python to make a HTTP service
What's next for acout dataset and output solotion
I might going make new website for other statistical require in STAT 263.

Log in or sign up for Devpost to join the conversation.