Inspiration
The Gilded Ace manager wanted to replace the 10 slot machines with the lowest earnings. Originally, the task looked simple, but the data told a different story,
A machine can have low earnings because it was newly installed, retired early, down for repairs, located in a lower demand area, or had unusual payout results.
That became the question behind AceIQ: is a machine truly underperforming, or is it being judged unfairly? We wanted to do more than rank low totals by showing the evidence behind a decision in a way that was easier to understand.
What it does
AceIQ is a casino decision dashboard. It compares actual house win with theoretical earnings, active days, availability, downtime, payout variation, and similar machines.
Users can change the date range, investigate a machine, review downtime, compare peers, and see bank and floor context. The dashboard also includes demand trends, event and traffic context, tracked player results, comp economics, and forecast validation.
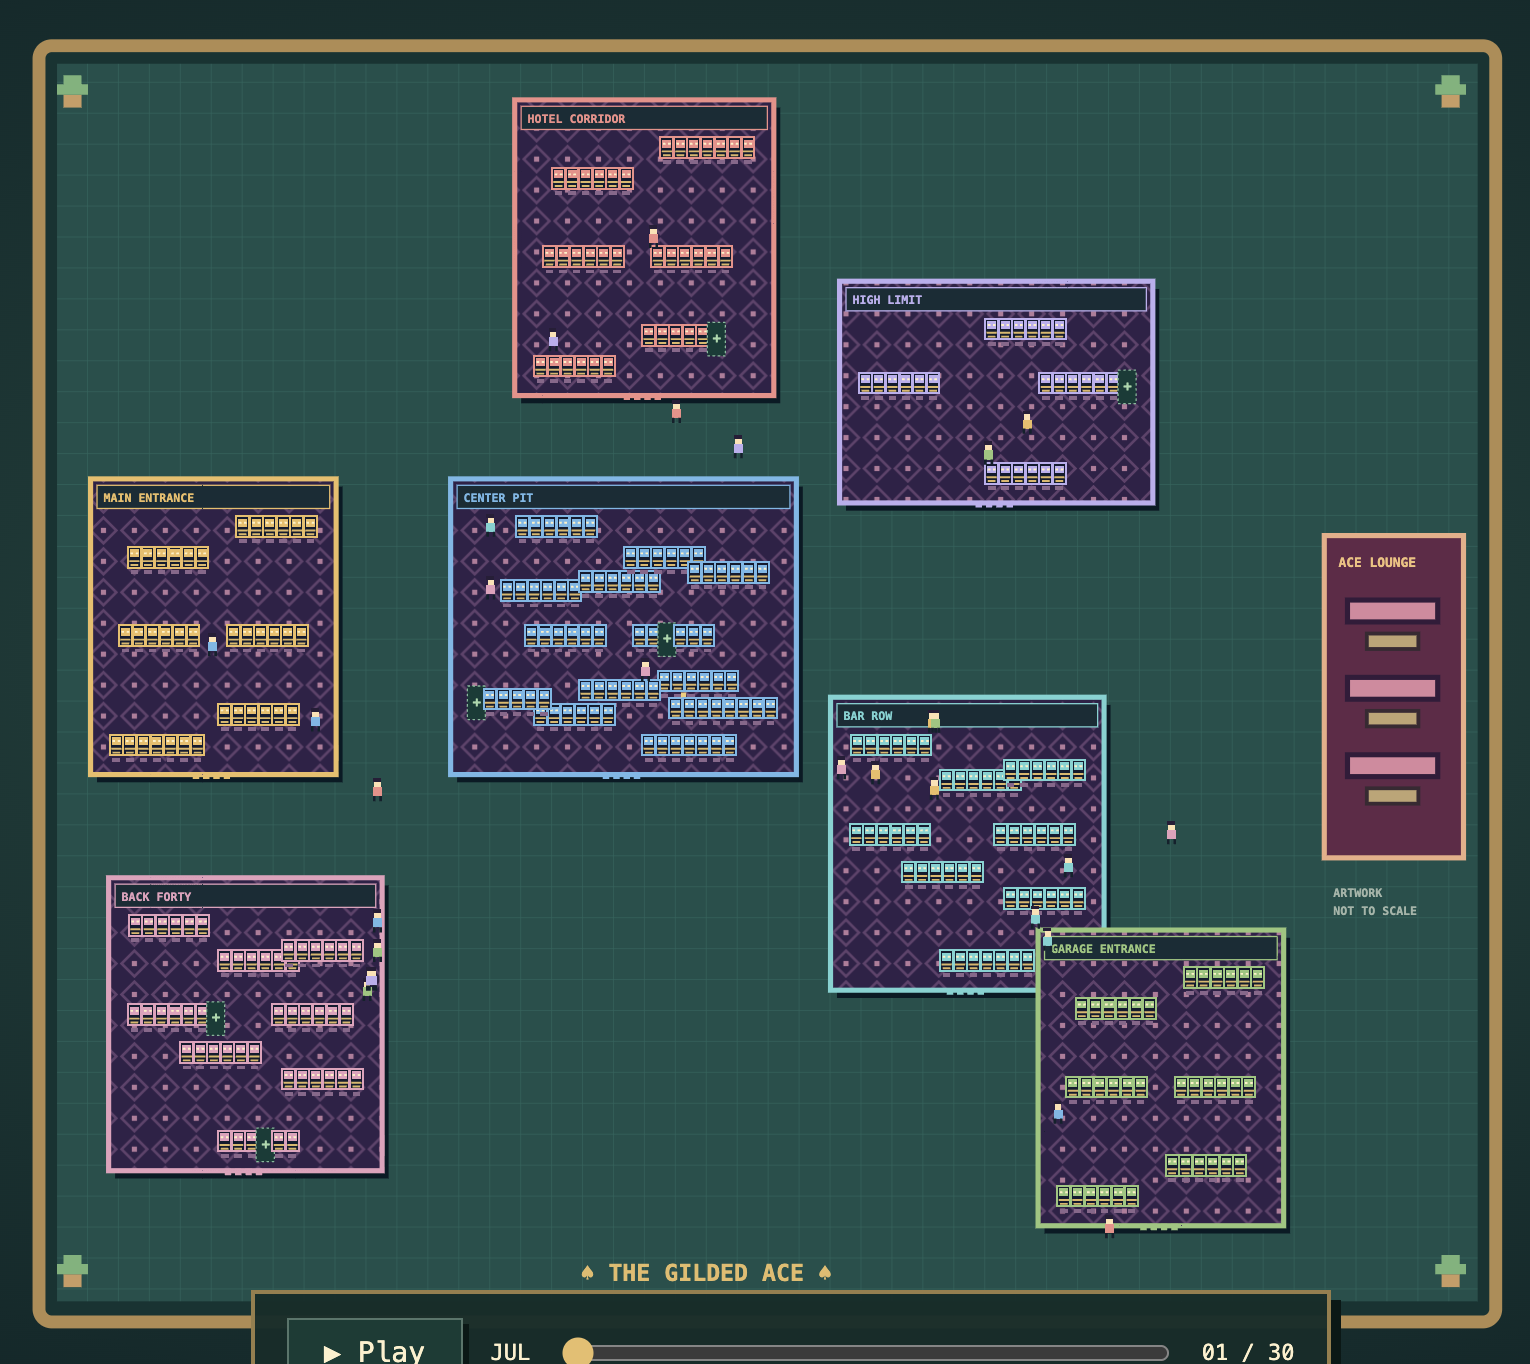
The July planner works within a $100,000 budget. It checks action costs, lead times, downtime, quantity limits, and incompatible actions. The interactive floor lets users review machine moves, swaps, additions, removals, inspections, replacements, and maintenance ideas before confirming a plan. Users can compare changes with the current plan and undo actions.
How we built it
We created machine, bank, and zone summaries. We compared actual results with theoretical results, used supplied variance data for payout context, and built downtime and demand views. For forecasting, we used January through April data for training and checked the result against a frozen May through June holdout and a constant baseline. July is used for planning, not as observed performance.
Challenges we ran into
We started with limited experience with large datasets, Parquet files, theoretical win, payout variation, and operational planning.
The biggest lesson was that low revenue alone is not enough. We had to check exposure, availability, expected earnings, and payout variation before calling a machine weak. We also learned the difference between tracked player data and total machine data, how to avoid double counting comp costs, and why a location pattern does not prove that location caused the result.
What we learned
How to inspect schemas, validate records, reconcile totals, build comparisons, and question our first conclusions.


