-
-

Camera upload option
-
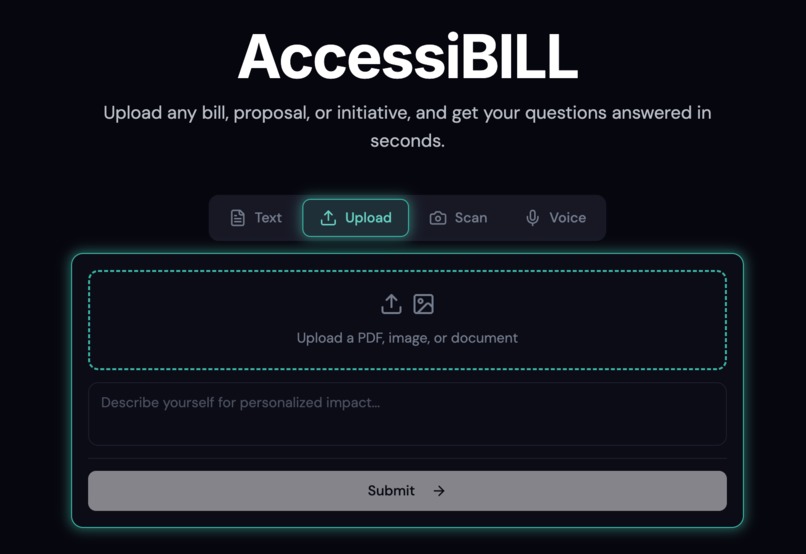
PDF upload option
-
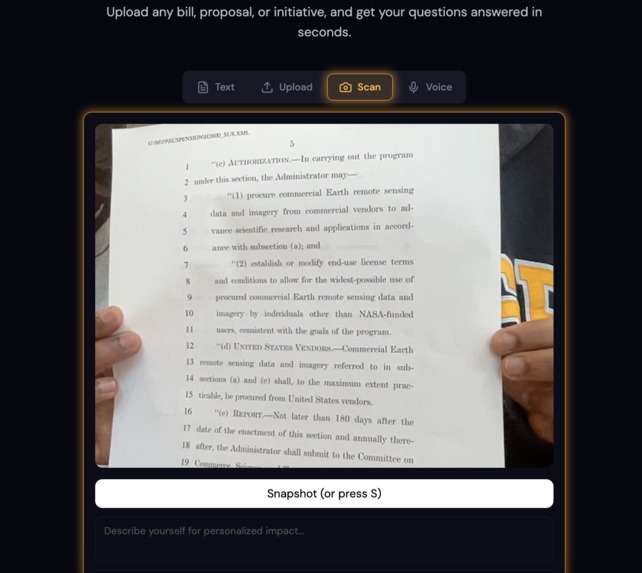
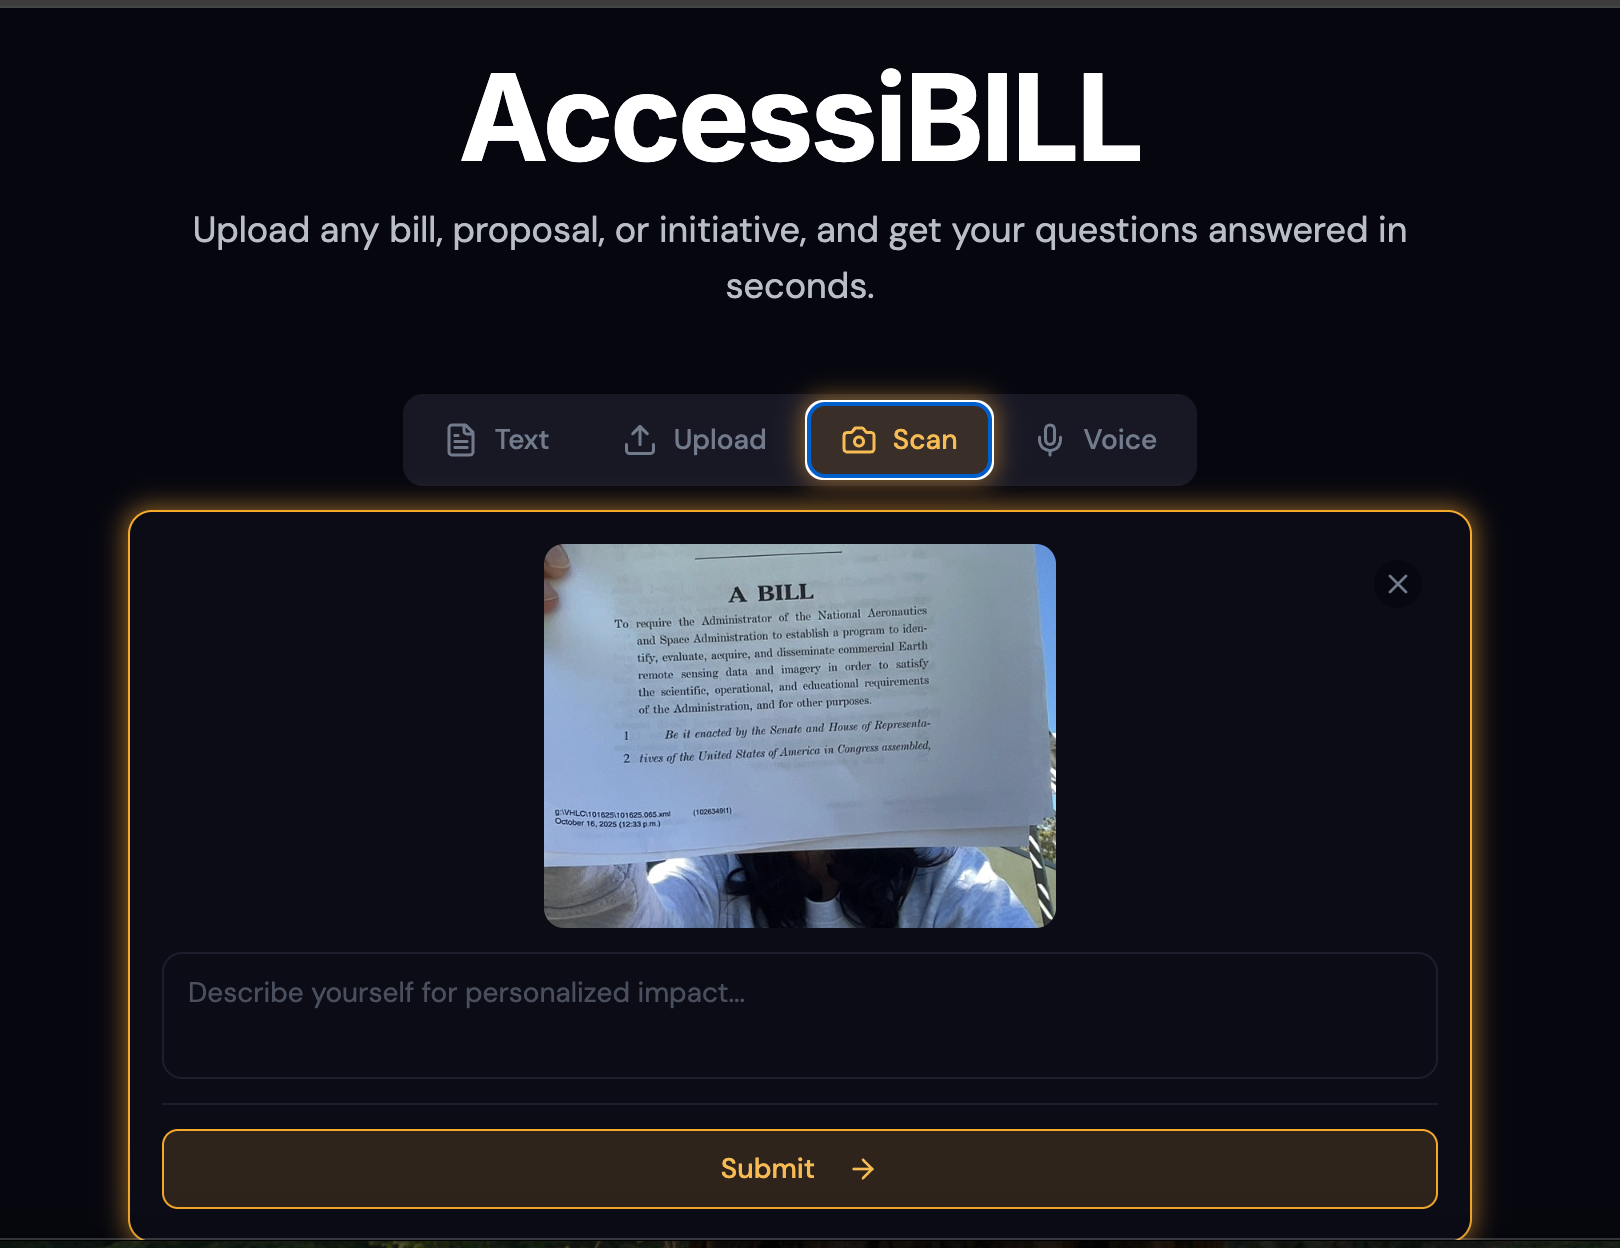
Camera snapshot
-
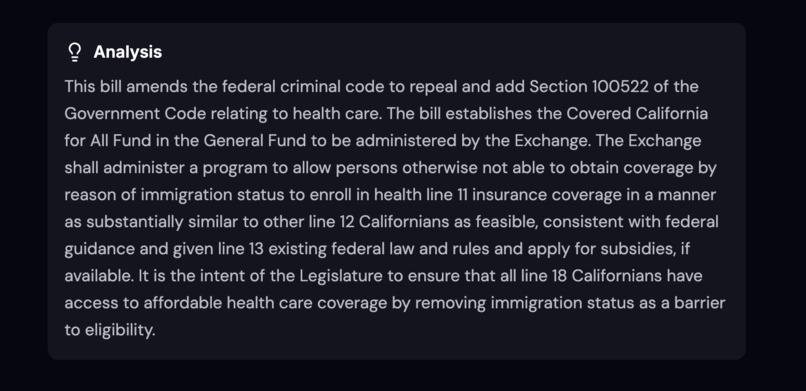
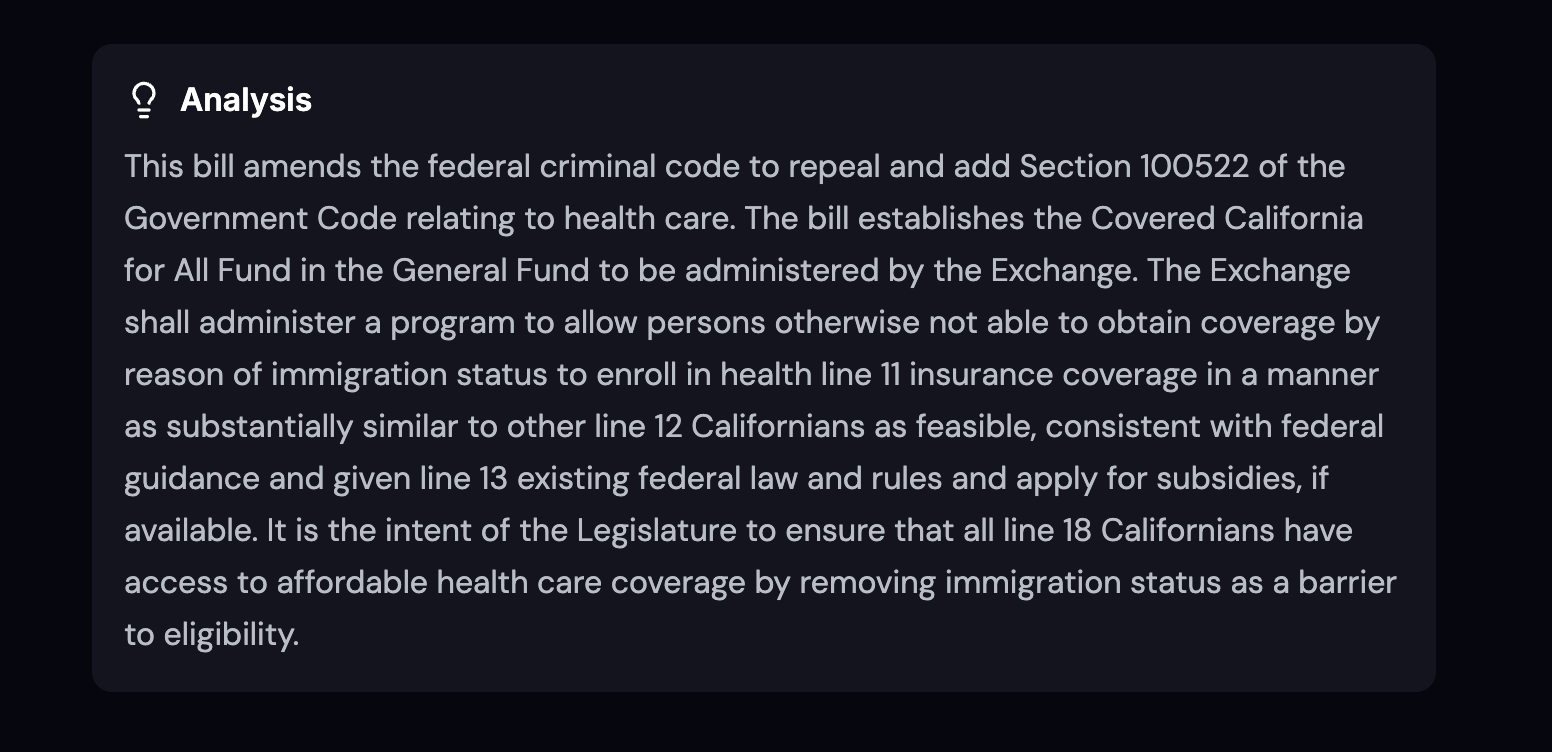
Proposition Analysis
-
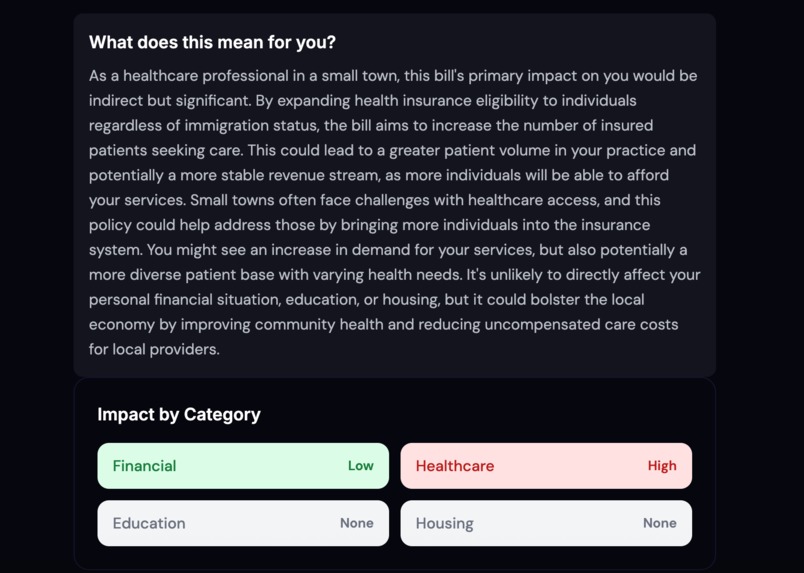
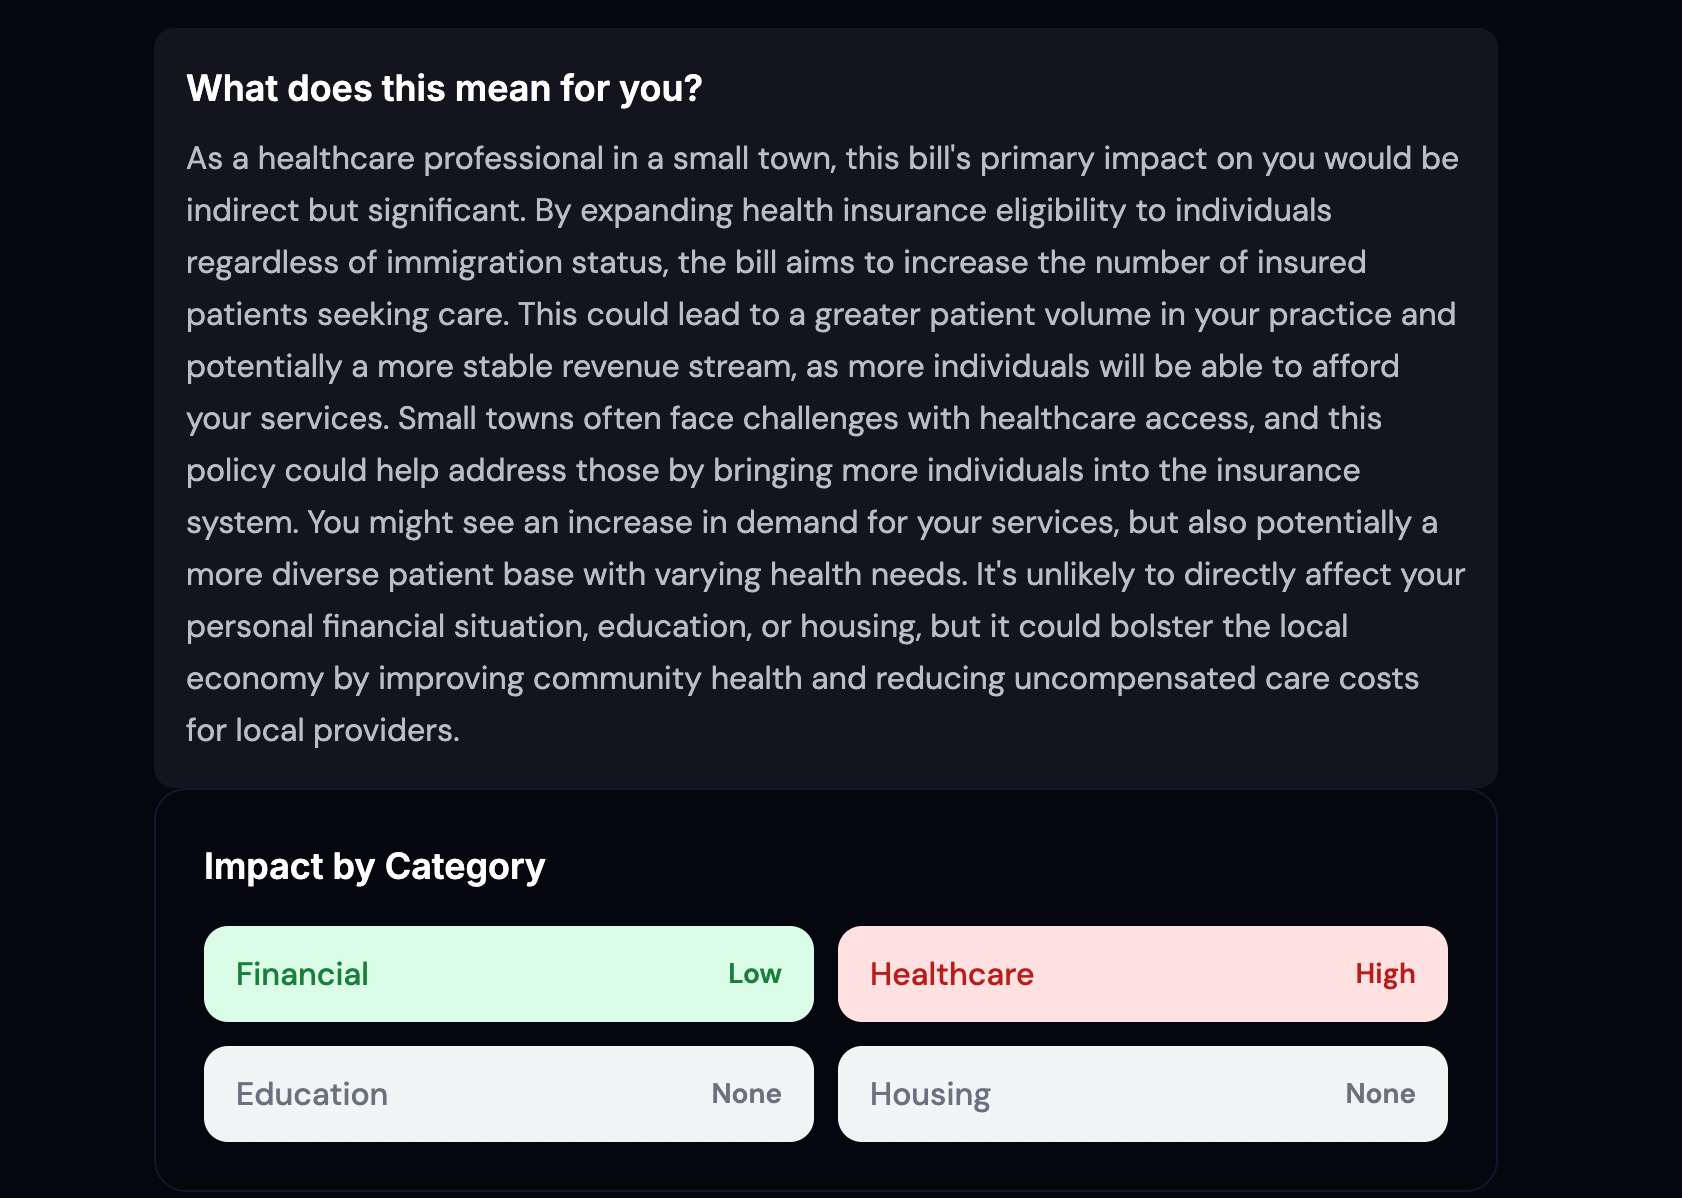
Personalized Impact
-
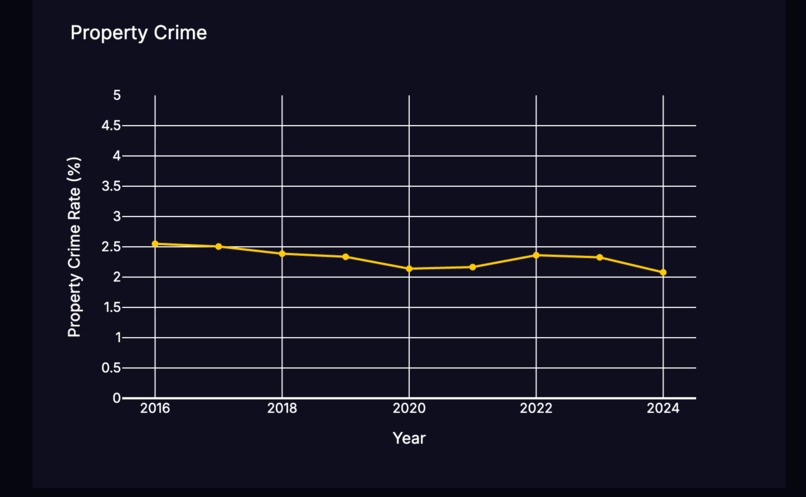
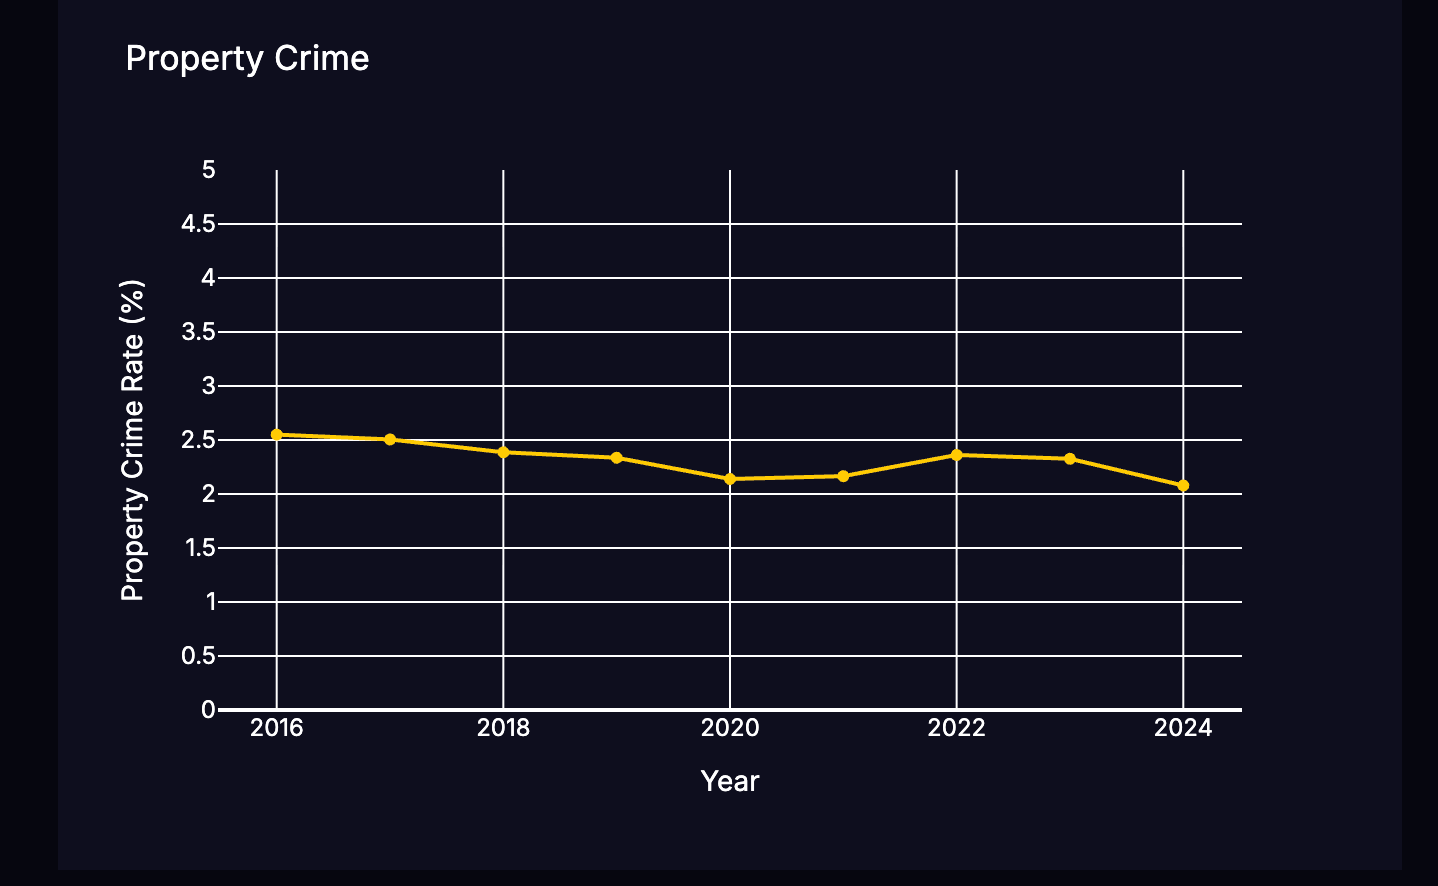
Property Crime Forecast
-
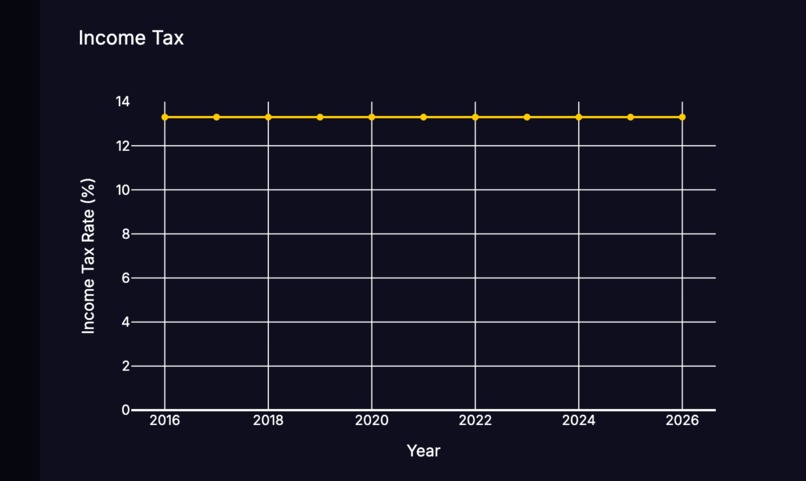
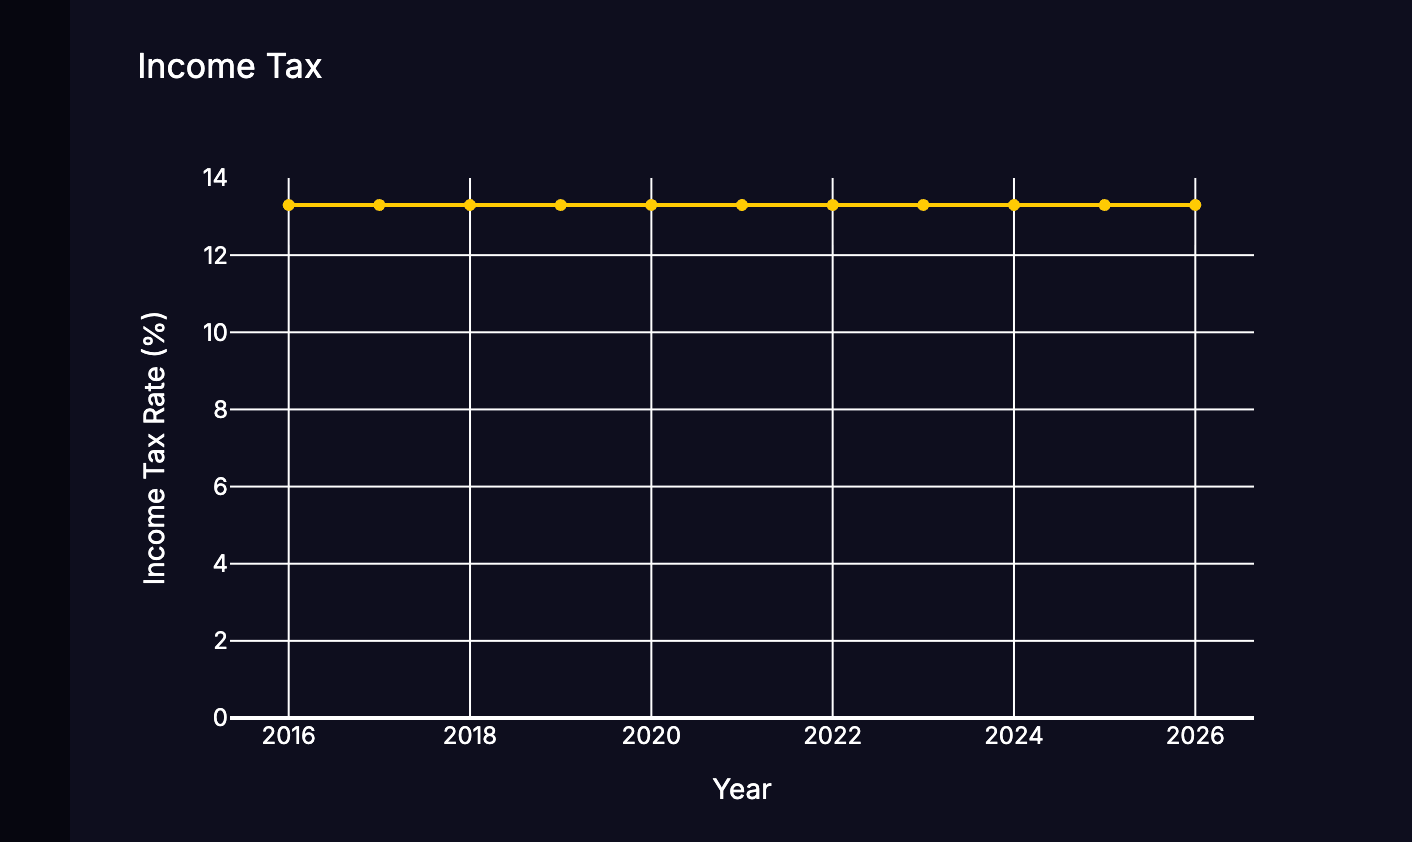
Income Tax Forecast


Data
BillSum - over 22K rows of long bills labeled with their human written summaries. We used this to train a summarizer model which can take in complex legal text and output readable summaries.
CDE Crime - a federal dataset containing historical crime rates from all states since 2000 ITEP Tax - historical state income tax rate data since 2000 We used these to visualize the data based on the users location and add crime and tax rate predictions based on the propositions.
Inspiration
America is the largest democracy in the world, yet more than 70% of Americans fail basic civic literacy tests, according to the US Chamber of Commerce. When presented with a stack of propositions, most voters can’t understand the complex language each law is written in, leading them to vote for what others tell them instead of forming their own opinion, or simply not vote at all. People do not have time to read through and research the effects of each proposition, and voter turnout in the US is alarmingly low compared to other democracies.
What it does
At AccessiBILL, we give you all the information neatly summarized on one page. First, the user snaps a picture of the proposition or bill. Our app summarizes key points without adding bias, allowing them to form their own opinions. We also display the predicted effects on income tax and property crime rates. Lastly, we display a personalized impact dashboard, displaying how the law will specifically impact the user given their background. With a clean, user-friendly translation of complex text, we make voting easy and accessible for all.
How we built it
We used an OCR camera vision model combined with OpenCV to take in a picture of the legal document and extract text from the image. We then trained a Transformer model on the BillSum dataset, and inputting the text into this model outputs a user-friendly summary. From the summary and previously prompted user information, we send the data to the GeminiAPI and ask for a personalized impact. Lastly, with the CDE Crime and ITEP Tax datasets, we use Plotly to visualize the trends and the GeminiAPI to give predictions for the next two years assuming the proposition passes.
Challenges we ran into
Finding datasets was extremely difficult. The first few bill summarizers had very few samples and the model had only 50% accuracy. Once we found a large enough dataset, the model took hours to train due to the length of the legal text to process. The crime and tax rates dataset needed extensive preprocessing and aggregation of missing values from other sources. It was also challenging connecting our different components into one seamless web app and taking values from different components, such as the bill summary inputted into the graph predictions.
Accomplishments that we're proud of
Our model takes a picture from a live video feed for user ease. We analyze the data and output multiple clear charts and summaries for a seamless user experience, and tailor highly personal predictions. Our app is extremely easy to use since we only require a few sentences of unstructured user information and a snapshot of the bill.
What we learned
We learned how to use OCR tools for text extraction from images. By using long legal text, we learned how to process huge amounts of data and train a model on it. We also learned methods for data visualization using Plotly.
What's next for AccessiBILL
We would like to make it more accessible for users where English is not their first language. Along with the summary, our app can also translate the text into the chosen language. We would also like to include a text-to-speech feature where the summary is read out loud for the visually impaired.
Built With
- fastapi
- geminiapi
- javascript
- opencv
- plotly
- python
- vite

Log in or sign up for Devpost to join the conversation.