-
-
An accessibility intelligence platform
Inspiration## Inspiration
I kept meeting two groups of people stuck with the same problem from opposite ends. Wheelchair users and caregivers plan trips around closures they only find out about at the corner. City planners I talked to had plenty of restriction data but no way to see what it actually does to someone moving on foot, with a wheelchair, or with a stroller. Toronto publishes road restriction data openly, but it sat as XML and spreadsheets. Nobody was joining "what's closed" with "where can people still safely go." AccessFlow started as a way to make that join visible, interactive, and honest about its evidence.
What it does
AccessFlow is a web application that turns Toronto's open street-disruption data into decisions:
- Impact prediction. An XGBoost classifier scores each restriction for accessibility impact (None / Low / High) using closure duration, road class, and pedestrian-network context. Held-out F1 is 0.976.
- Evidence-grounded AI explanations. Every restriction, route, and overview view gets a plain-language explanation assembled from precomputed evidence (replacement-path detours, connectivity loss, confidence), with optional LLM enhancement only after the facts are fixed — the model can polish wording, never numbers.
- Disruption-aware routing. Dijkstra over 87,105 pedestrian network edges, with the option to avoid a specific closure or all closures, plus route character (signals, barriers on path) and step-level guidance.
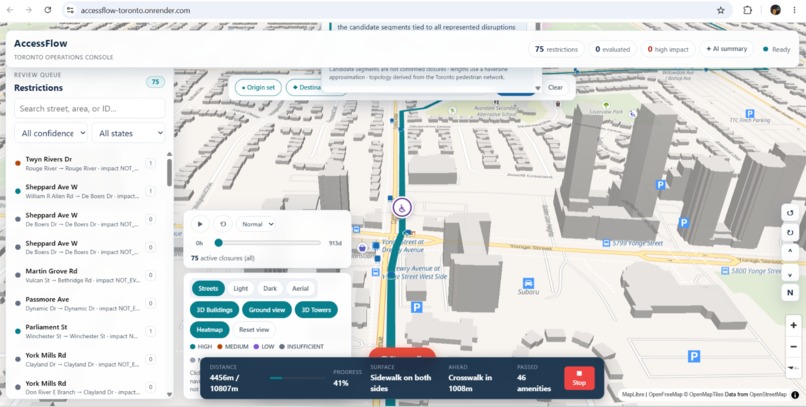
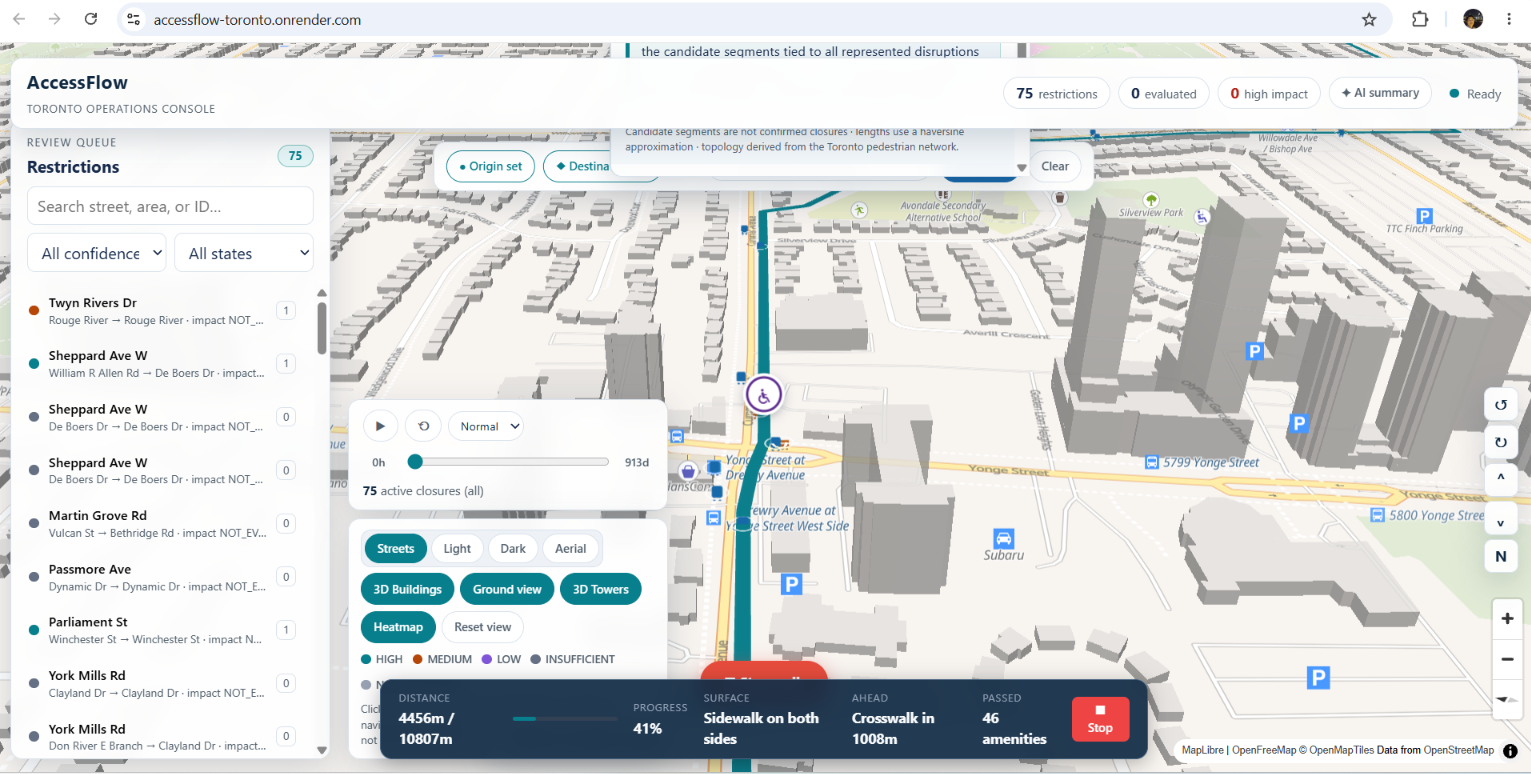
- 2D/3D map simulation. Deck.gl and MapLibre with 3D massing, teardrop pins by duration, and a street-level "walk this route" simulation that shows the traveler marker moving past washrooms, cooling centres, benches, libraries, and TTC stops — 12,713 amenities within 200 m counted along the way.
How we built it
- Data: 10 Toronto Open Data sources — road restrictions XML, pedestrian network GeoPackage, 3D massing, TTC GTFS (wheelchair_boarding), and public amenities (benches, washrooms, cooling centres, libraries, community centres). Ingestion and normalization in Python 3.11 with strict provenance tracking (dataset URL, license, retrieval timestamp, transformation notes).
- ML: Scikit-learn + XGBoost pipeline with time- and geography-aware evaluation to control leakage; feature importance and model comparison published as artifacts.
- Backend: FastAPI with a clean repository boundary (CSV artifact mode or Postgres/PostGIS), precomputed network-impact evidence, rate-limited endpoints, WebSocket live updates, and
/api/v1/ai/explainfor deterministic explanations with optional LLM polish. - Frontend: Next.js + TypeScript + Zustand, deck.gl for data layers, MapLibre basemaps (including a Martin tile-server mode), React Aria for accessibility, and a walk-simulation engine synced to route geometry.
- Infra: Multi-stage Docker build (Node static export → Python API), Render free-tier deployment, GitHub Actions CI. Live at accessflow-toronto.onrender.com.
Challenges we ran into
- Never inventing geography. The brief was strict: no fabricated fields, metrics, or street facts. Every claim on the map traces back to a source record or a precomputed artifact, which shaped the explanation engine's design (facts first, language second).
- Leakage-free evaluation. Early random splits inflated scores. We separated train/test by time and geography and documented the controls before trusting any metric.
- Rendering performance. 3D massing initially loaded as a multi-hundred-MB GeoJSON and froze the browser. We chunked it into grid cells served lazily, moved re-renders out of the animation loop, and fixed a traveler-marker desync where the walk progress clock and the deck.gl draw clock drifted apart.
- Deployment on a budget. Fly.io and Railway wanted a card. We shipped a single-container blueprint on Render's free tier with artifact mode so there's no database to provision, plus a health check for cold starts.
Accomplishments that we're proud of
- End-to-end pipeline from raw civic XML to a live, walkable 3D map in production.
- ~98% F1 on impact classification with documented leakage controls and published feature importances.
- An explanation system that shows its work — every AI sentence cites an evidence field (median detour, connectivity loss, confidence) you can verify.
- Accessibility-first UI: keyboard support, screen-reader-friendly components, wheelchair-boarding data from TTC integrated into routing context.
- Full provenance manifest for every dataset, ready for civic review.
What we learned
Open data is not the same as usable data. The hard part wasn't the model — it was building trust: provenance you can audit, metrics you can defend, and explanations that admit uncertainty ("NOT_EVALUATED" is a valid, honest answer). We also learned that accessibility tools fail when they're designed for the abler user; simulating the route as an actual traveler changed several design decisions we would have gotten wrong.
What's next for AccessFlow
- Swapping the CSV artifact layer for live PostGIS ingestion so restrictions update as the city publishes them.
- Real-time transit joins (GTFS-RT) so detours account for stop closures, not just street segments.
- A reporter/resident mode: submit an observed barrier, get an evidence-backed impact brief you can send to 311.
- Partnering with local accessibility advocates to field-test the walk simulation and tune what the explanations emphasize.
What it does
How we built it
Challenges we ran into
Accomplishments that we're proud of
What we learned
What's next for AccessFlow
Built With
- css
- dockerfile
- html
- javascript
- python
- typescript

Log in or sign up for Devpost to join the conversation.