-
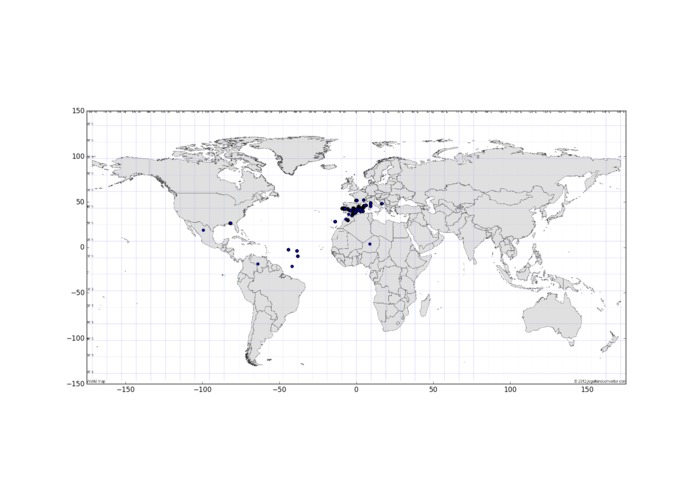
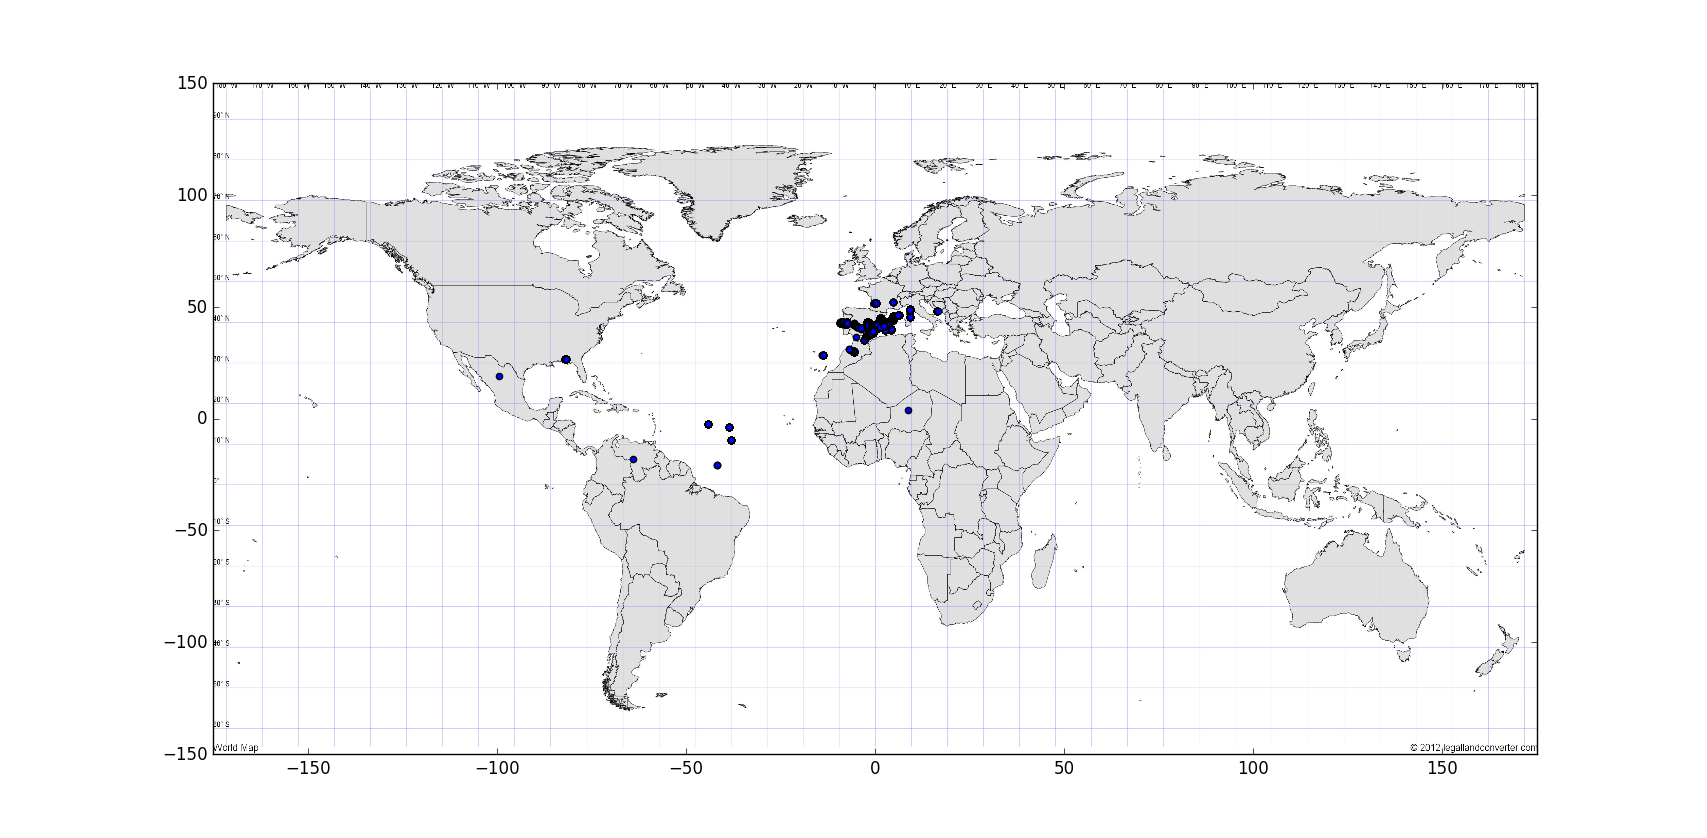
User locations
-
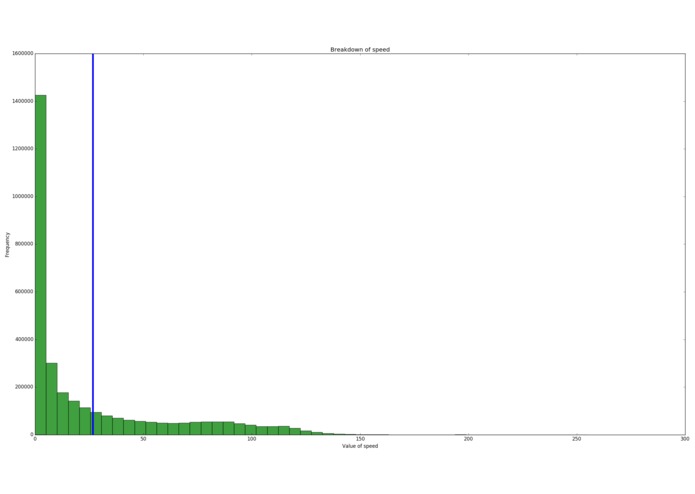
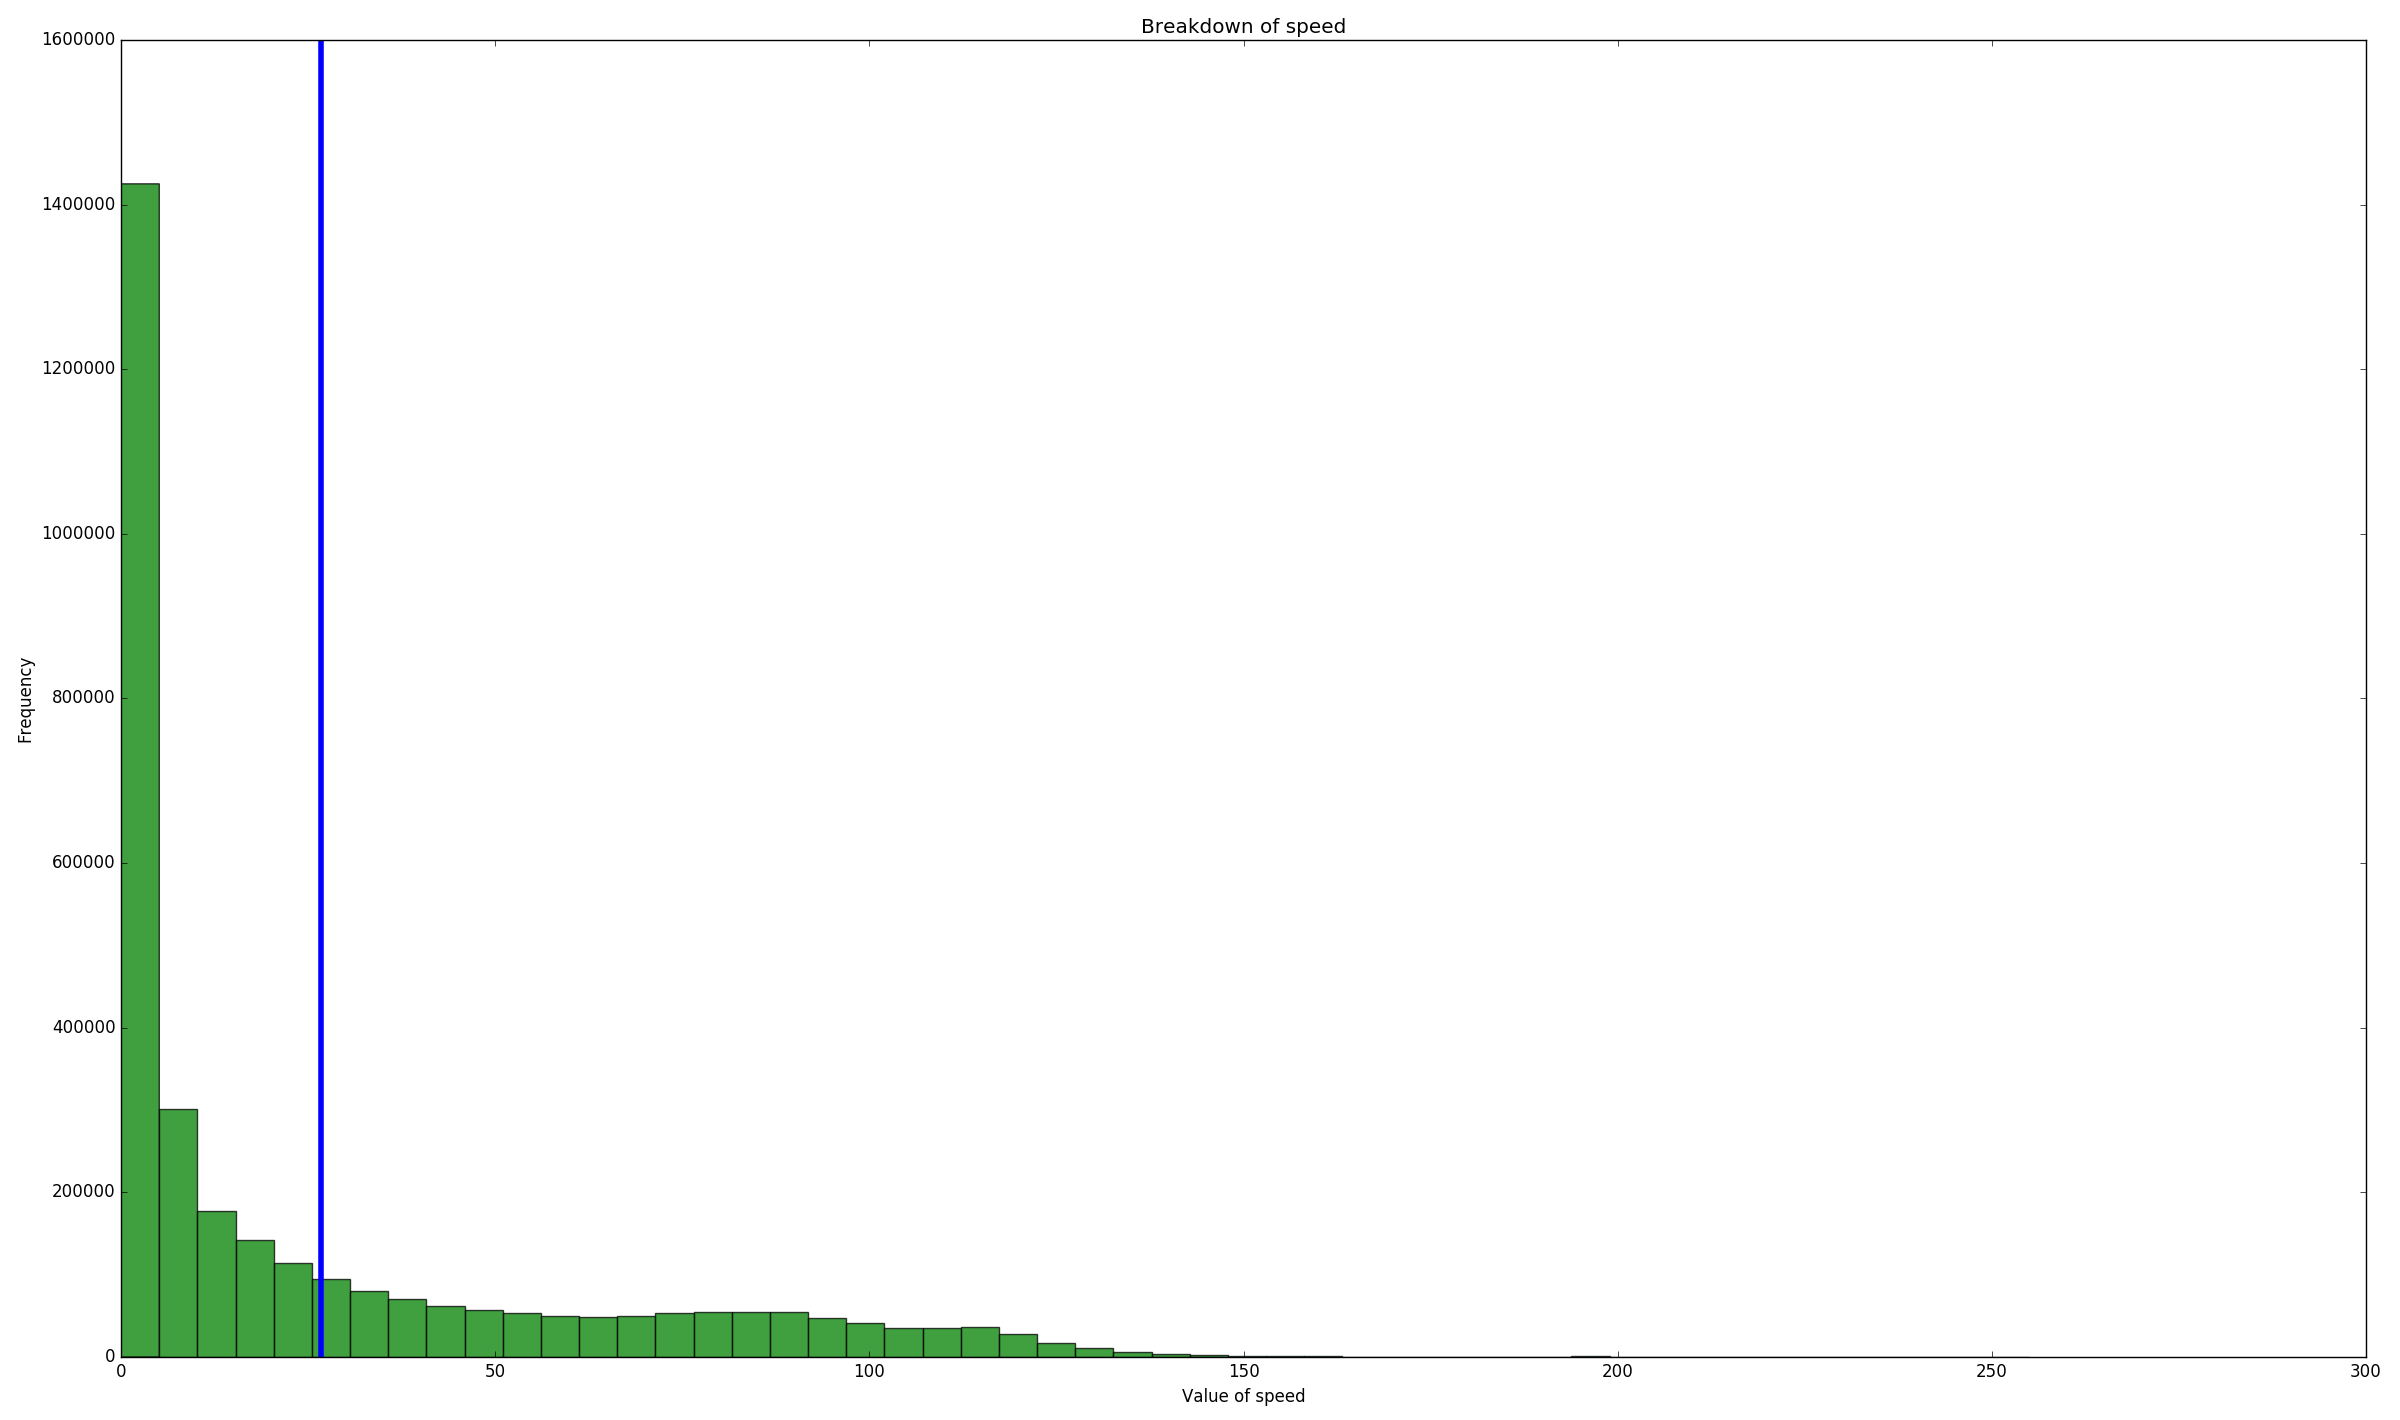
Speed data (lots of people speeding)
-
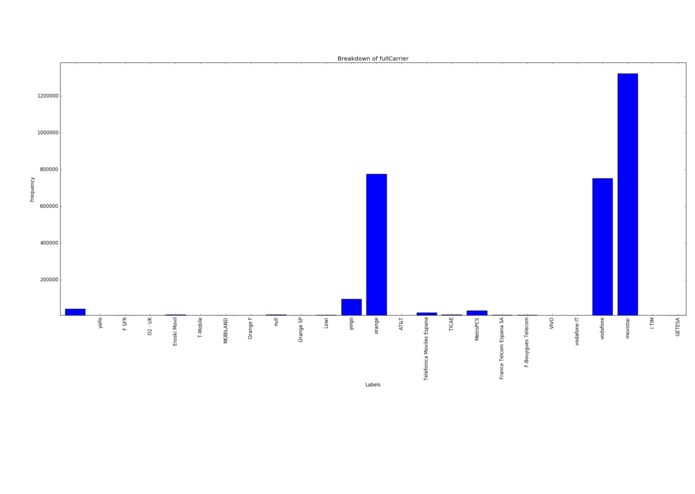
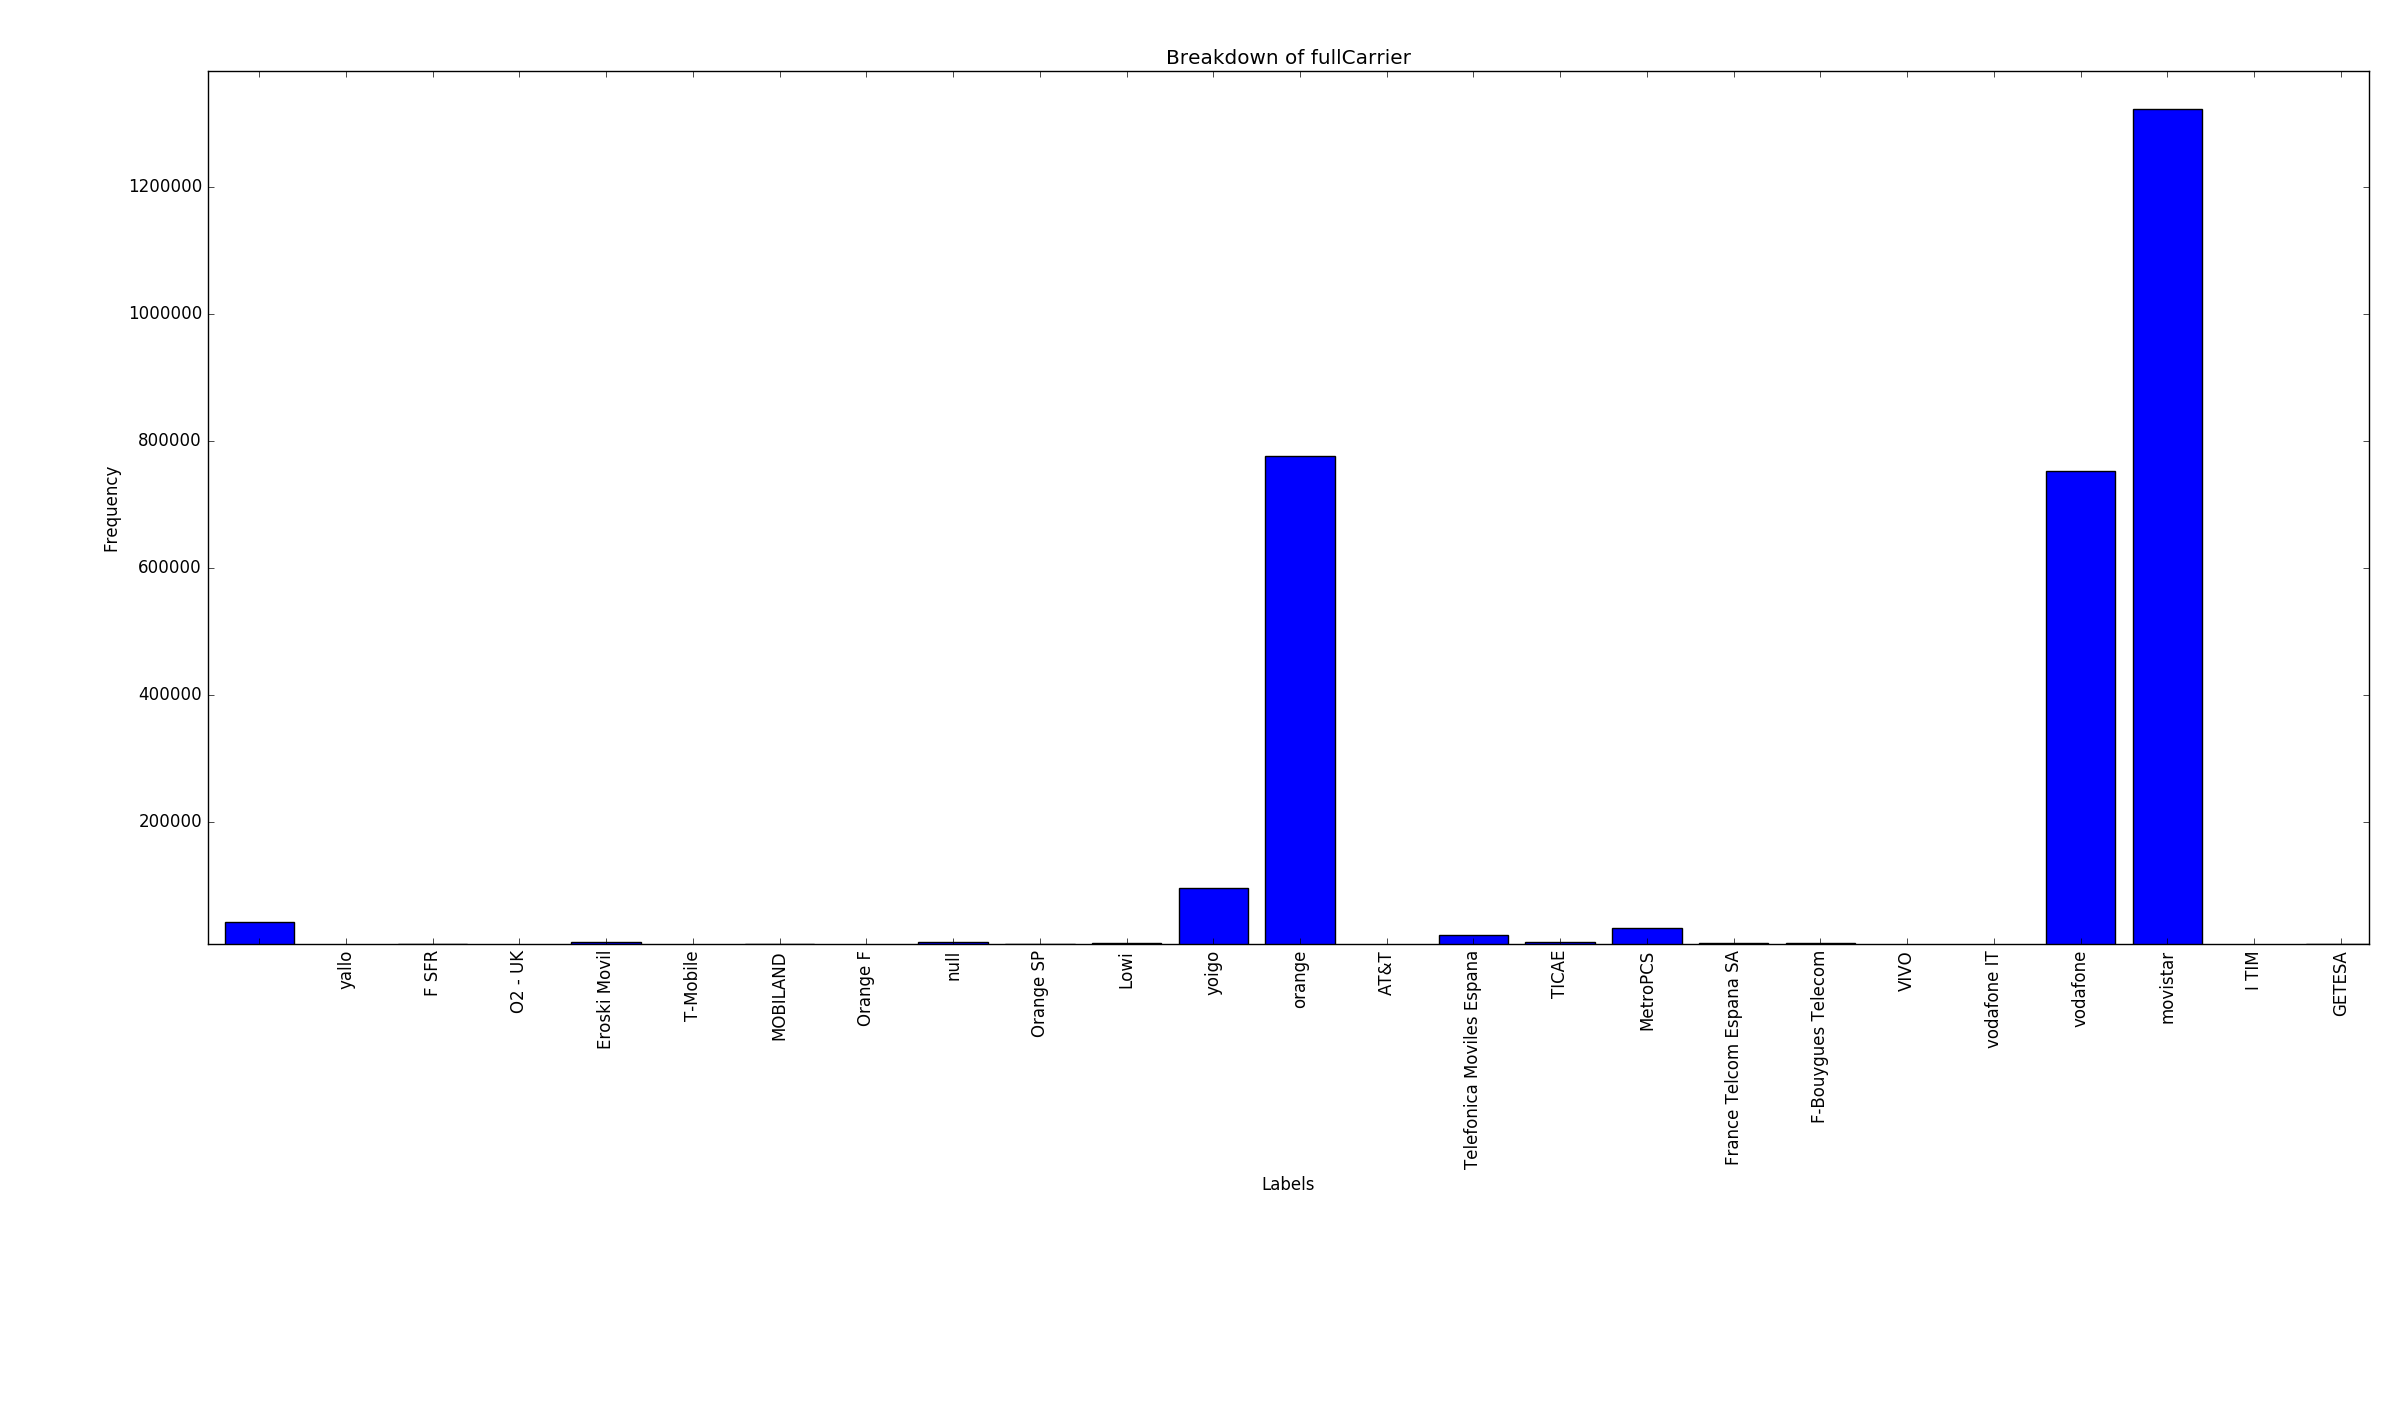
Carrier breakdown
-
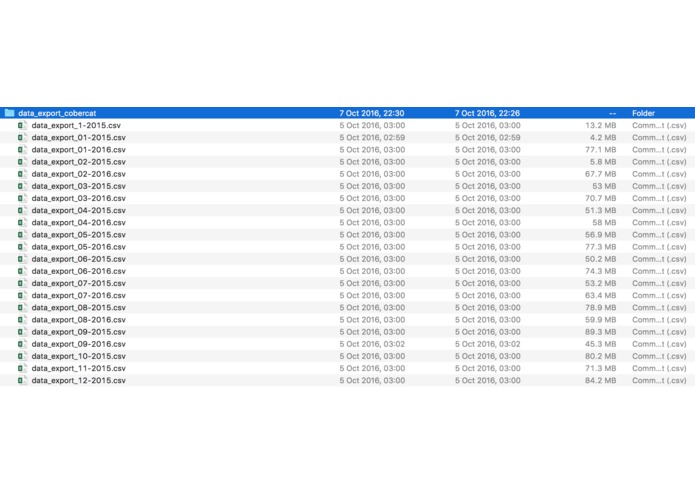
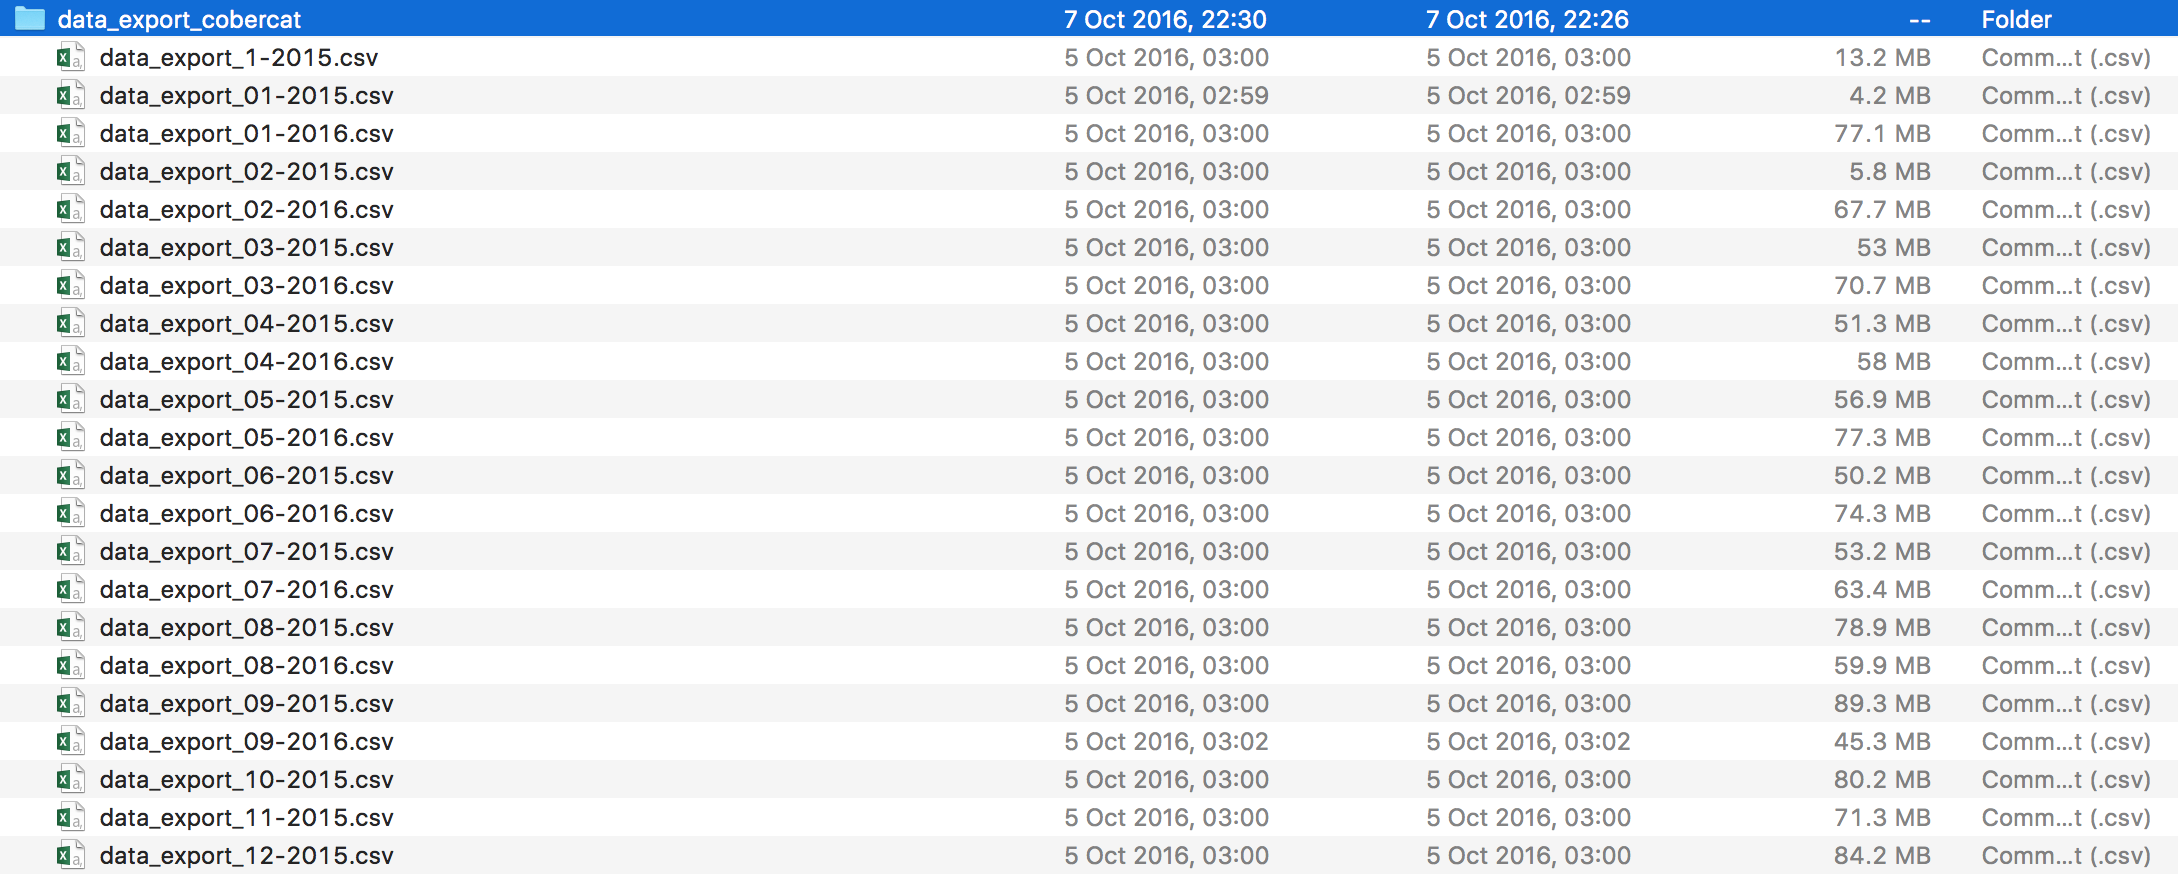
Raw Data files
-
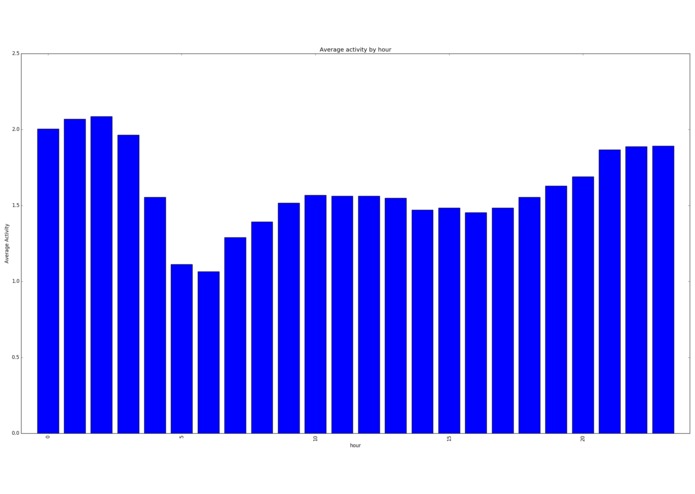
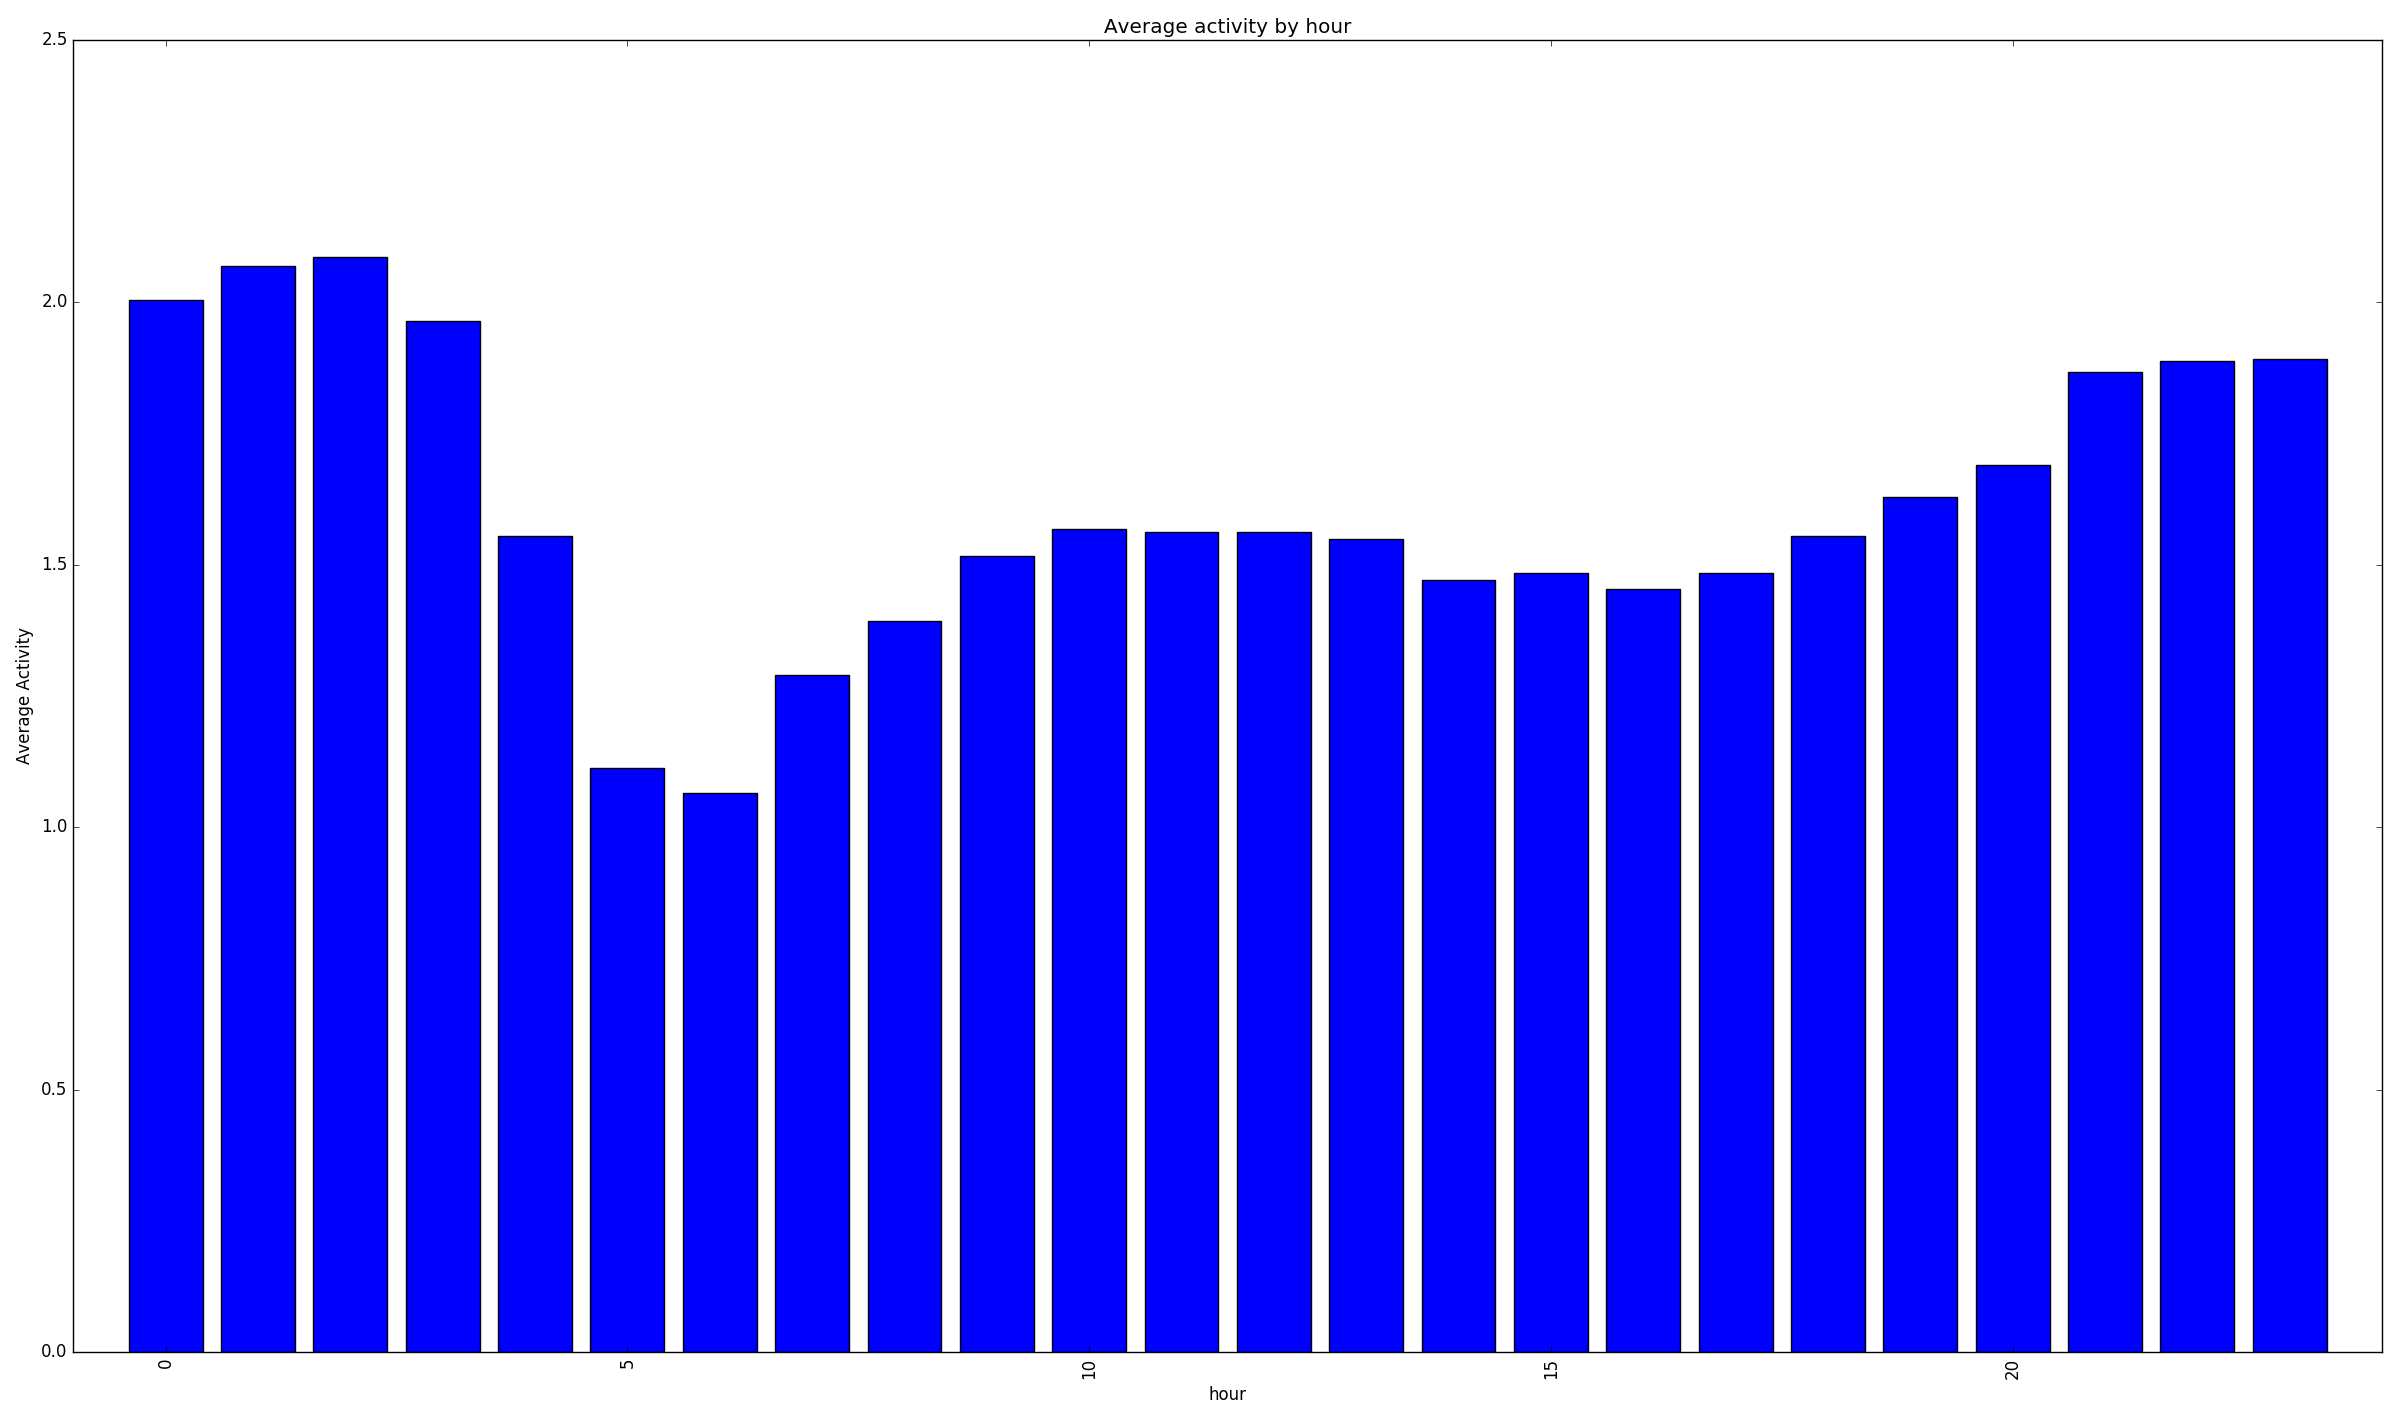
Average Activity per hour
-
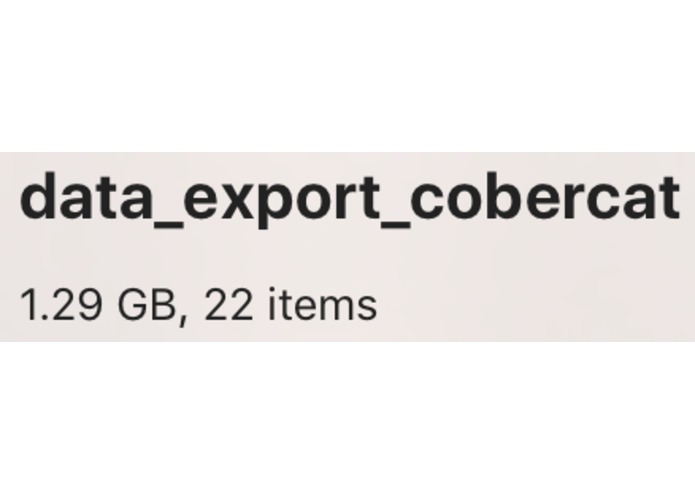
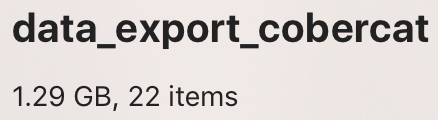
Size of raw data
-
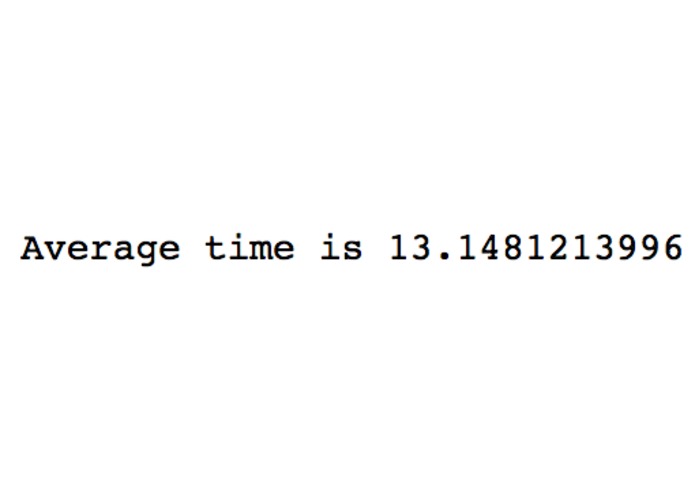
Average time
-
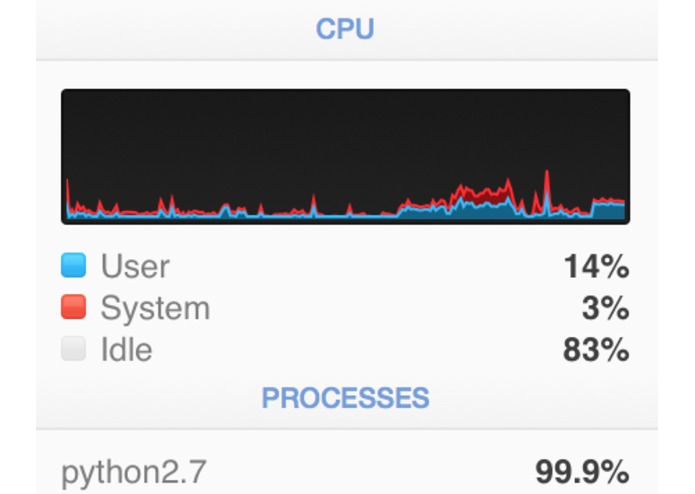
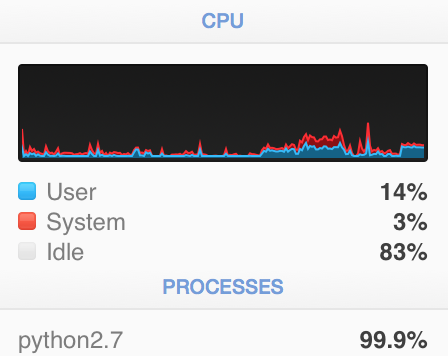
My poor CPU
-
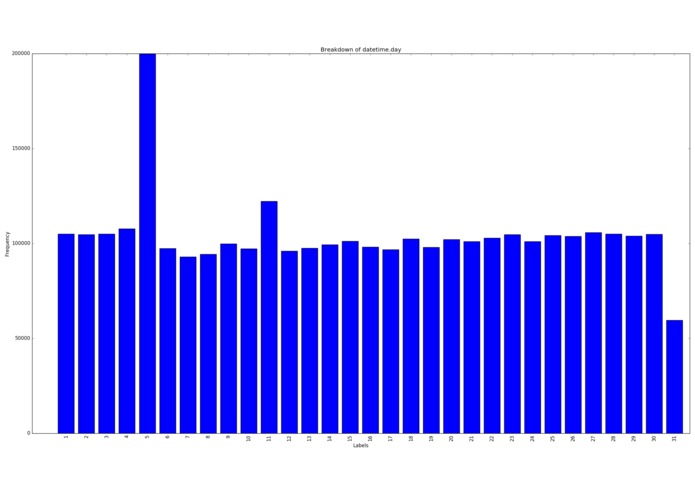
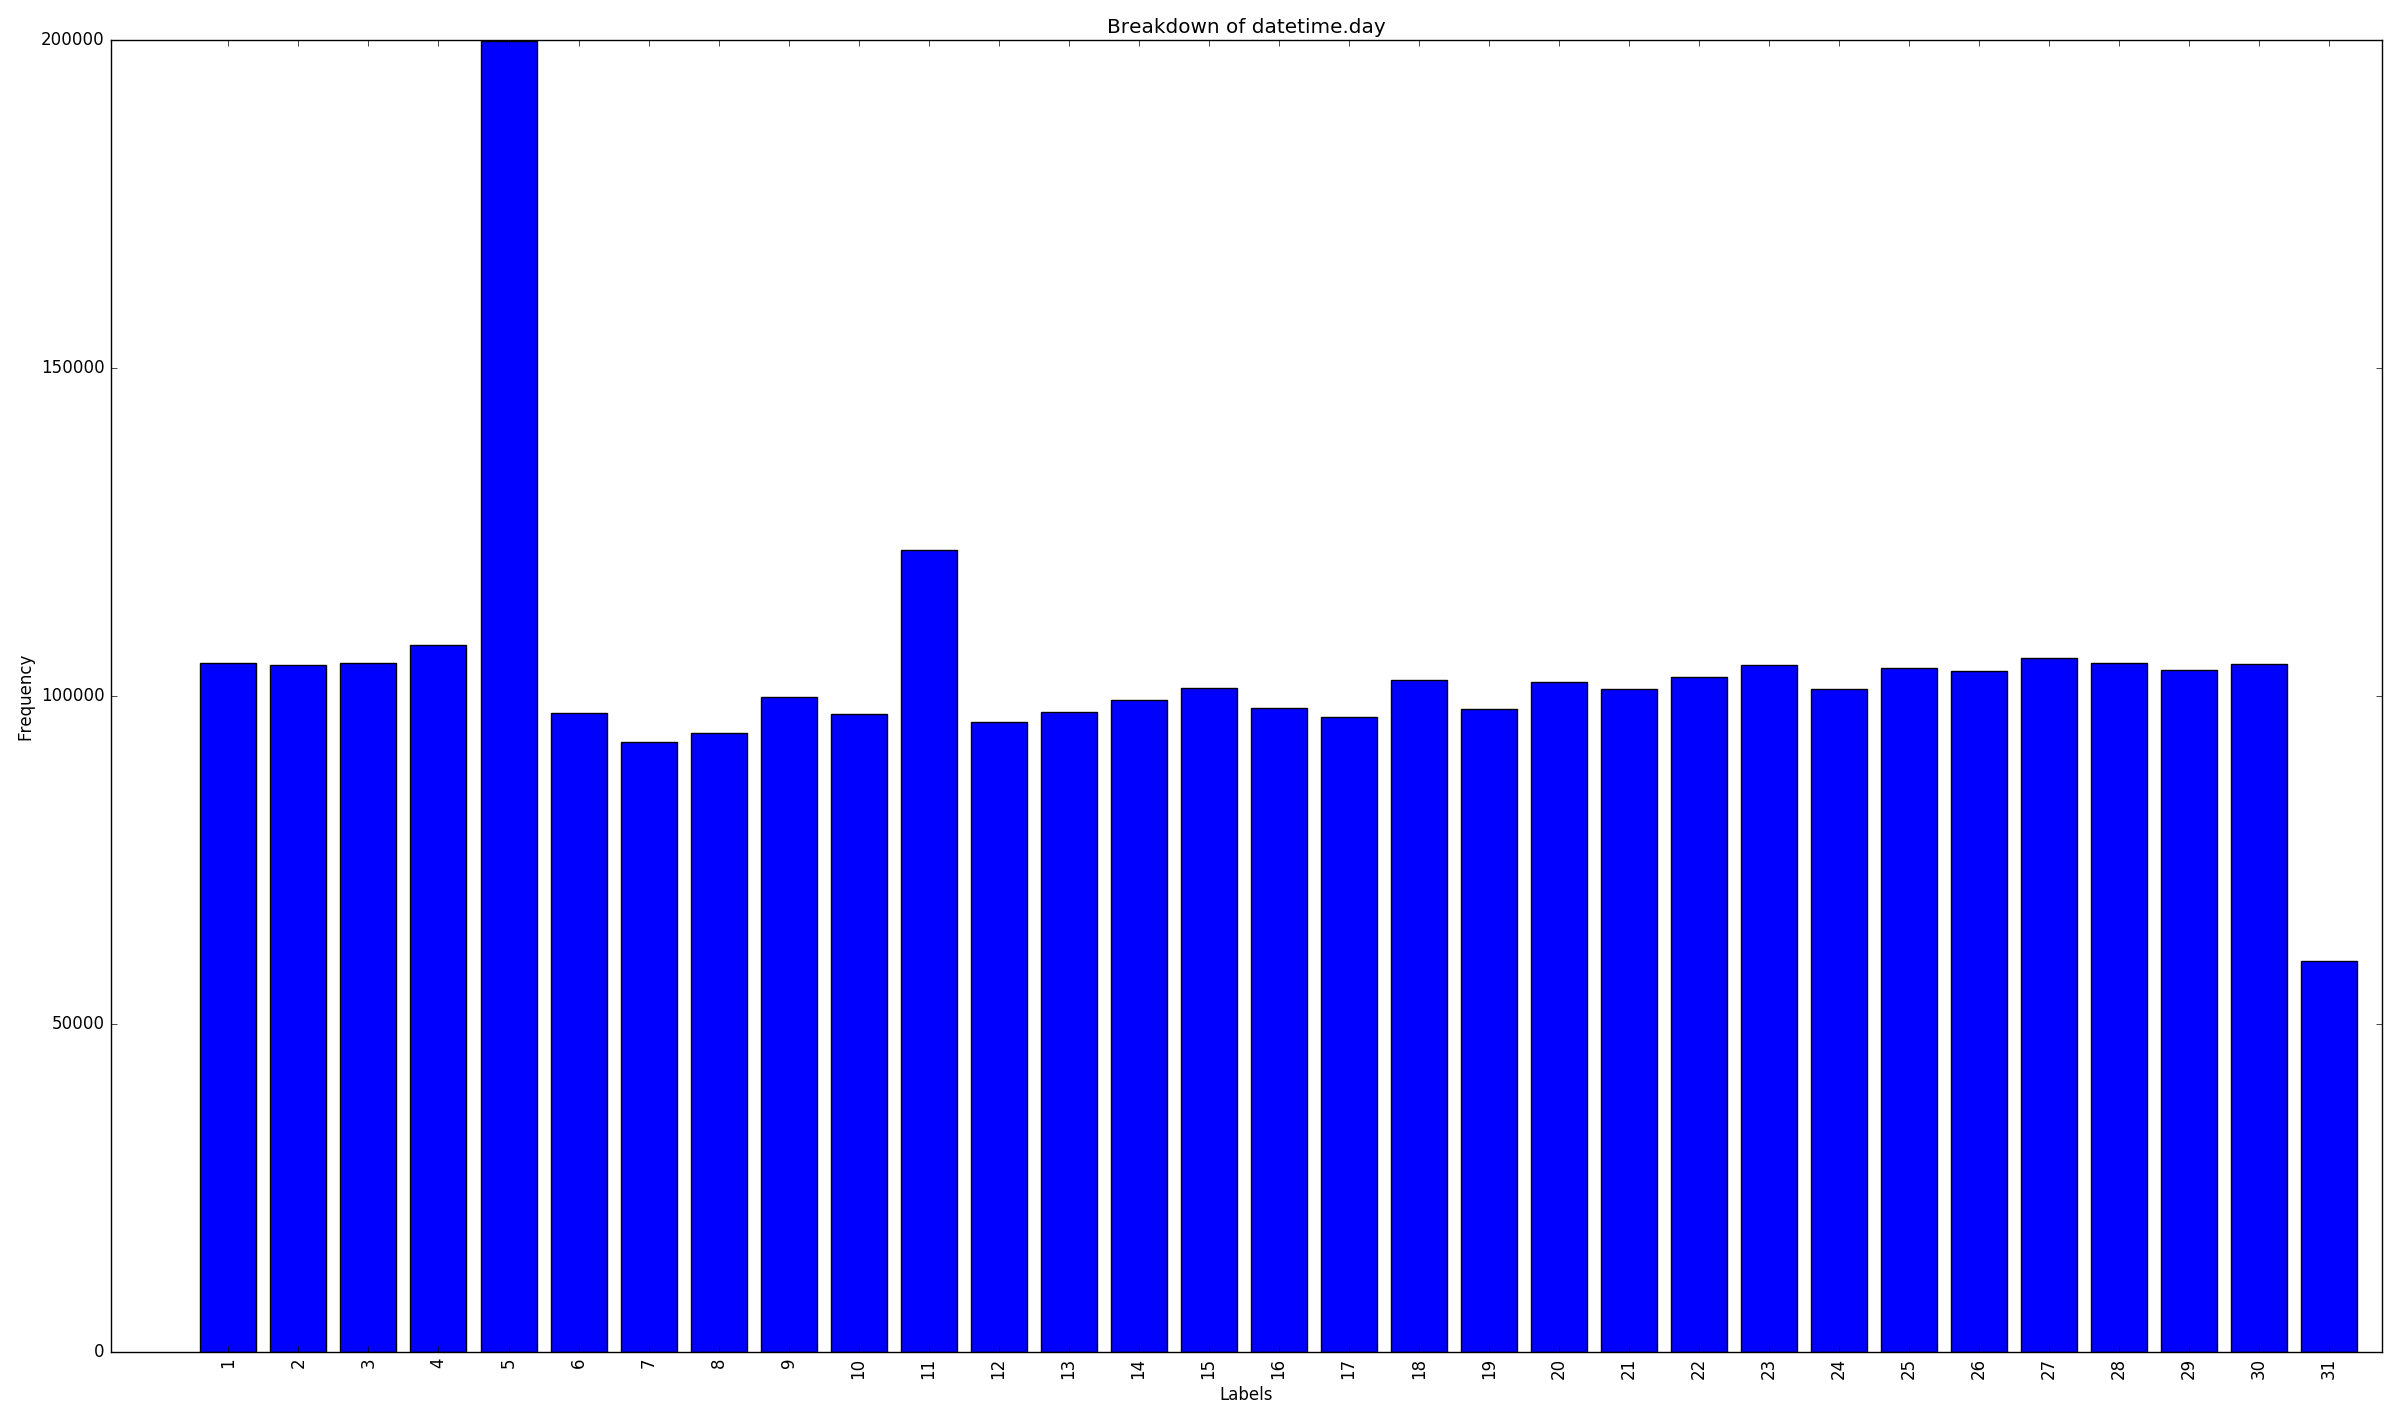
Samples per day of month
-
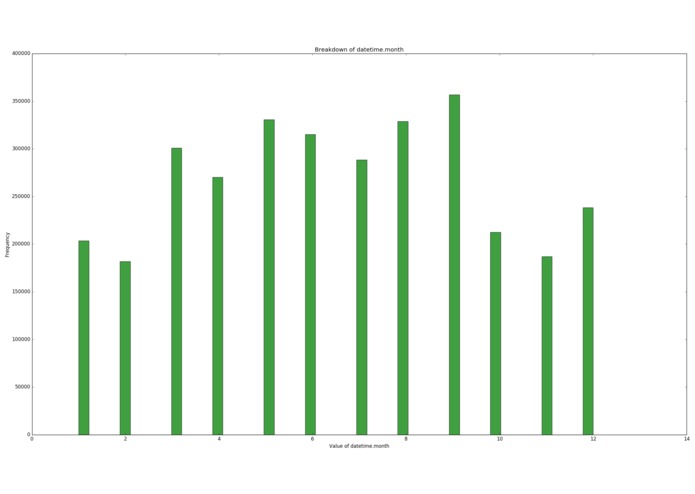
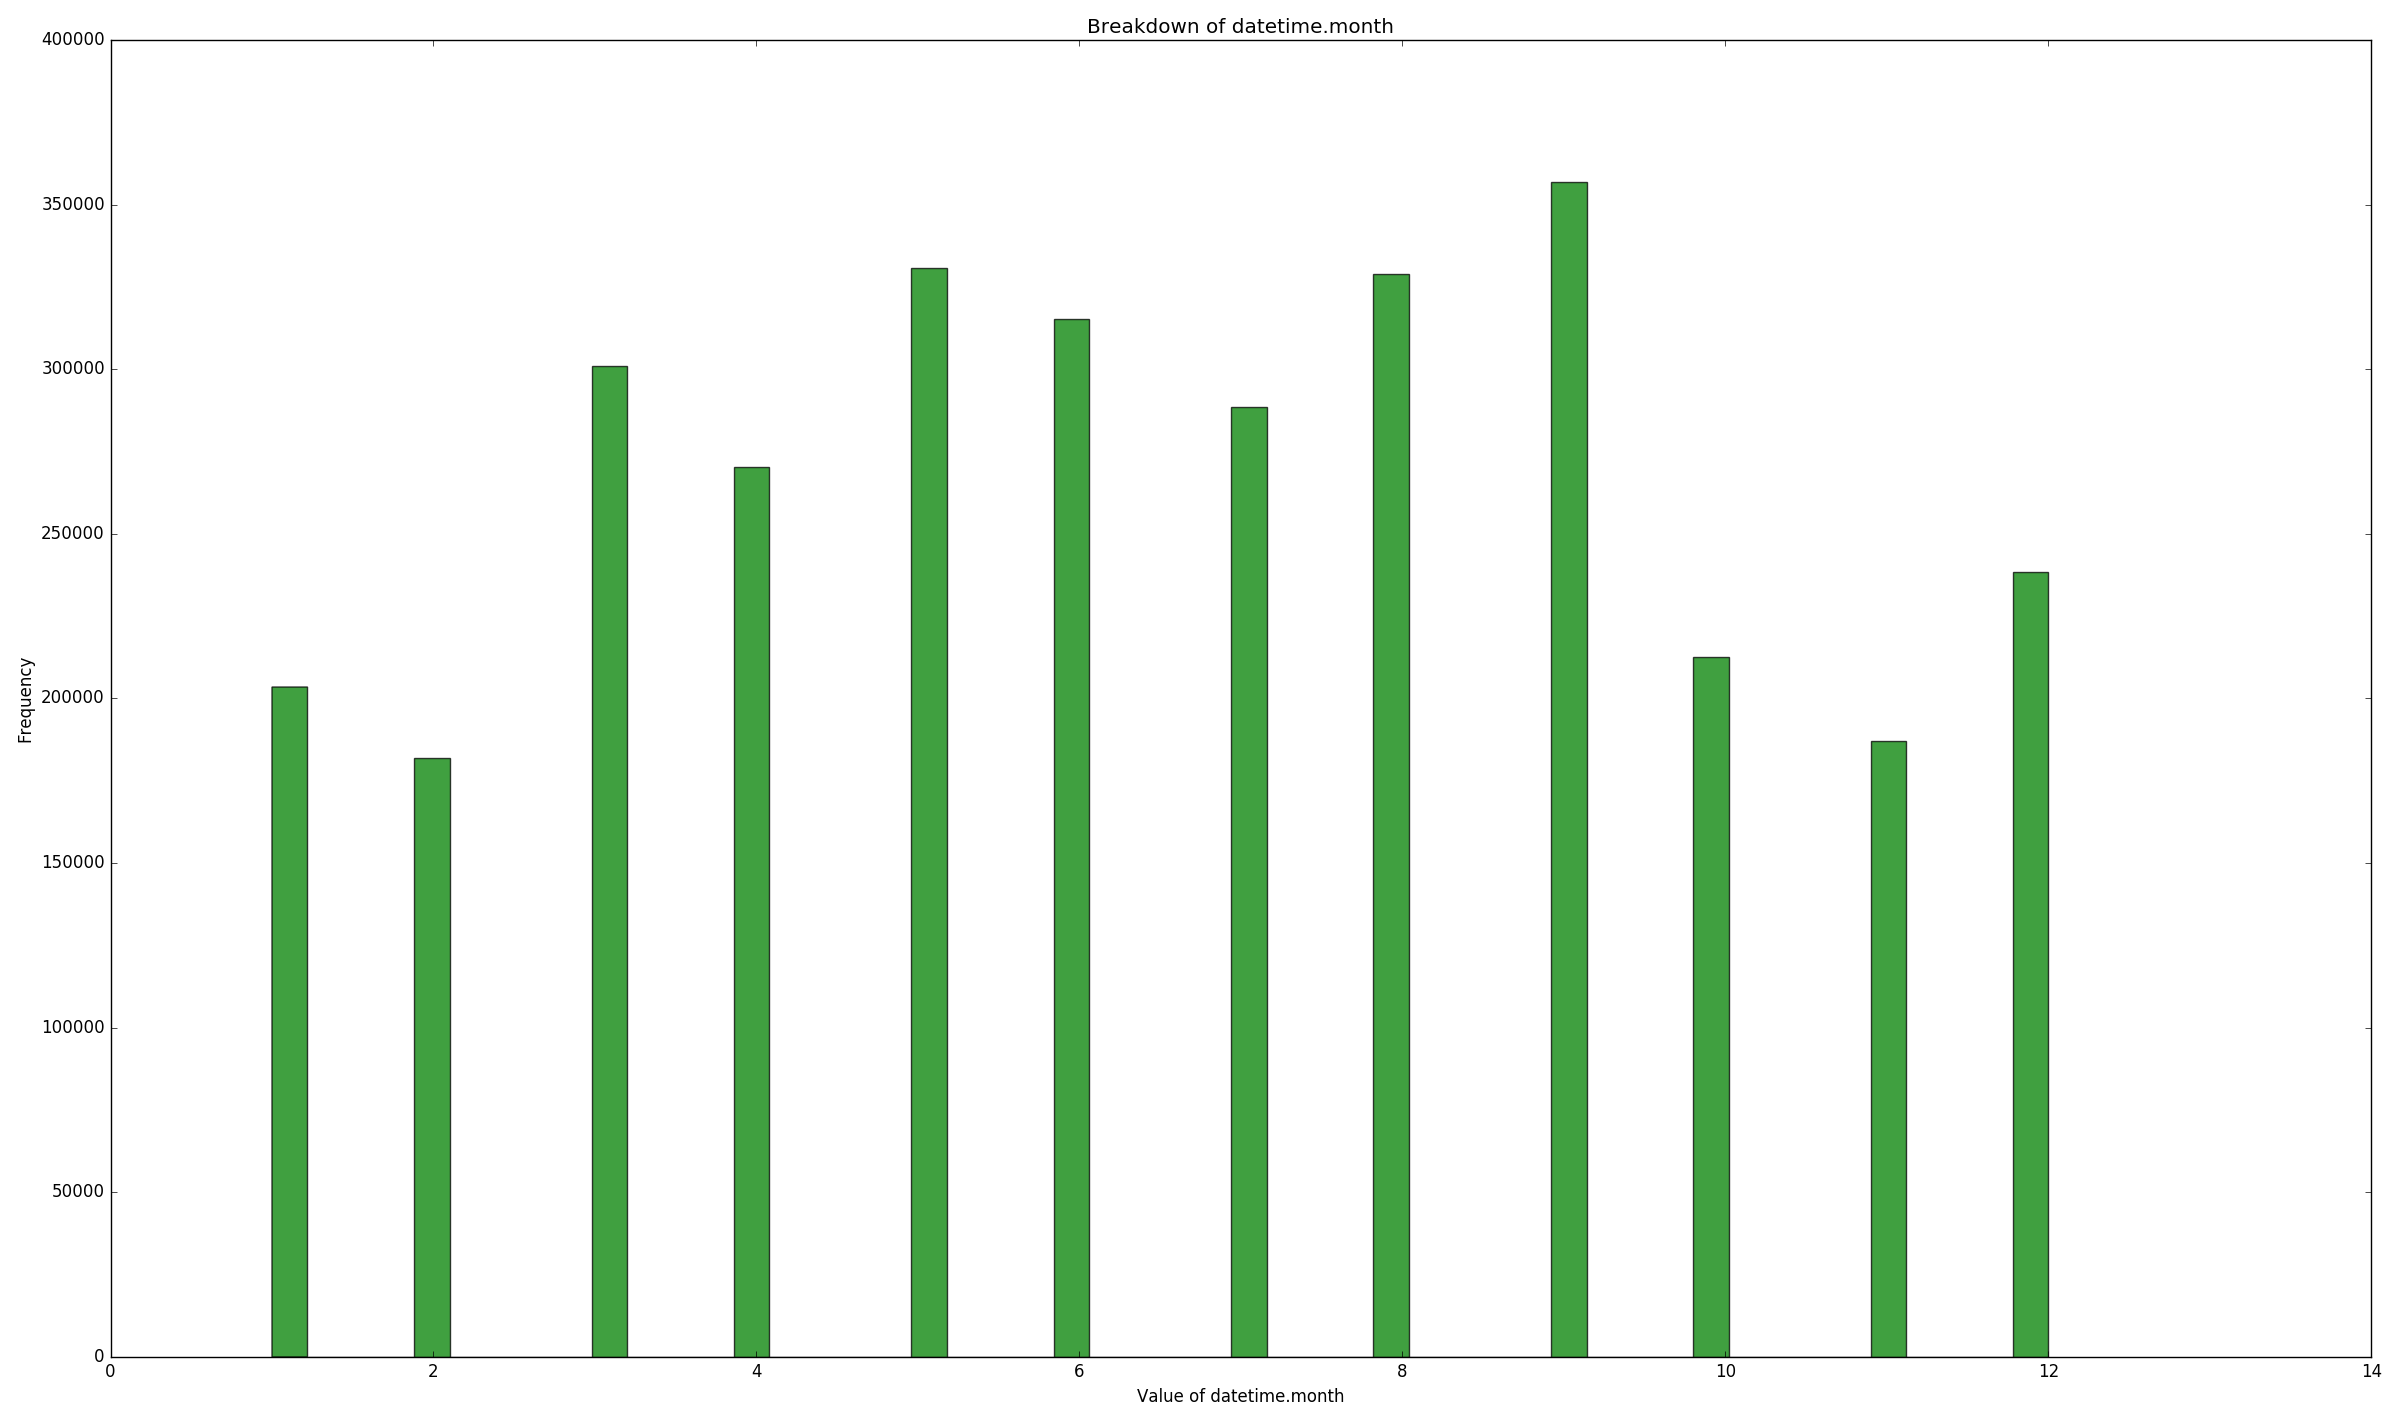
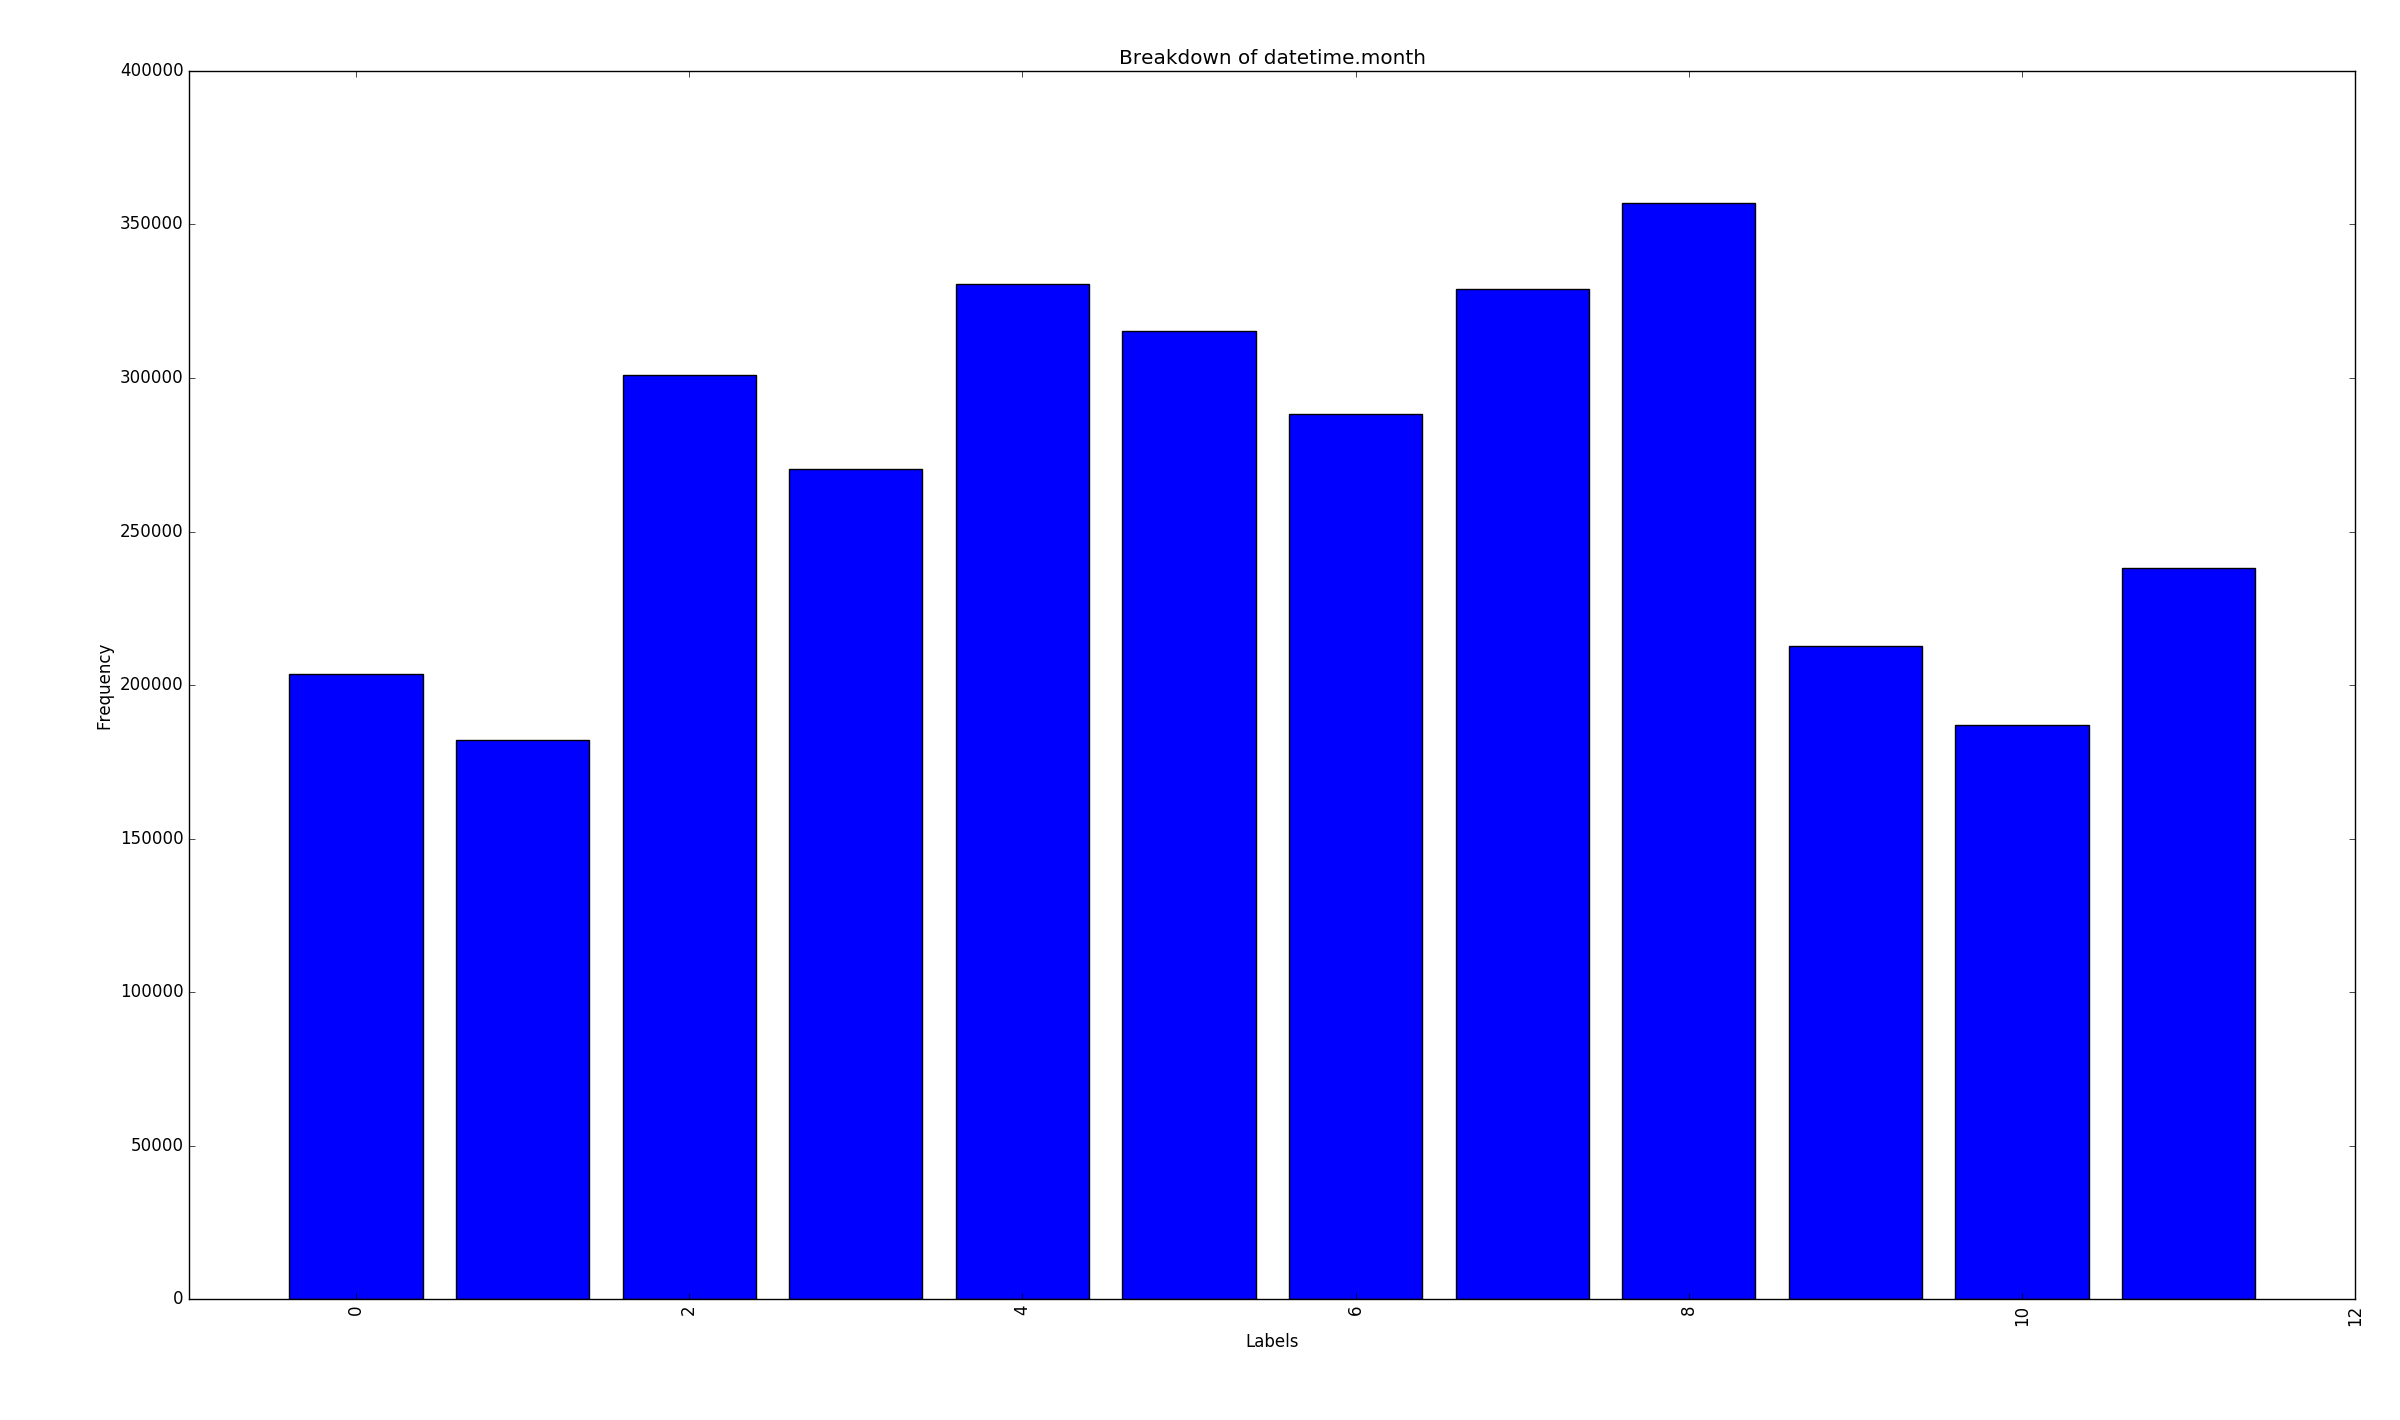
Samples per month
-
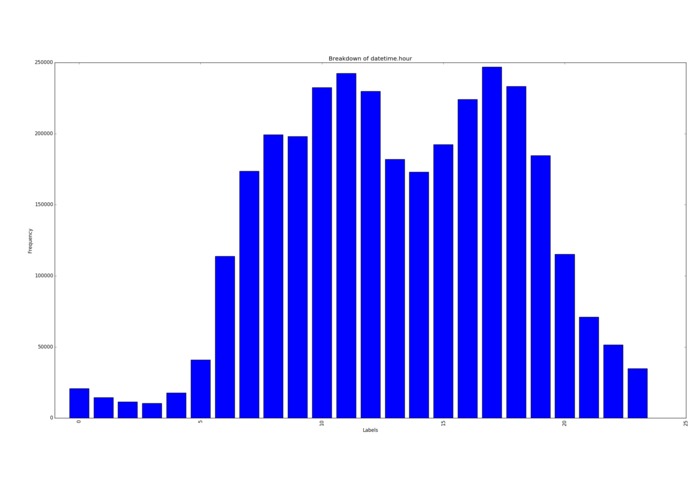
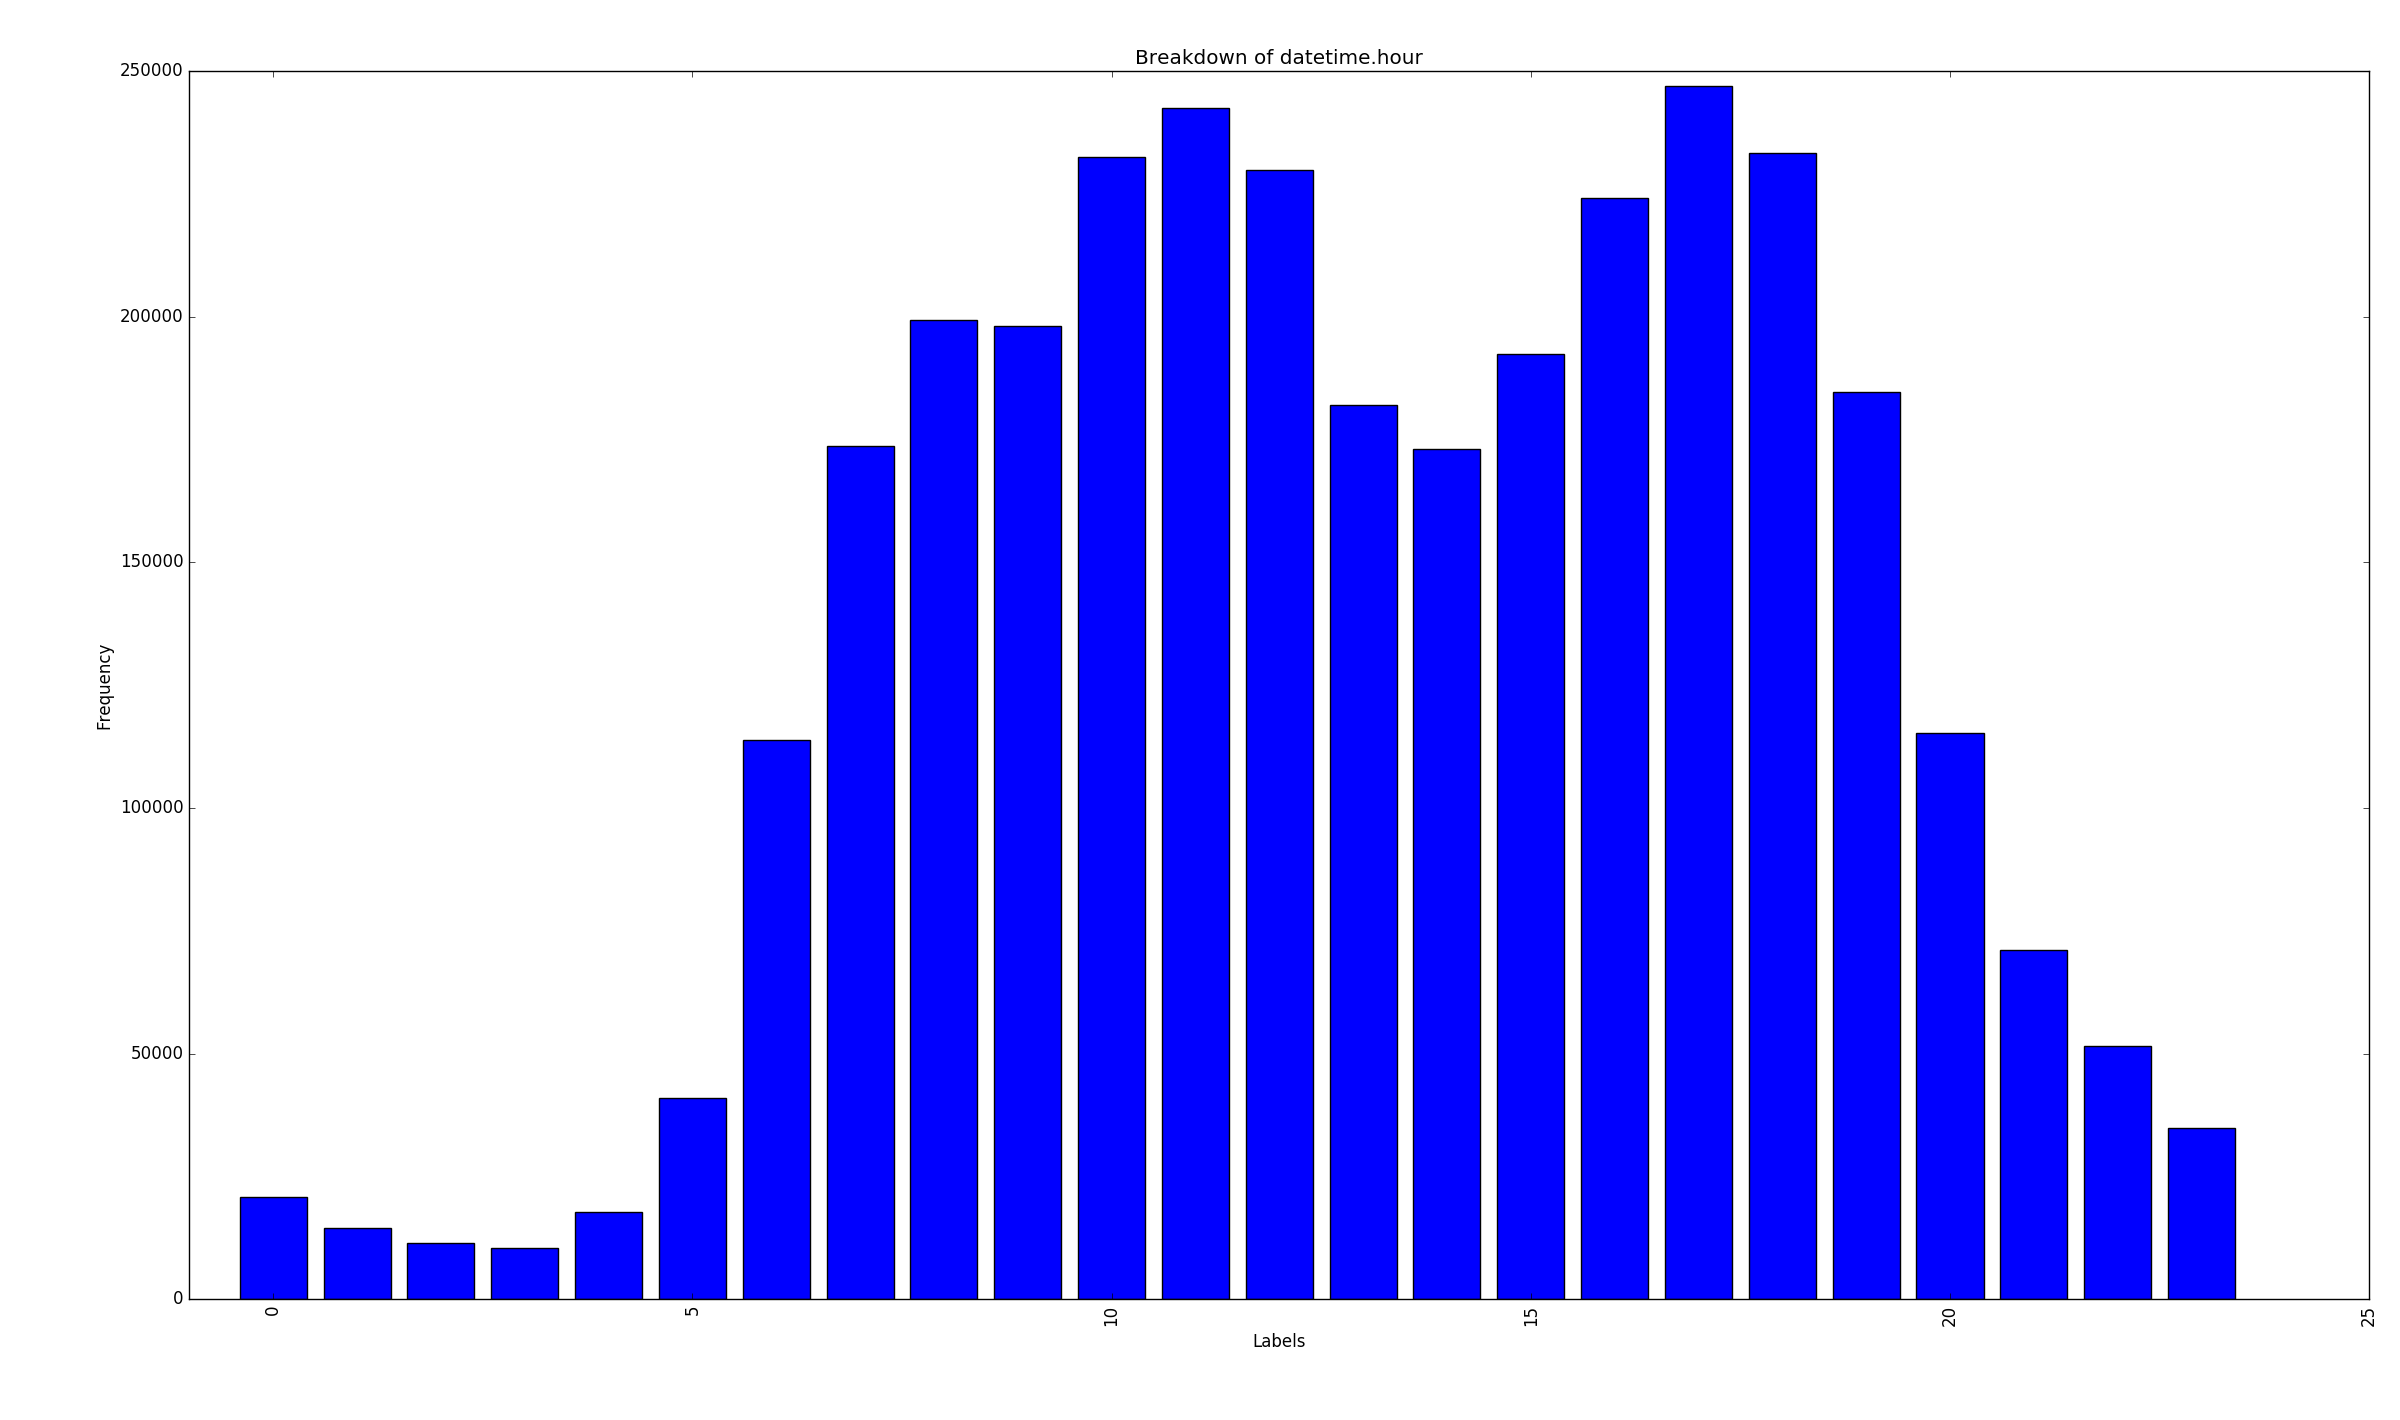
Samples per hour
-
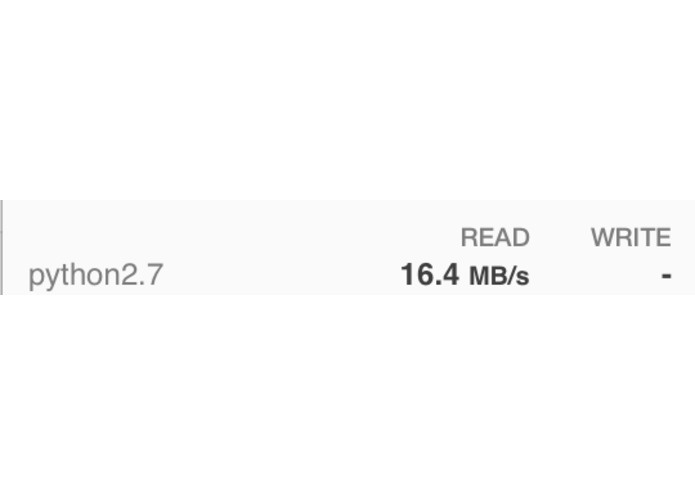
My poor SSD
-
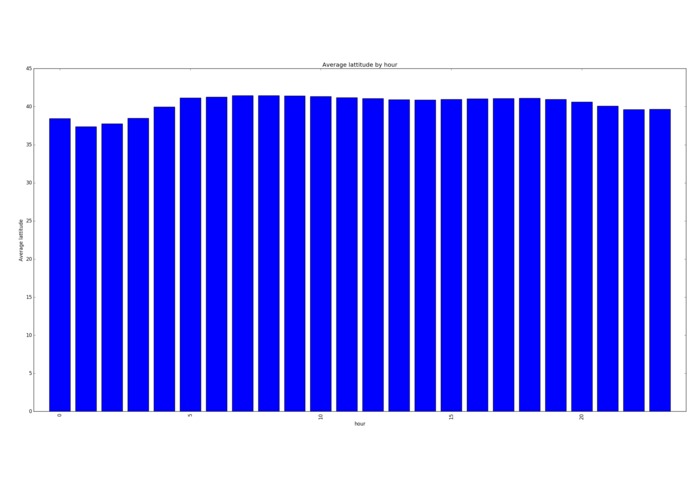
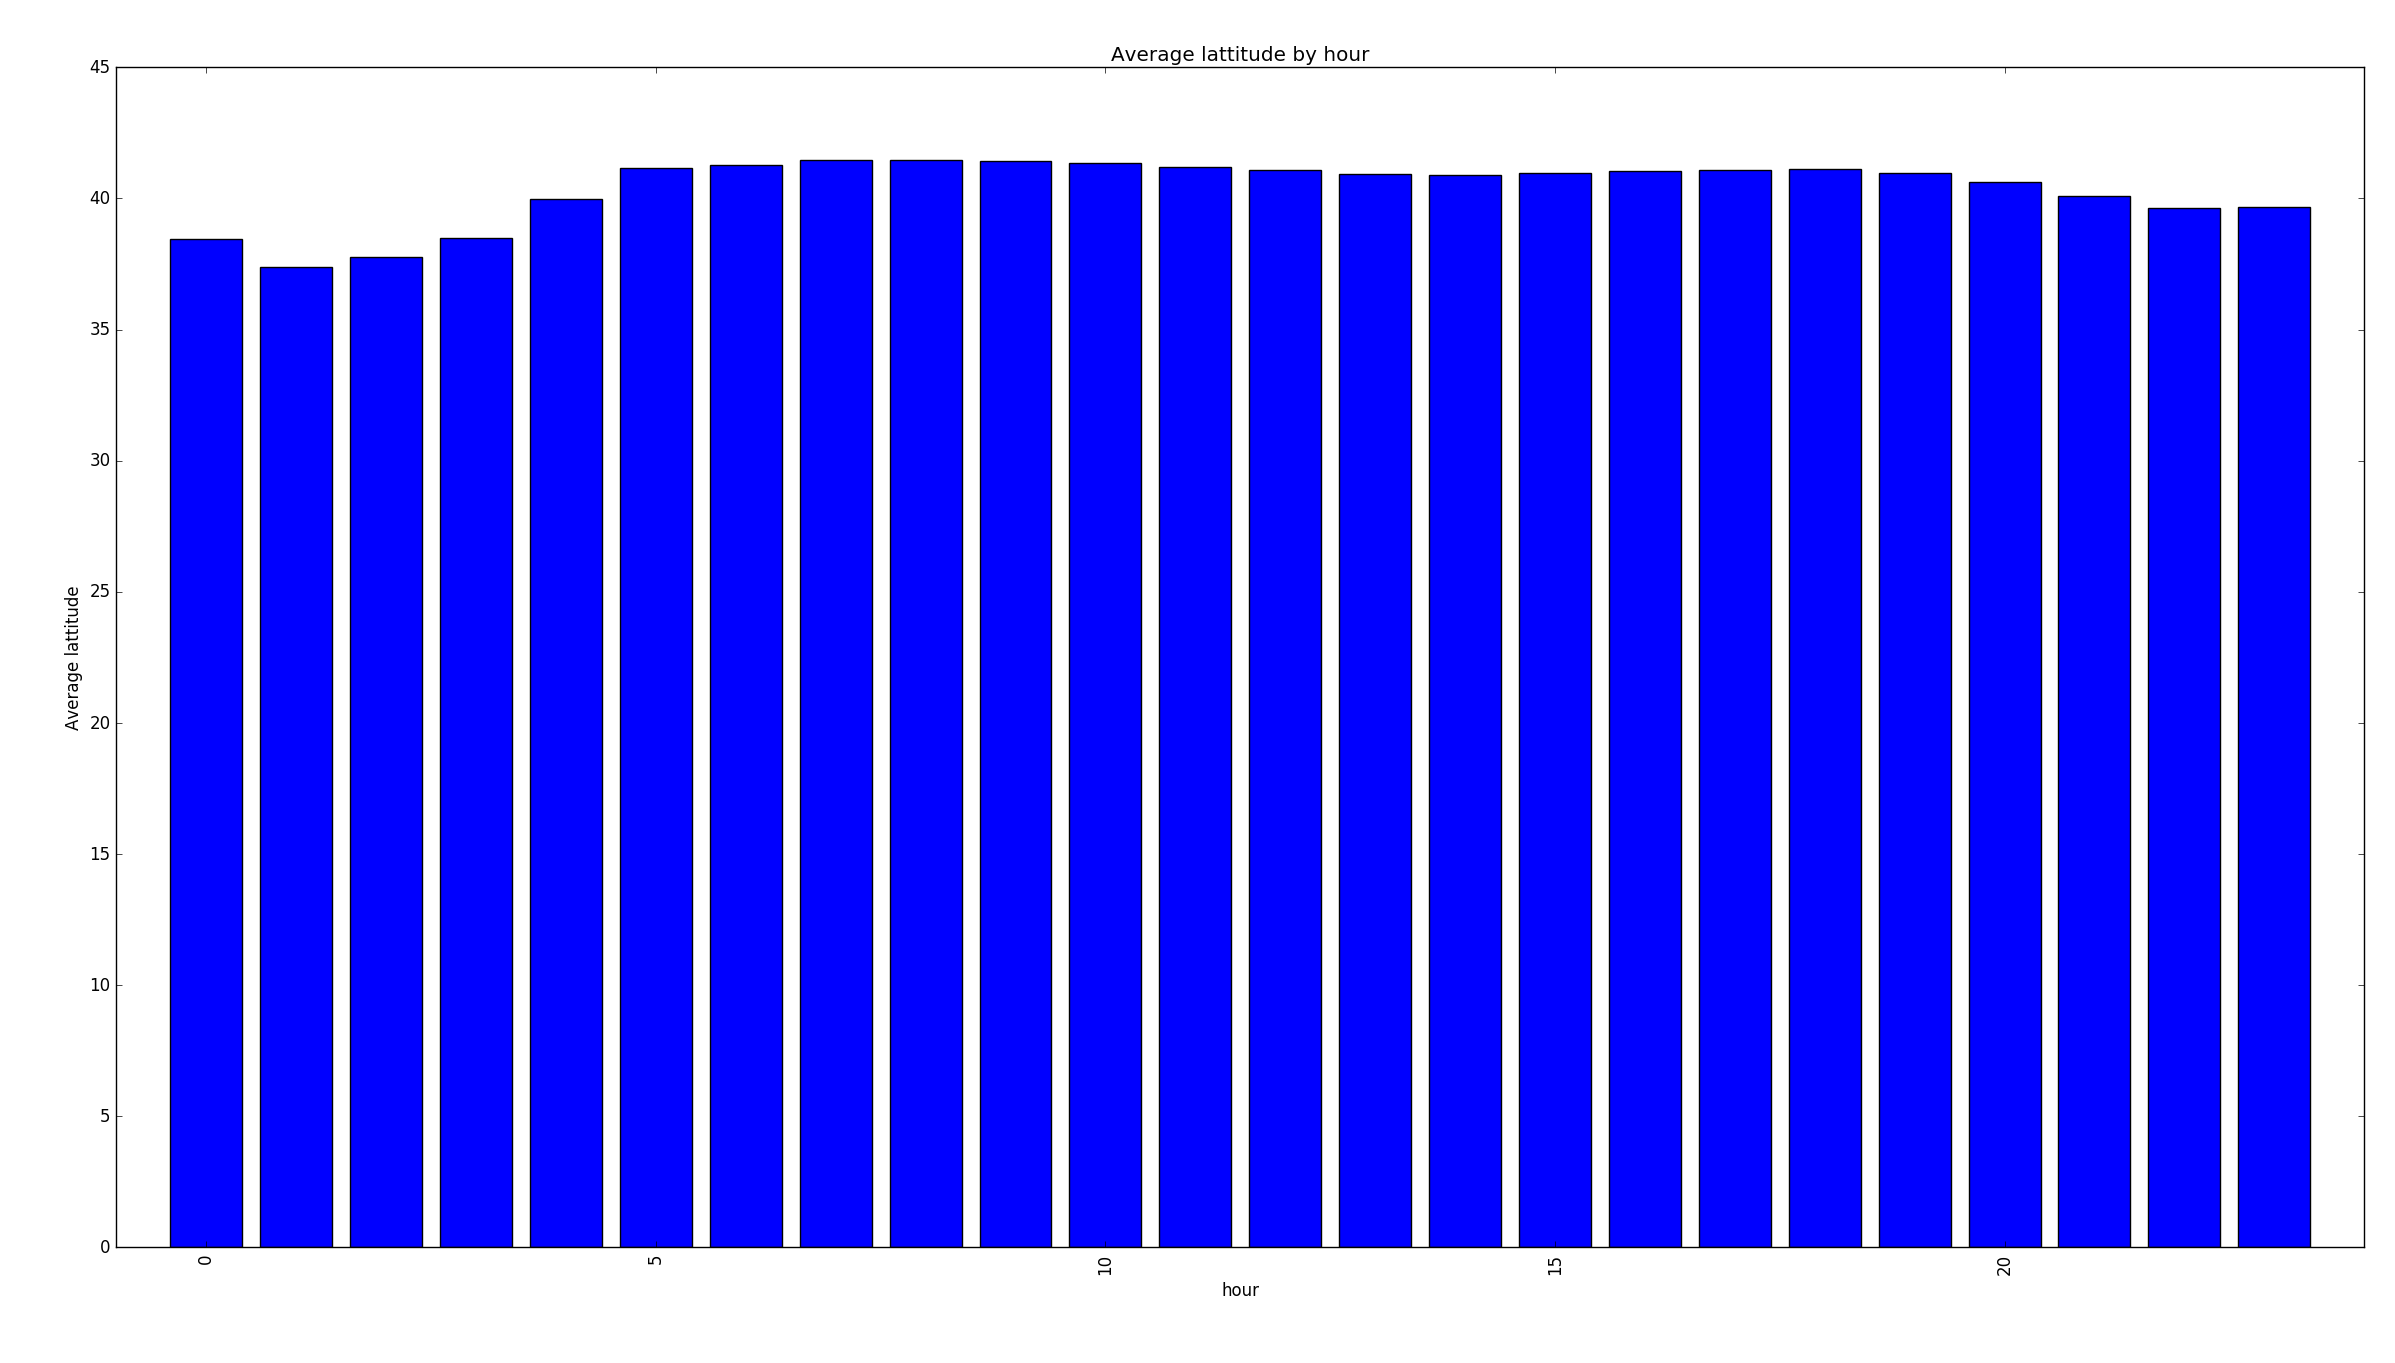
Average lattitude per hour
-
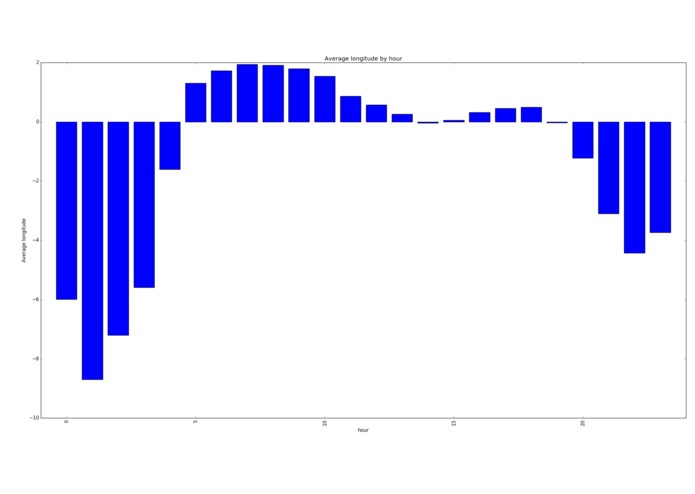
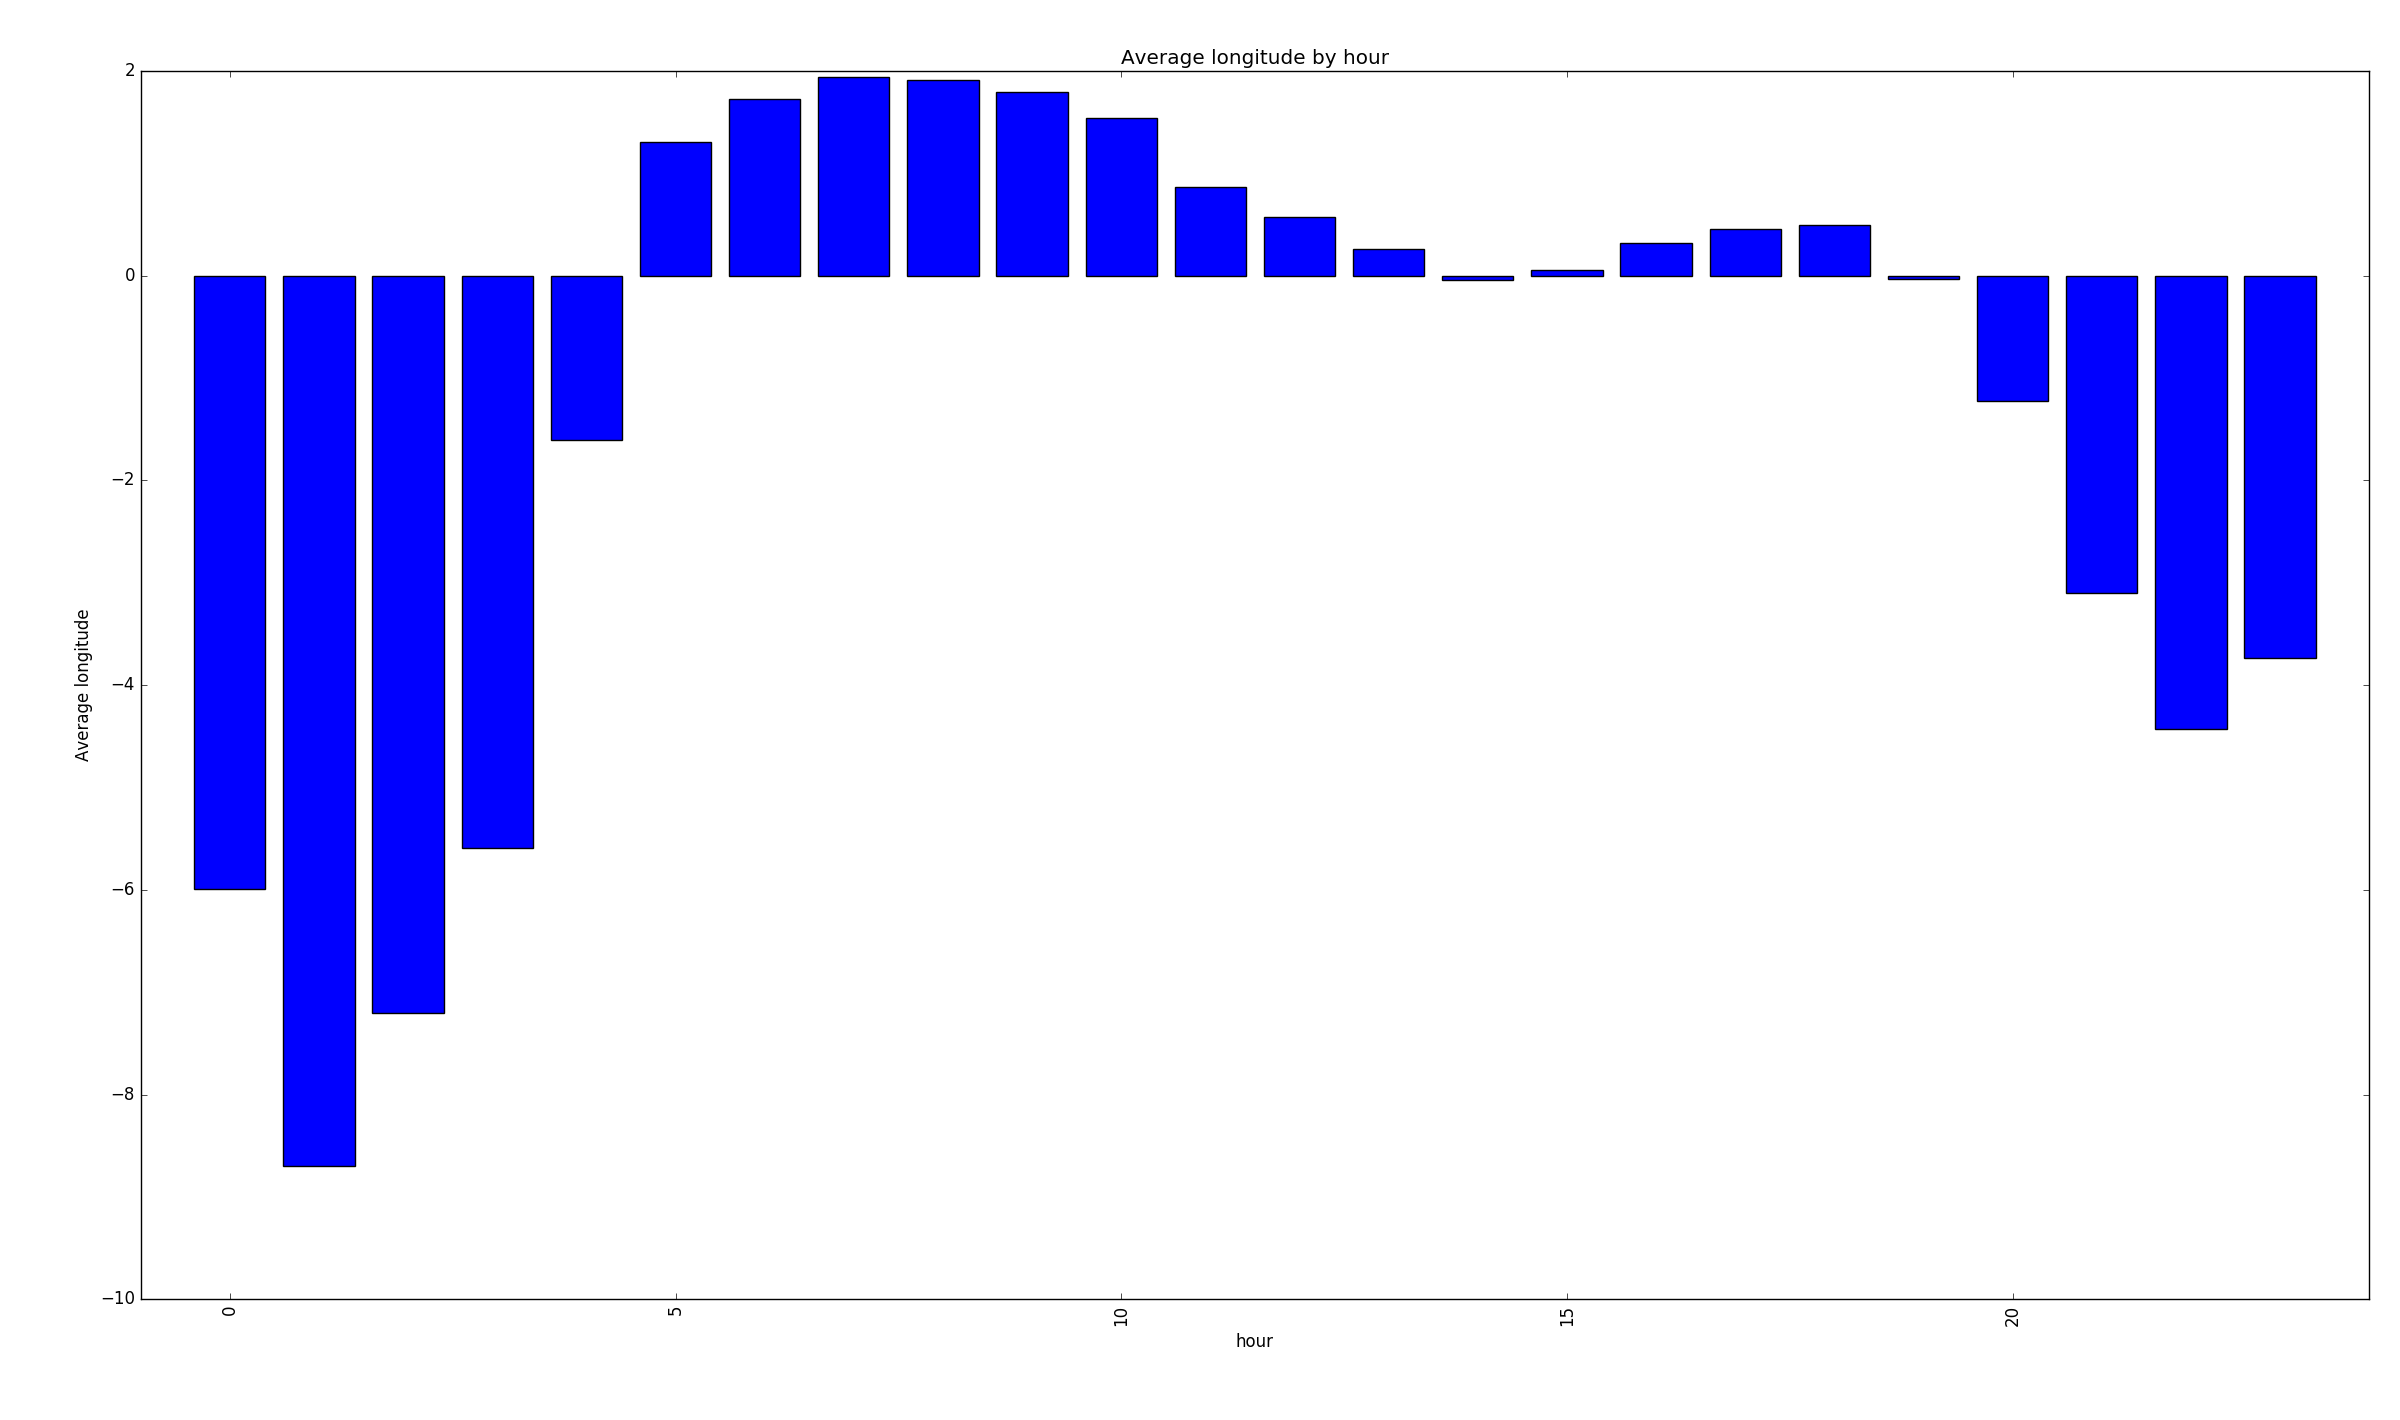
Average longitude per hour (people in the west stay up later and get up later)
-
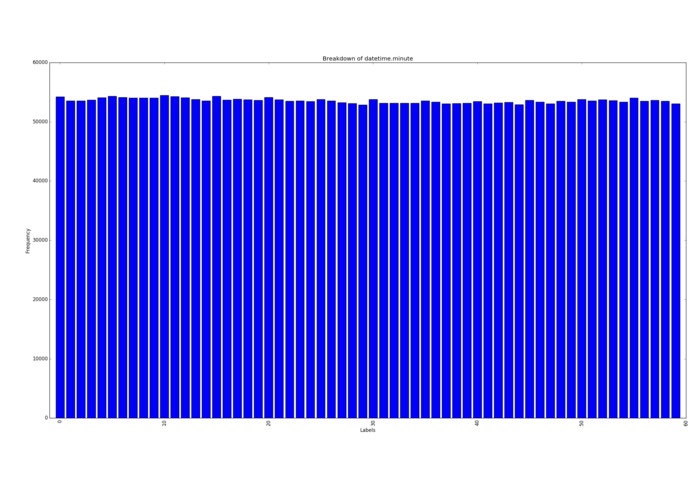
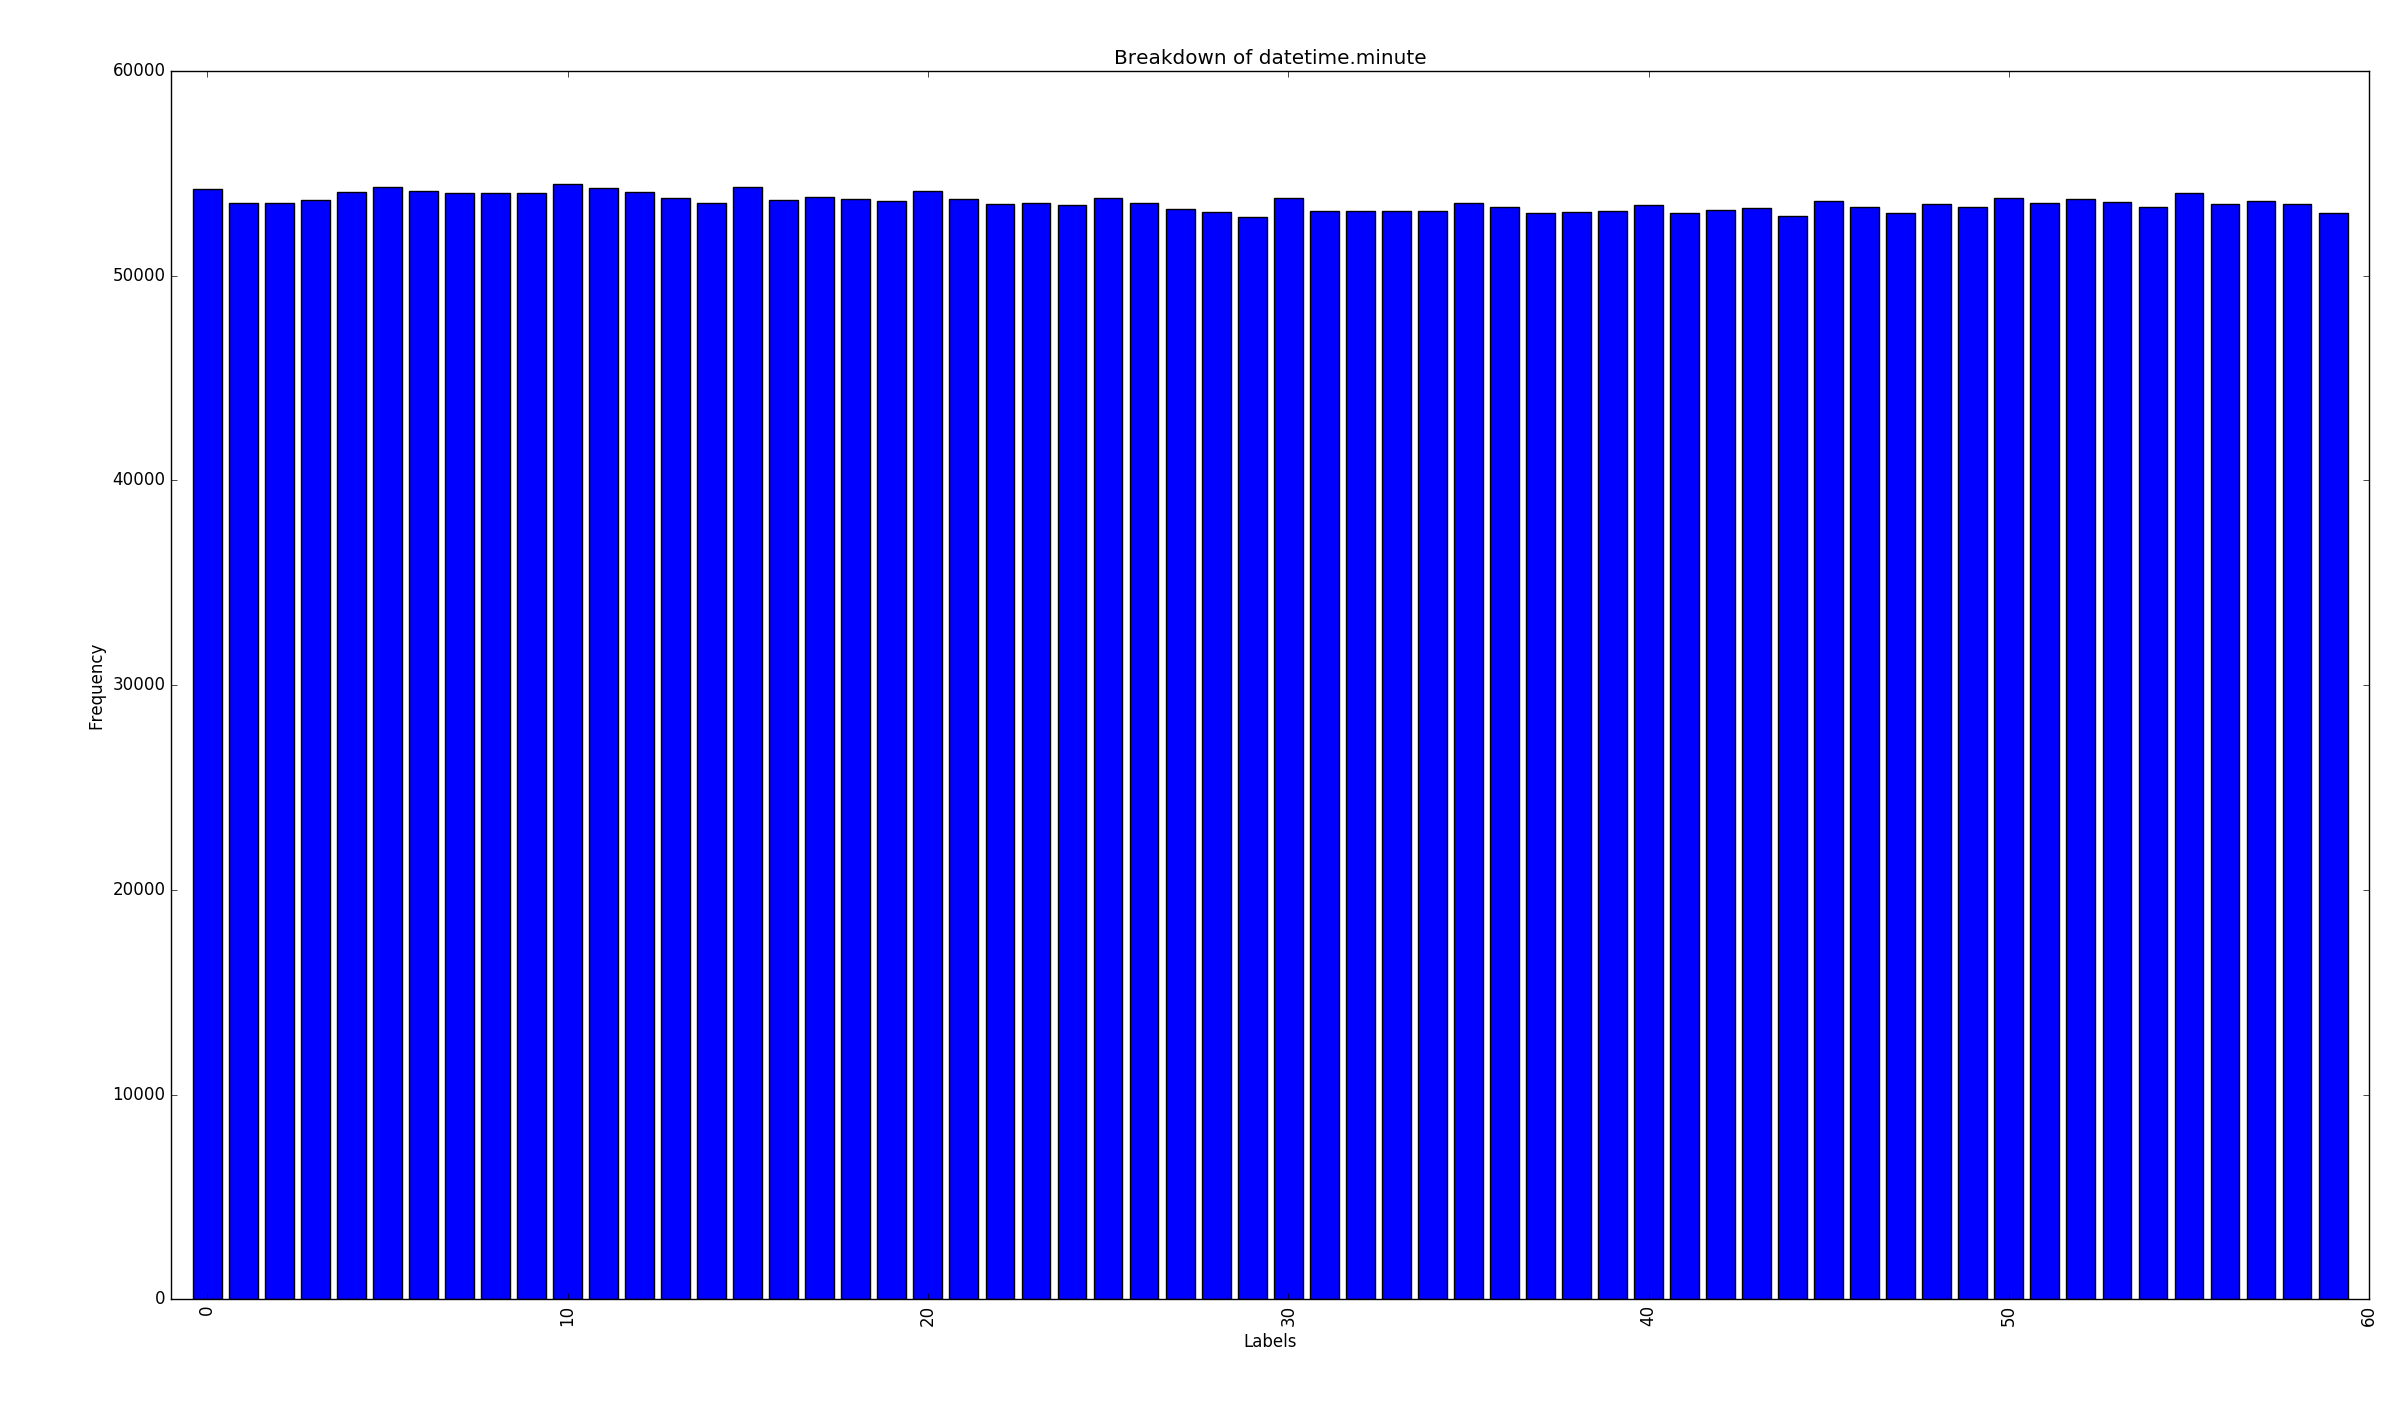
Samples per minute
-
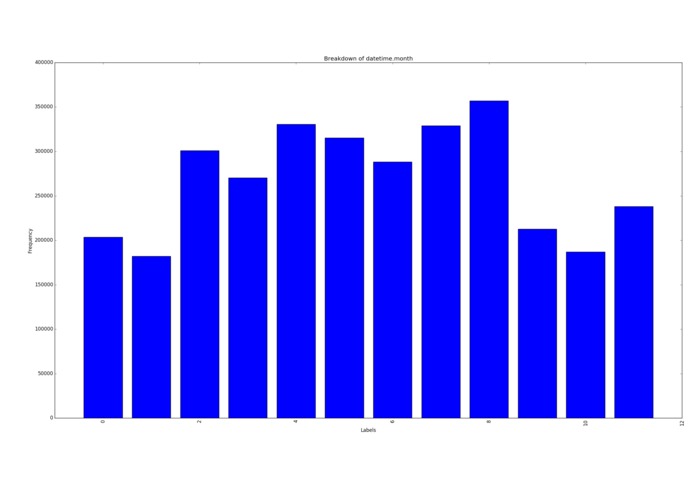
Samples per month
-
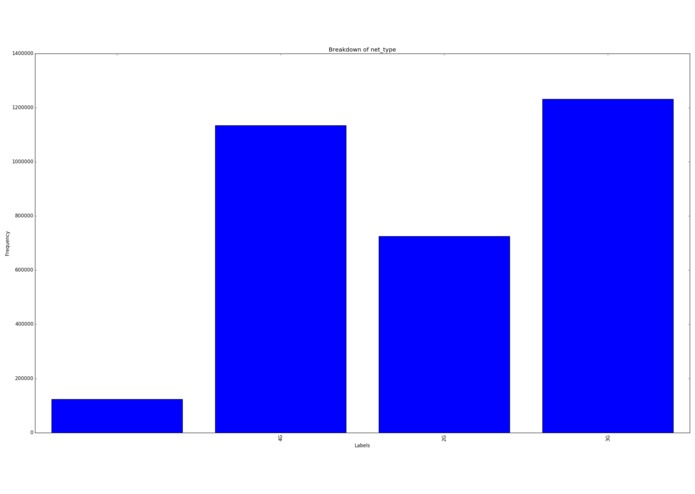
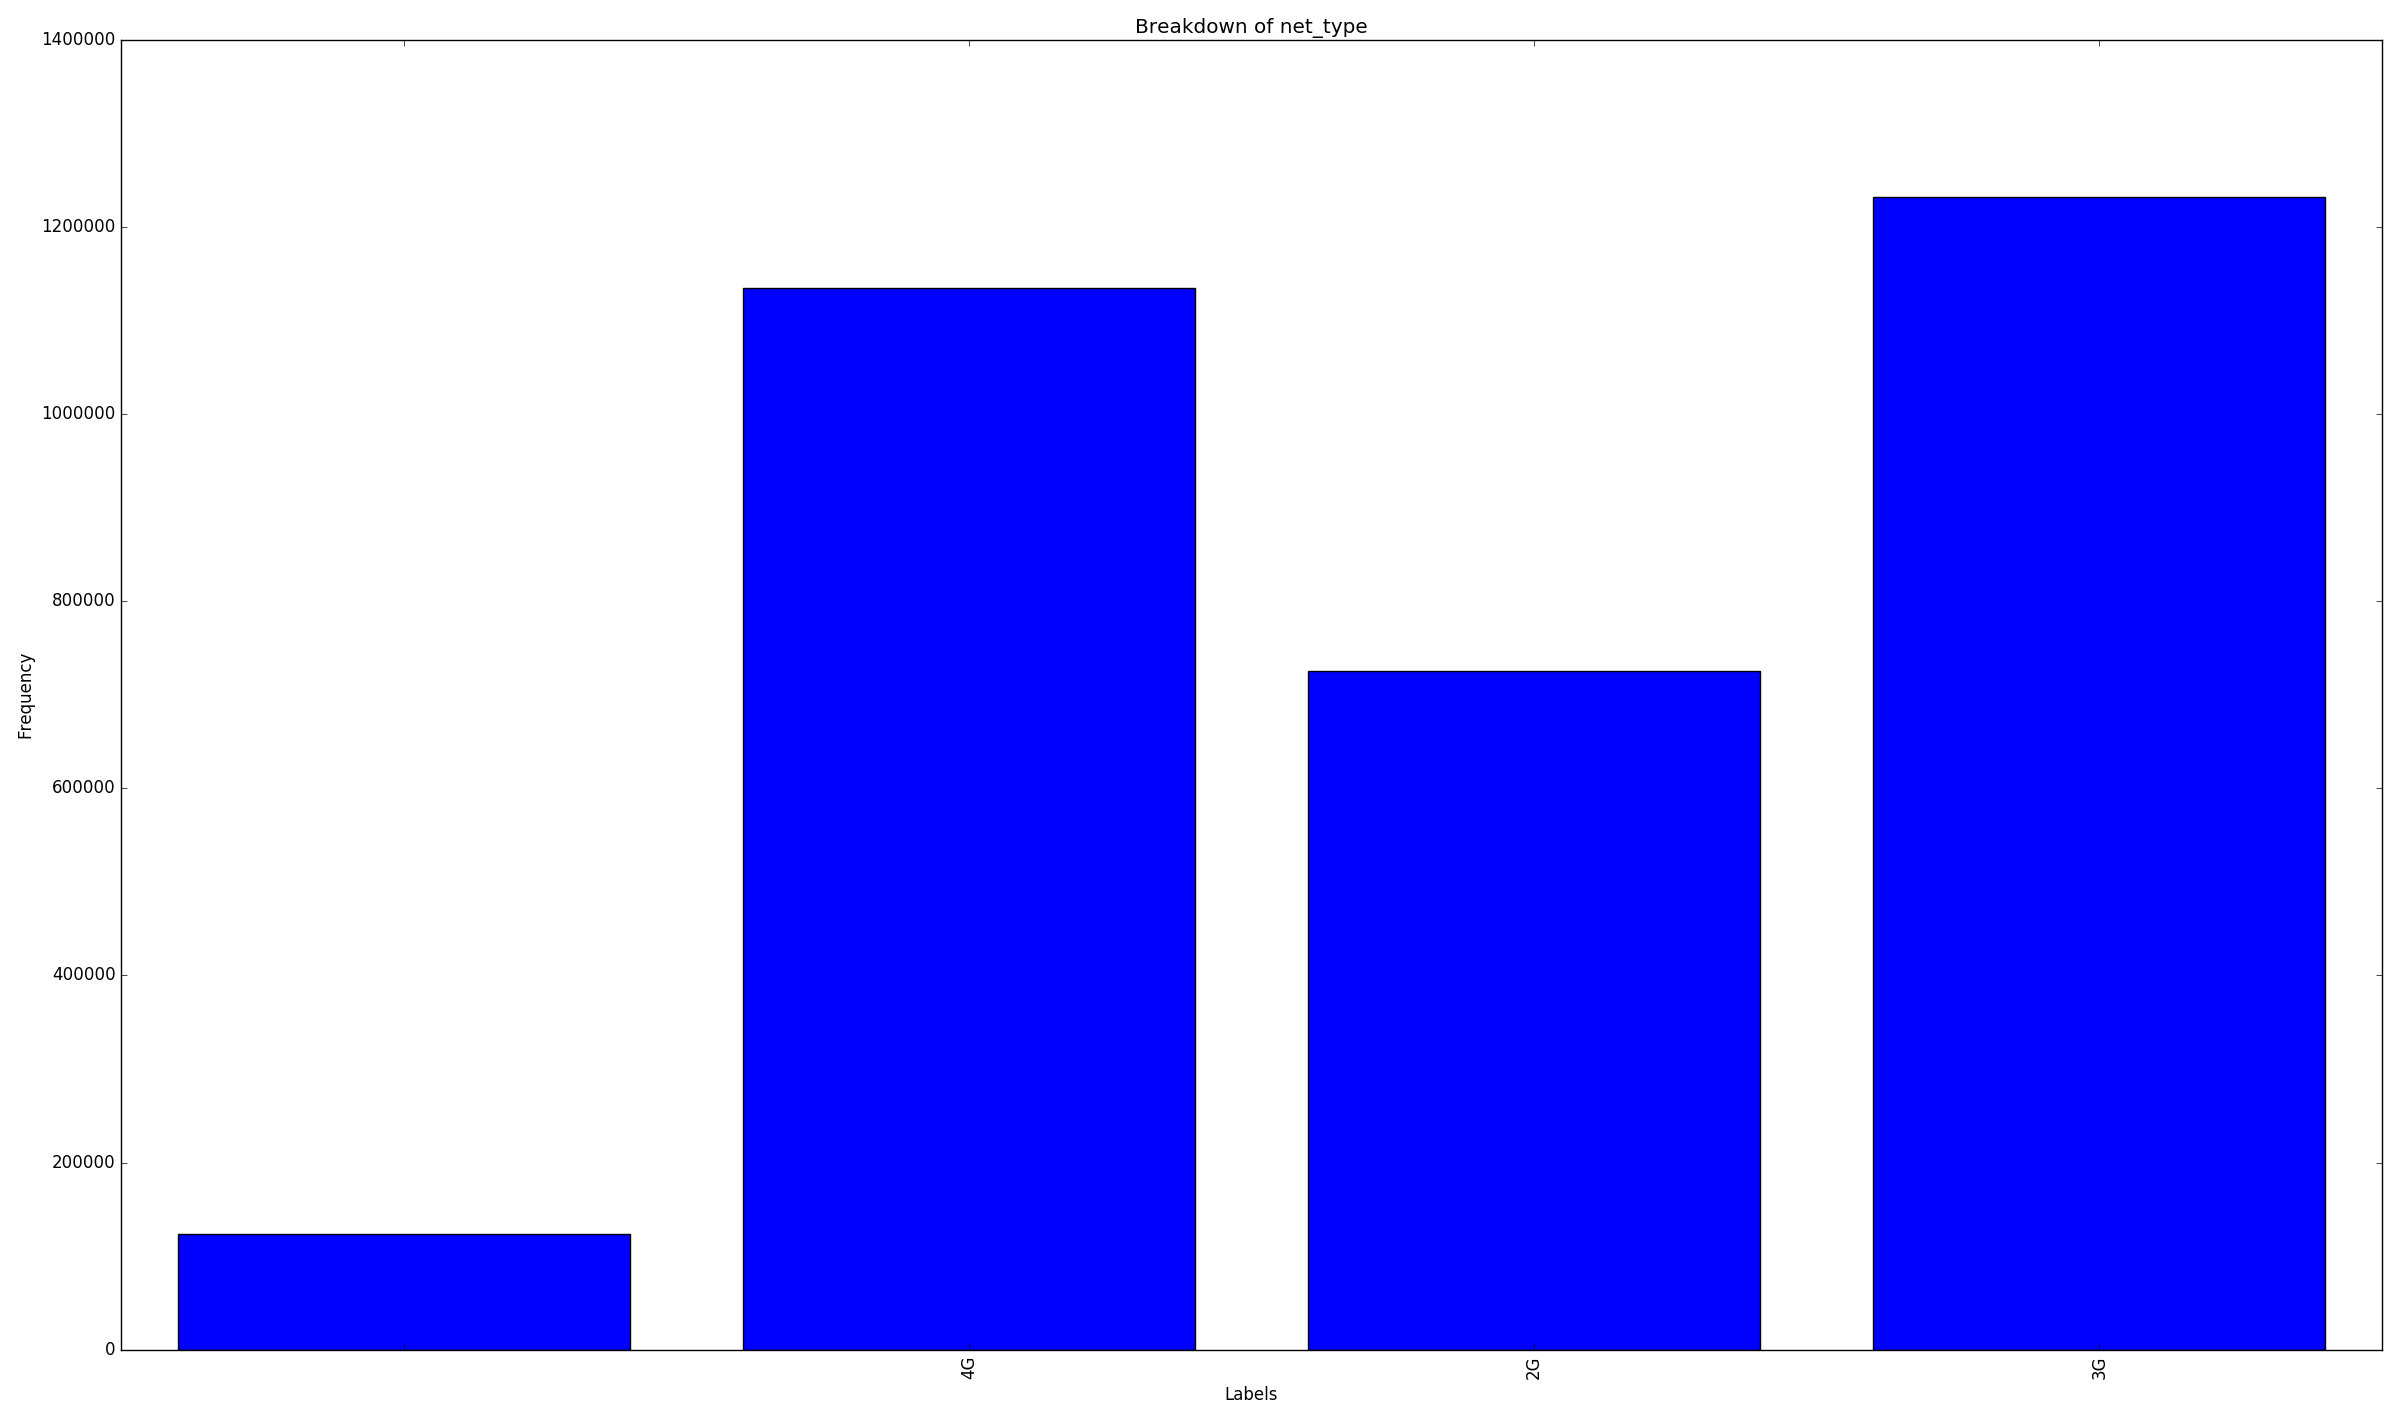
Breakdown of network type
-
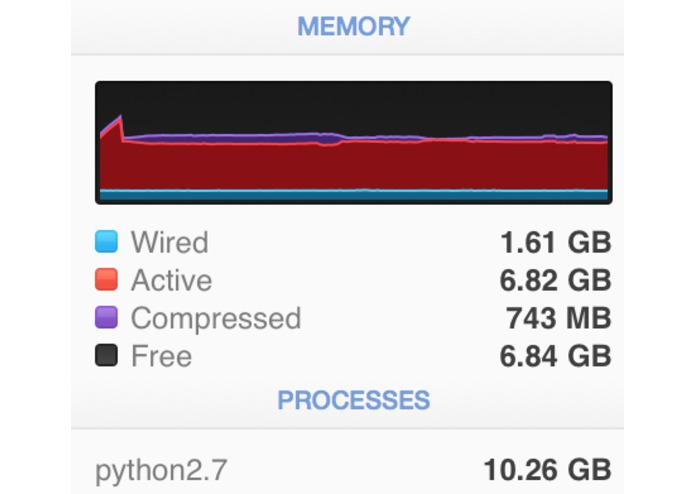
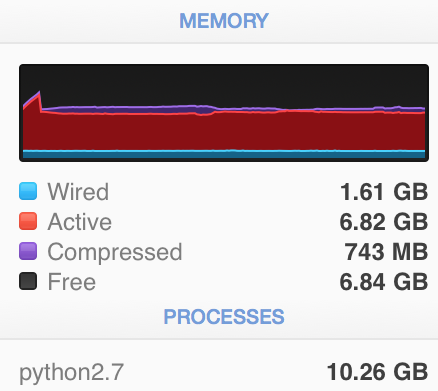
My poor RAM
-
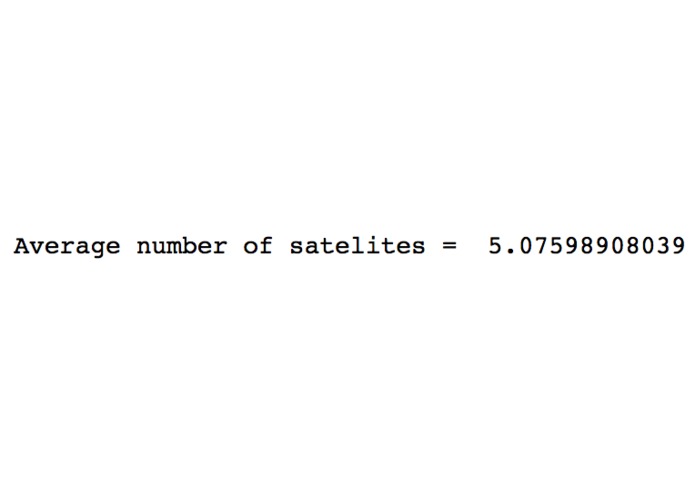
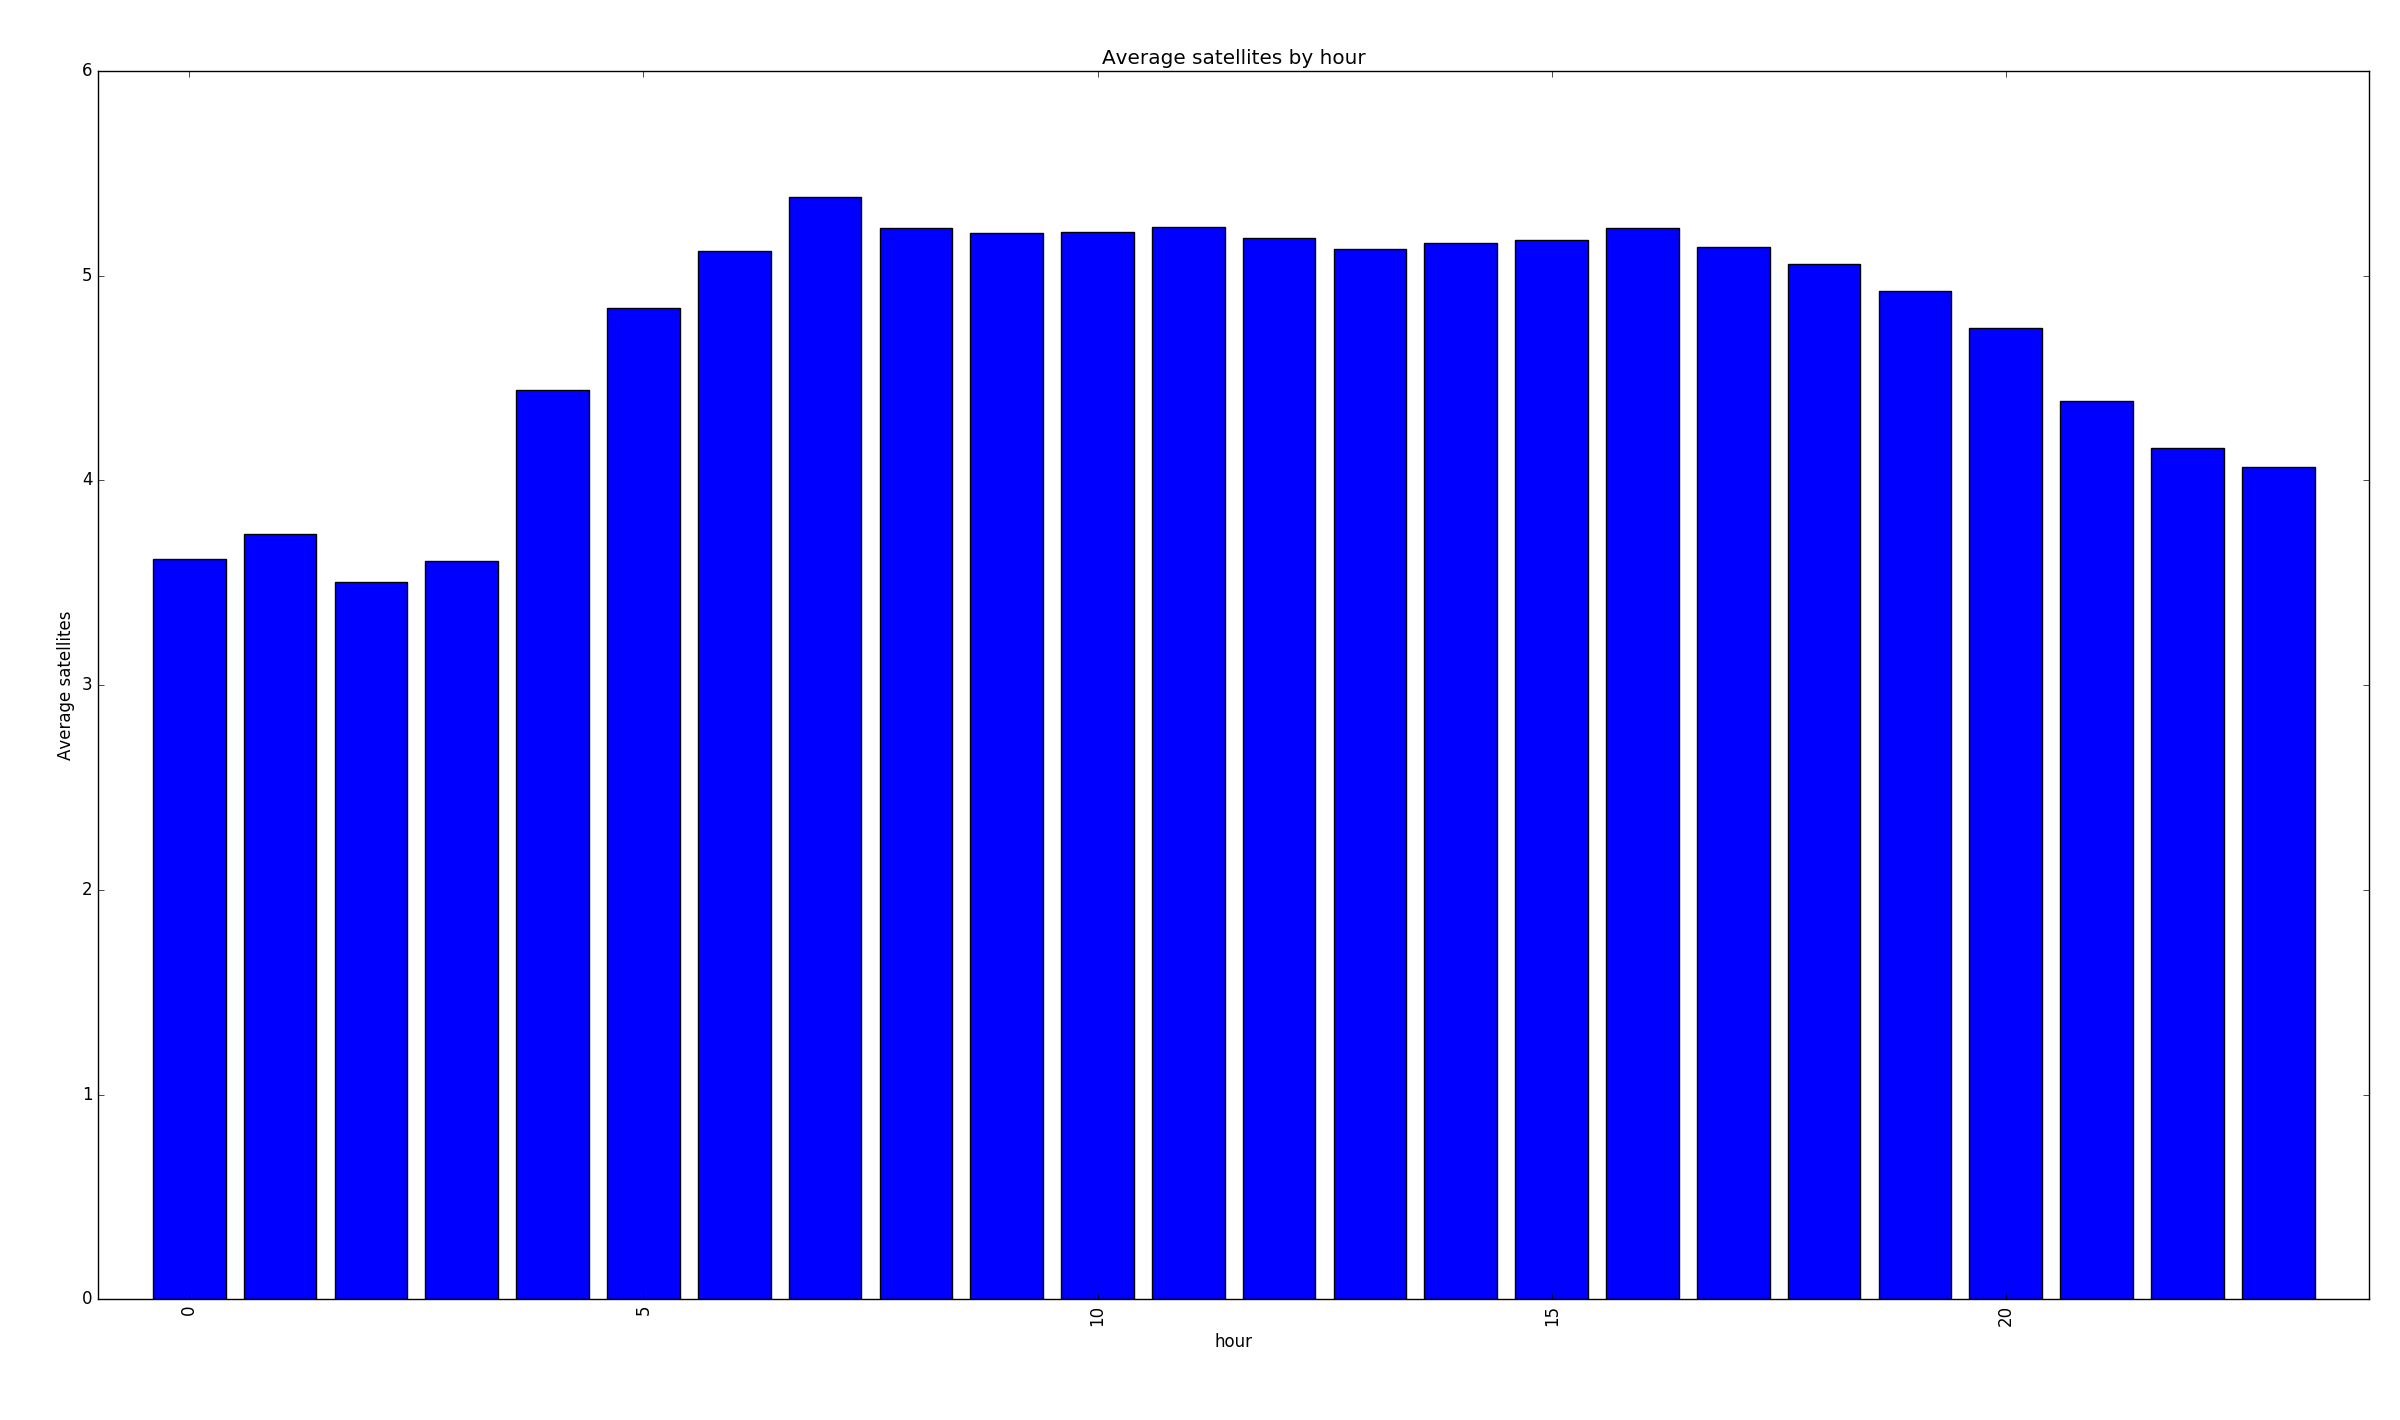
Average number of satellites
-
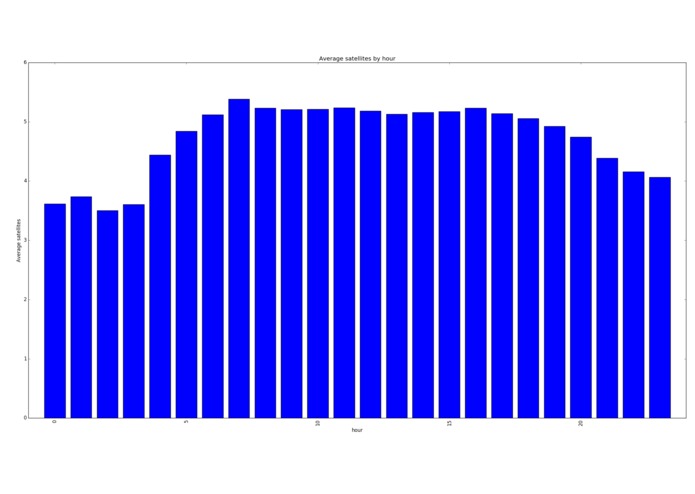
Average satellites per hour
-
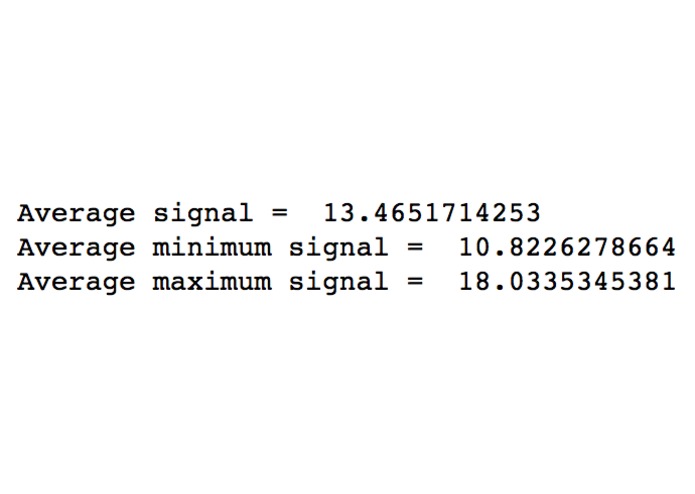
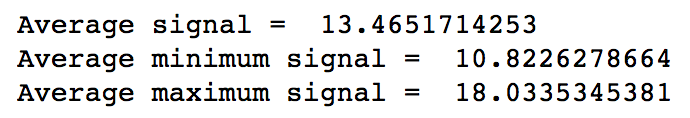
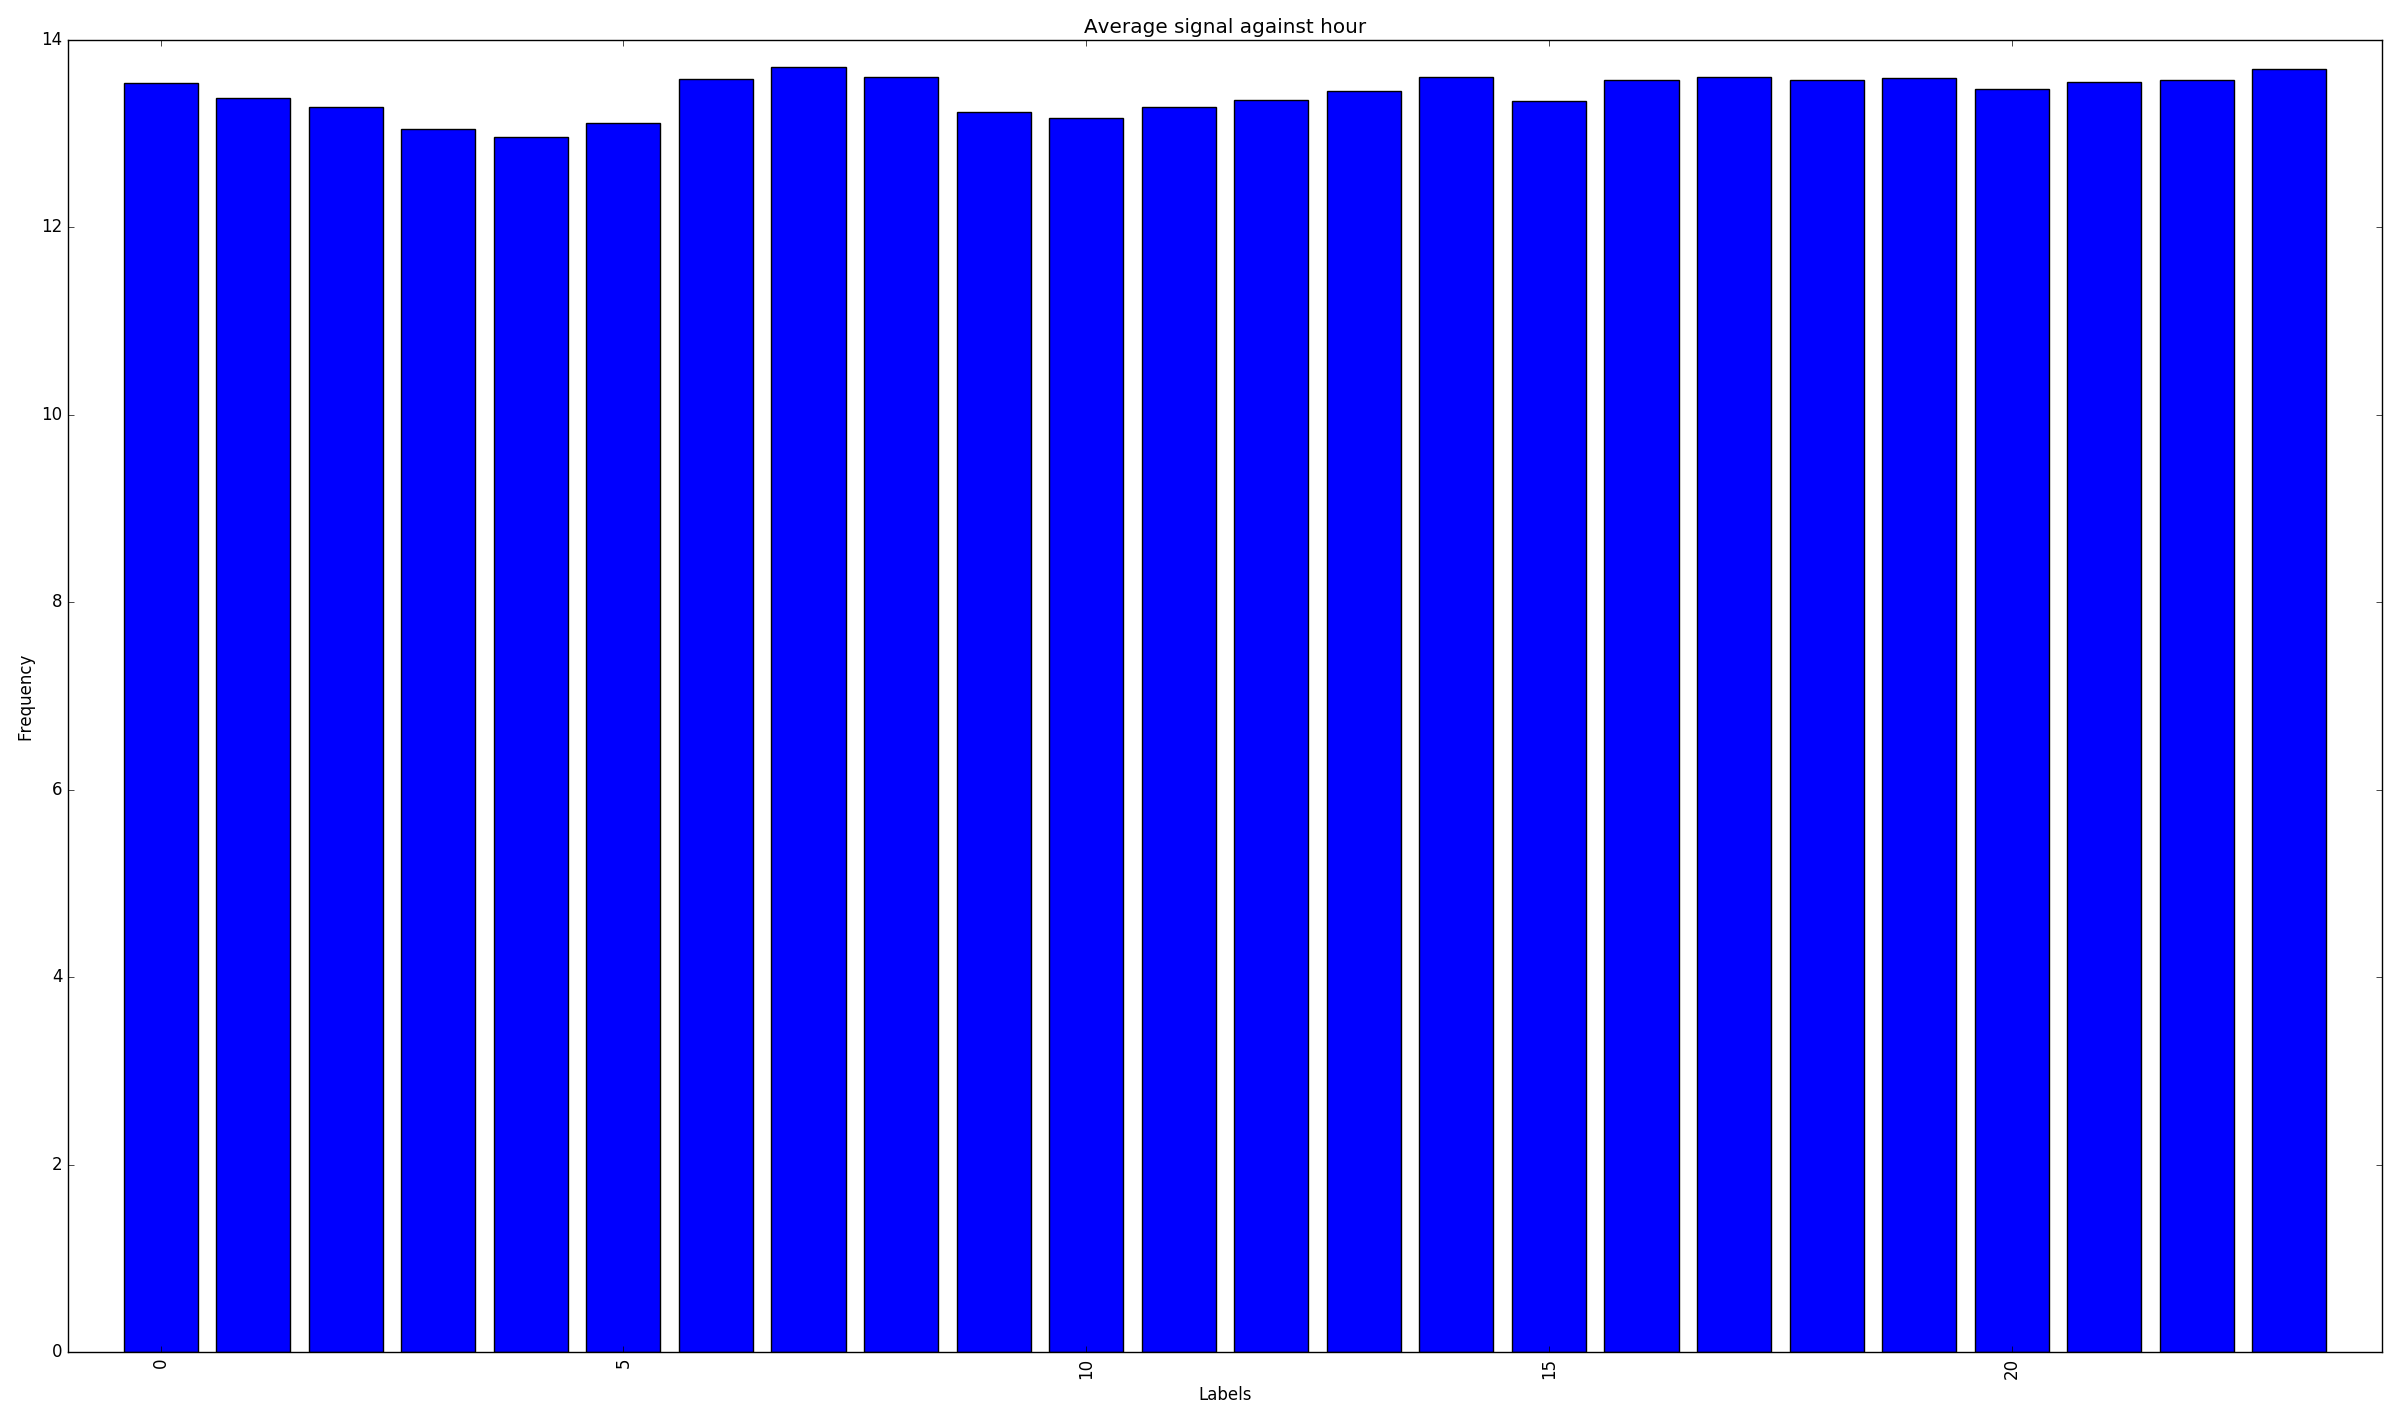
Signal averages (out of 32)
-
Average Lattitude per hour
-
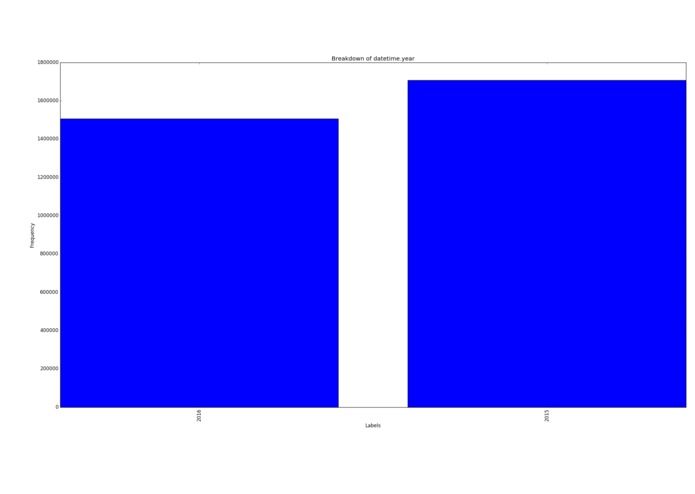
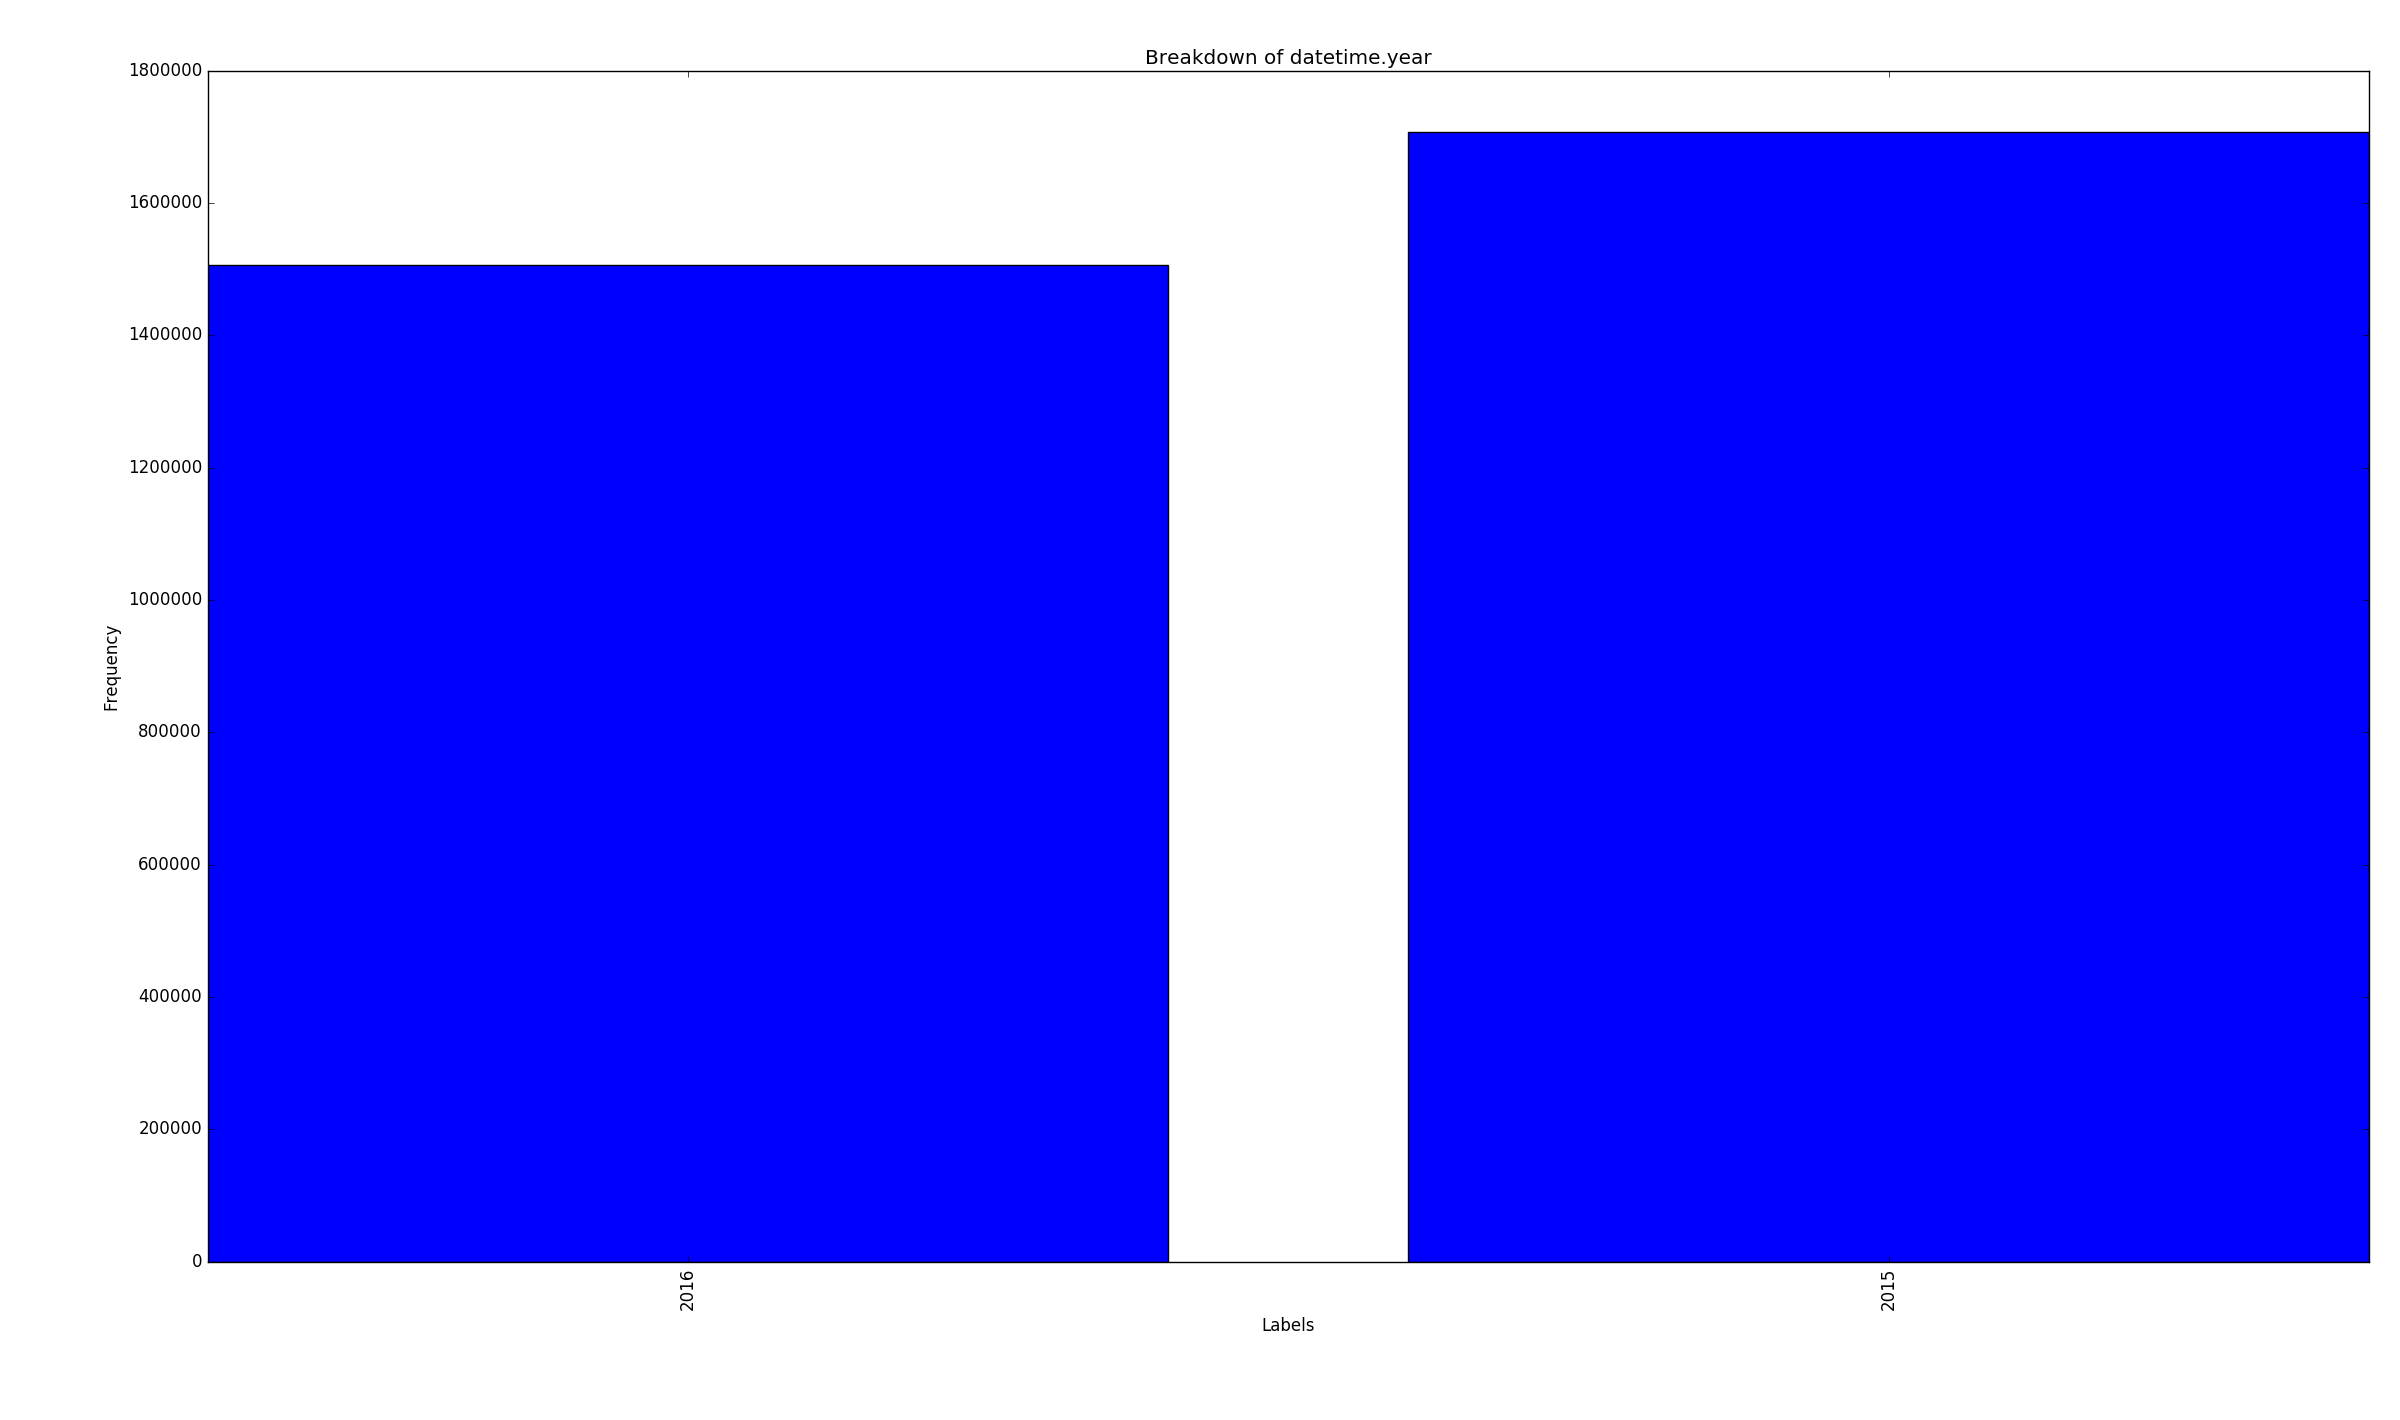
Samples per year
-
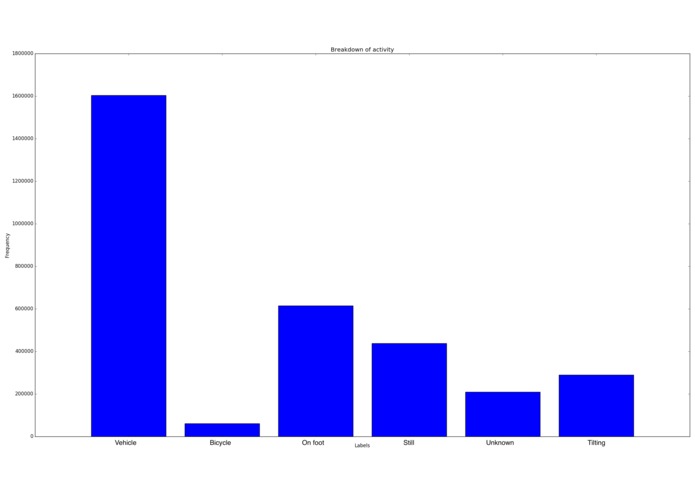
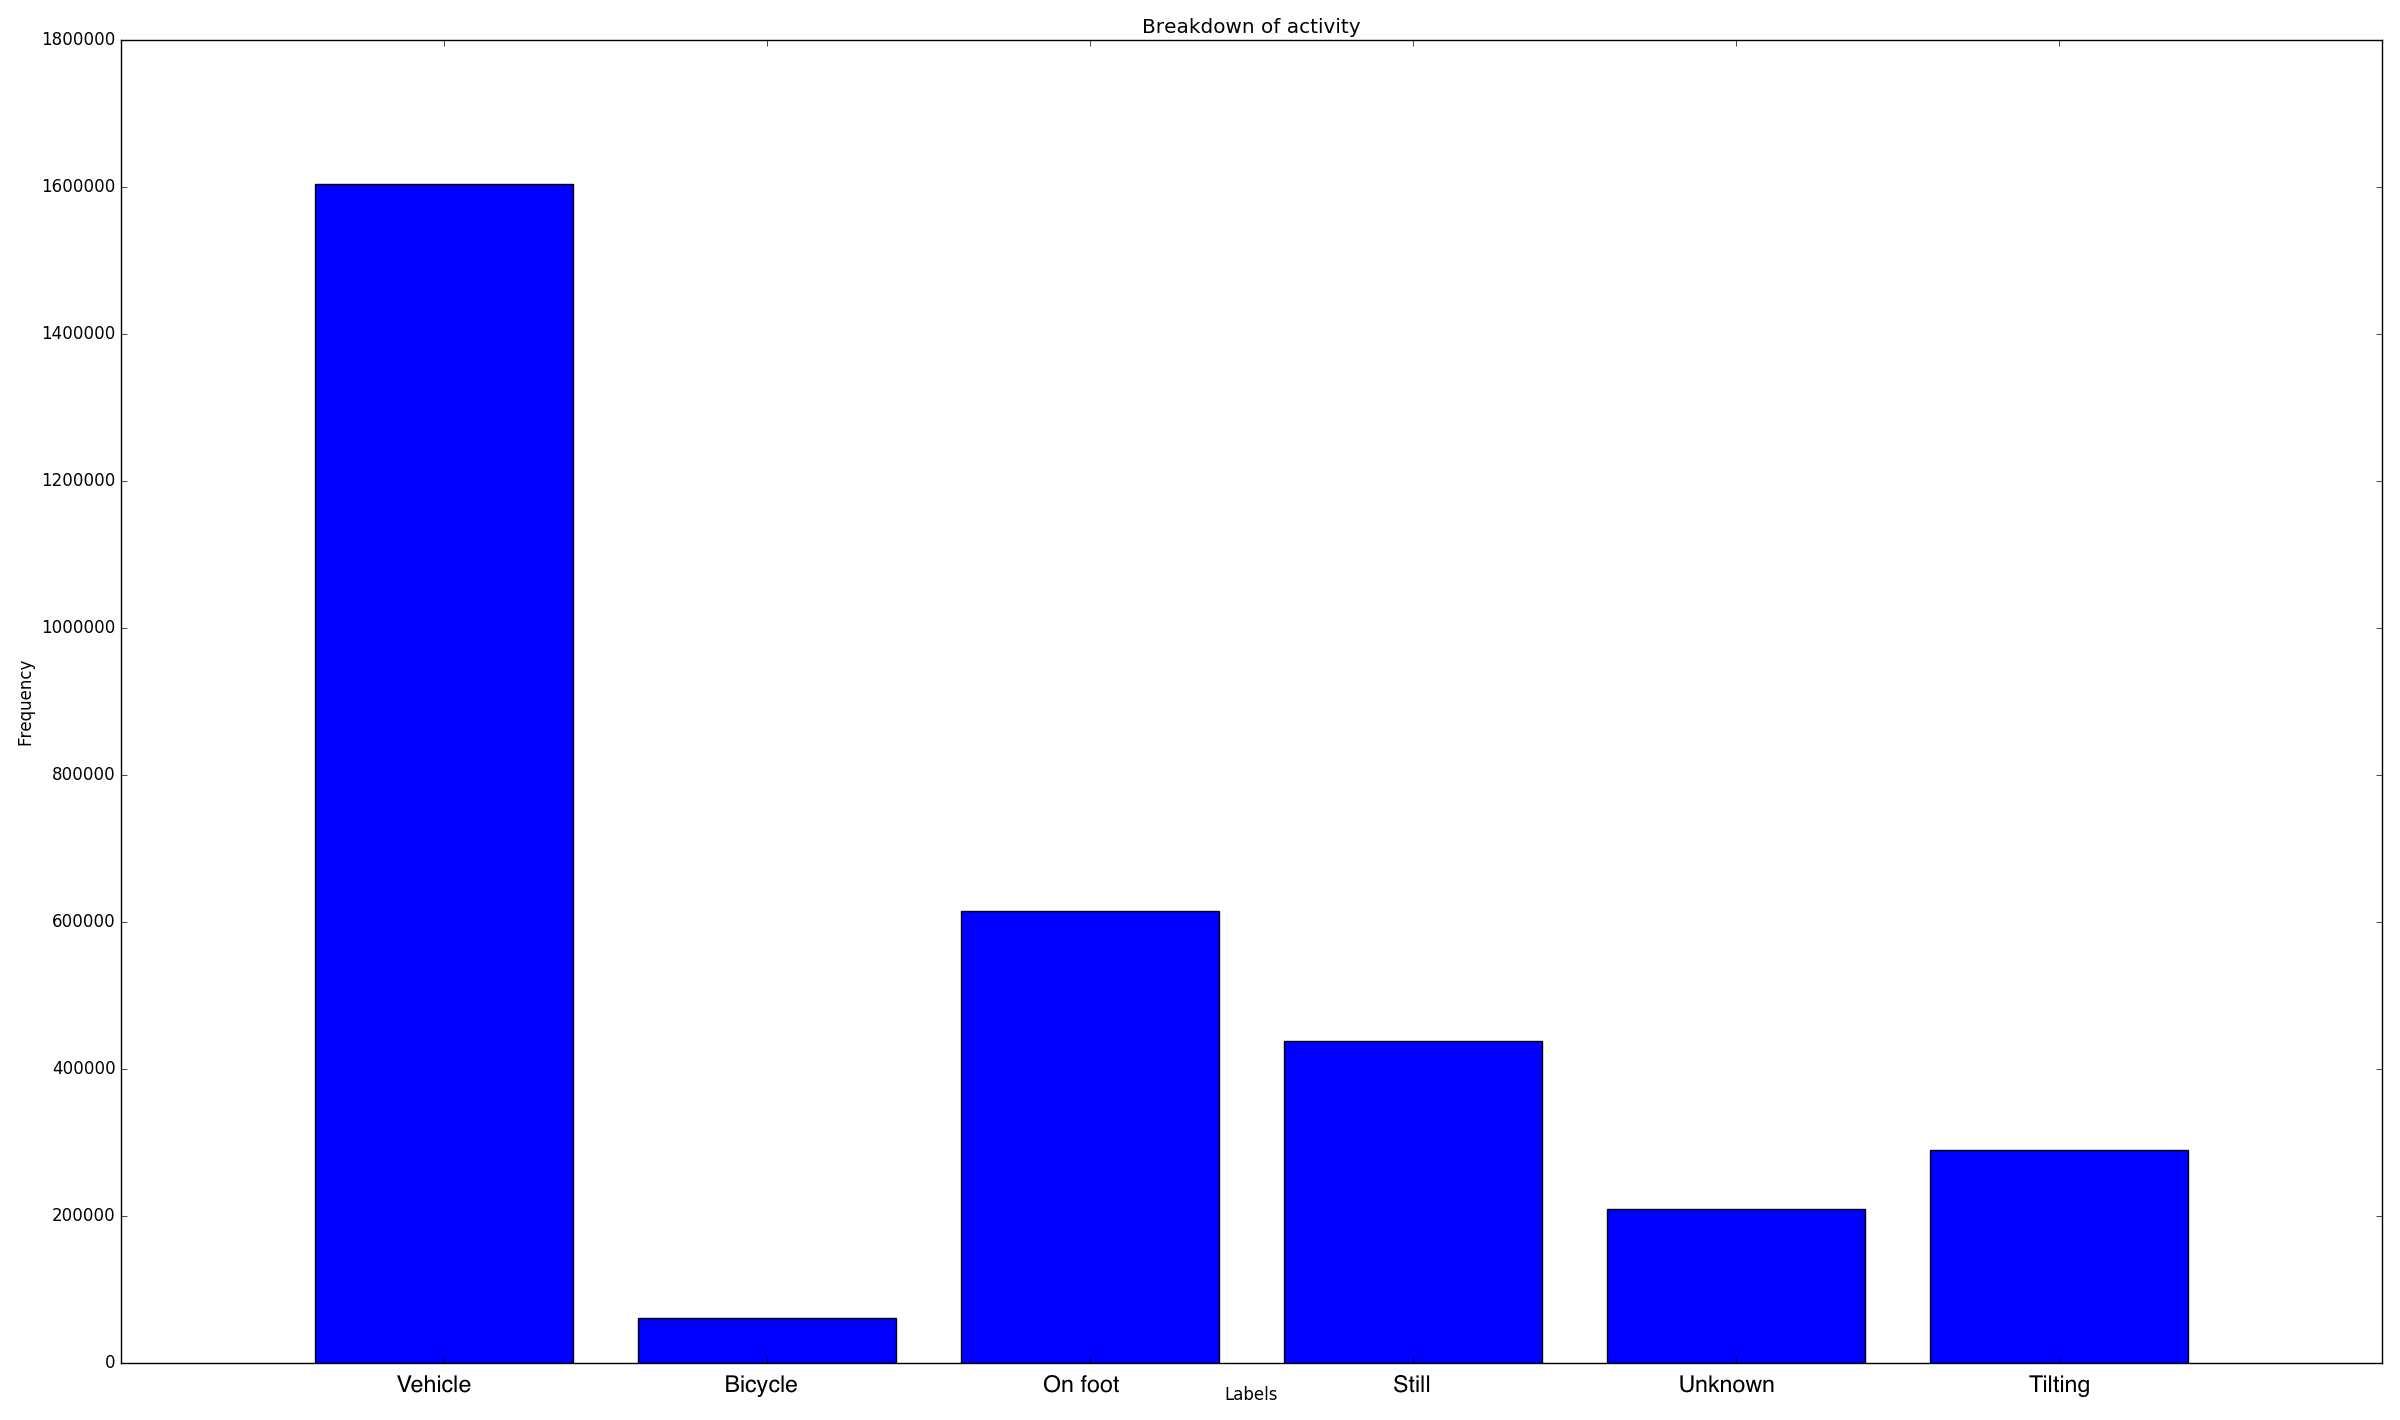
User activity breakdown


Inspiration
Big data is a hot topic but we'd never attempted it before. When the opportunity to analyse millions of mobile phone users data came up we leapt to the challenge.
What it does
We managed to analyse 2GB of users data, in PYTHON on a LAPTOP.
How we built it
We decided that the best idea would be to try this analysis in python, since we haven't done anything like it before. We loaded the CSVs using and optimised, customised data structure. We then tested various hypotheses on the raw data and managed to learn a lot about these users.
Challenges we ran into
Python's ram usage, peak was over 9,000MB. We managed to halve the memory usage which enabled us to extract twice as many samples from the dataset.
Cool stuff we found
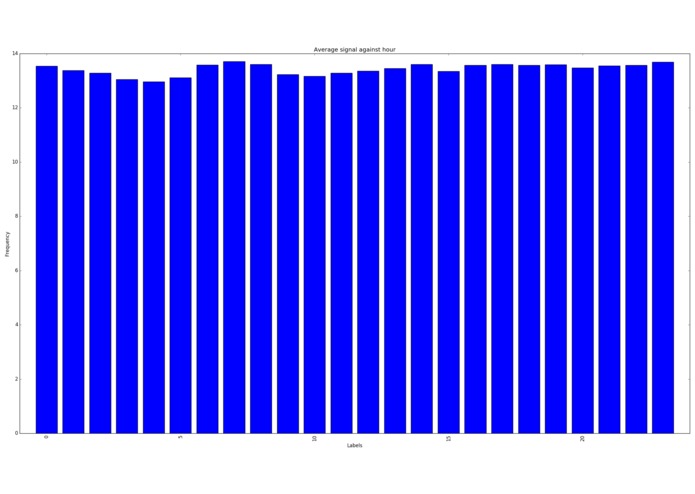
People in the west of the country stayed up later and got up later than users in the east. There was a local minimum in the speed distribution at each speed limit (so they're either just under or over the limit). Some people just want to watch the world burn and break my graphs by going at 300 km/h. People like to club at night, meaning that their GPS signals are lower.
The most common times for these users was at 11am (coffee break) and 5pm (when they get out of work.) The most common day for data was the 5th of the month. Roughly twice as much data than any other day of the month. Possibly a sampling issue in the original data?
Accomplishments that we're proud of
19,290,818. That's how many records we were analysing. This was on a laptop, in Python, by two men who'd never done big data analysis.
What we learned
How to analyse several GB of raw data and find trends in such a large dataset. We learned how to do so in an """efficient"""" fashion. Big data in Python. Git/github.
What's next for ACCD
Feed us more data, and see what we find out!
Acknowledgements
Thanks to Altran for providing us with the data. Thanks to UPC for hosting such an awesome hackathon and the organisers for being awesome. A shout out to the wifi, which always showed up when I needed it. Thanks to all the sponsors for all their support (Skyscanner, you guys are code ninjas.)


Log in or sign up for Devpost to join the conversation.