-
-

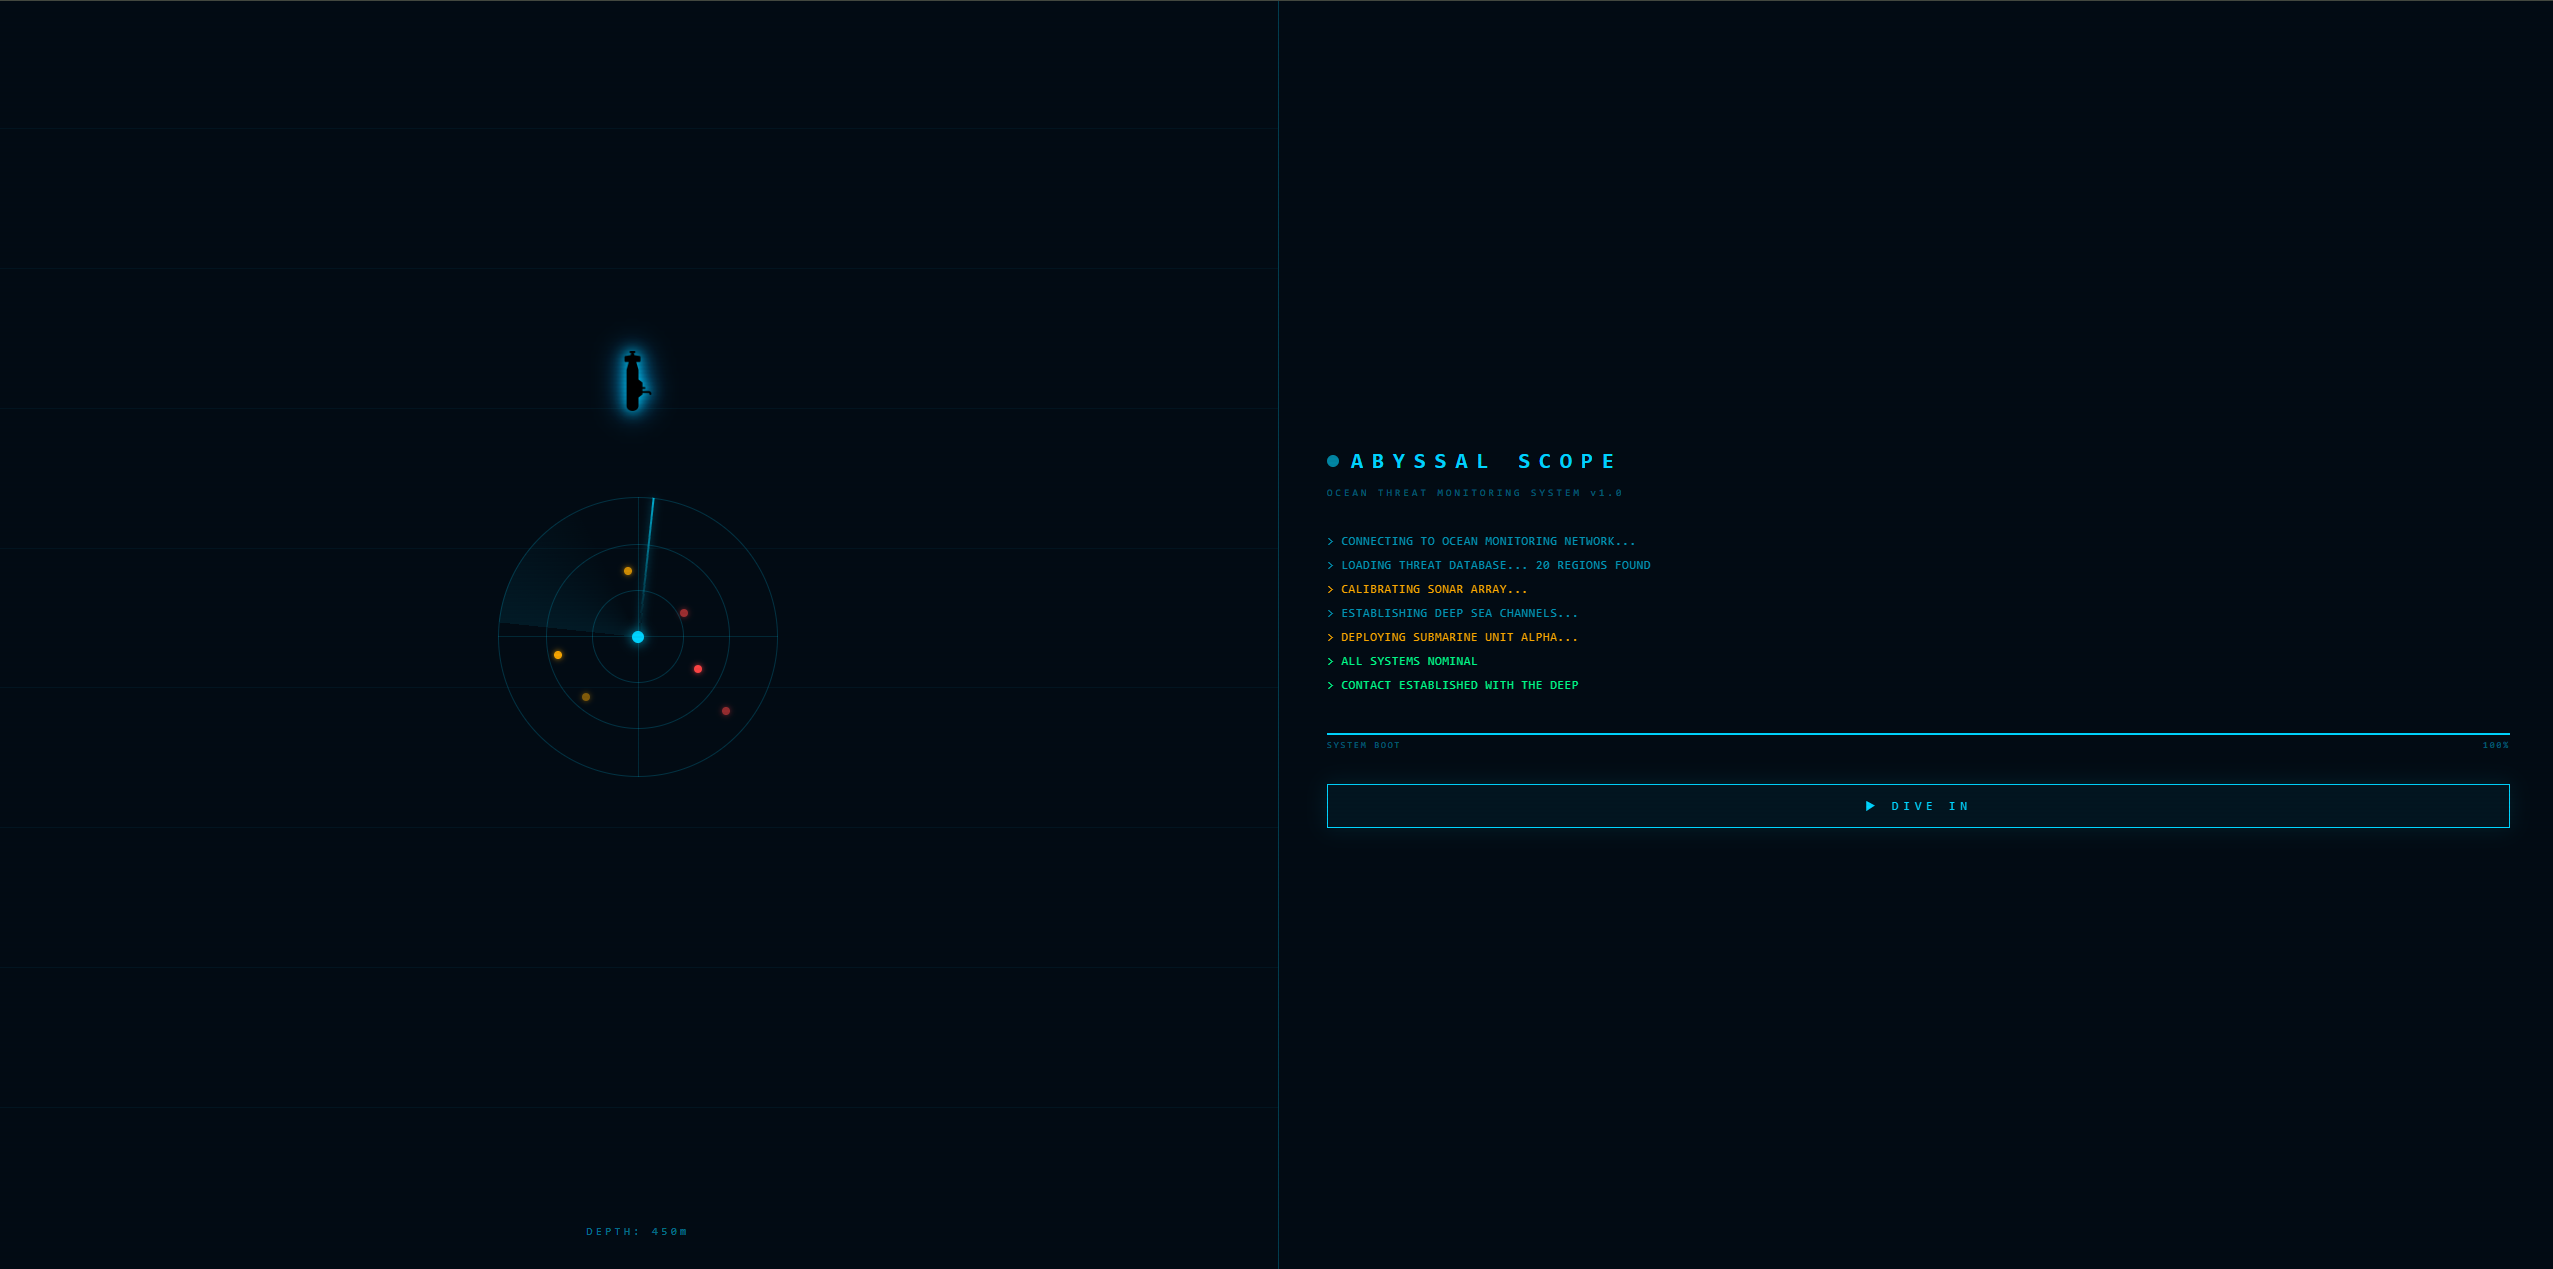
Loading Screen
-
About Page
-
Field Report
-

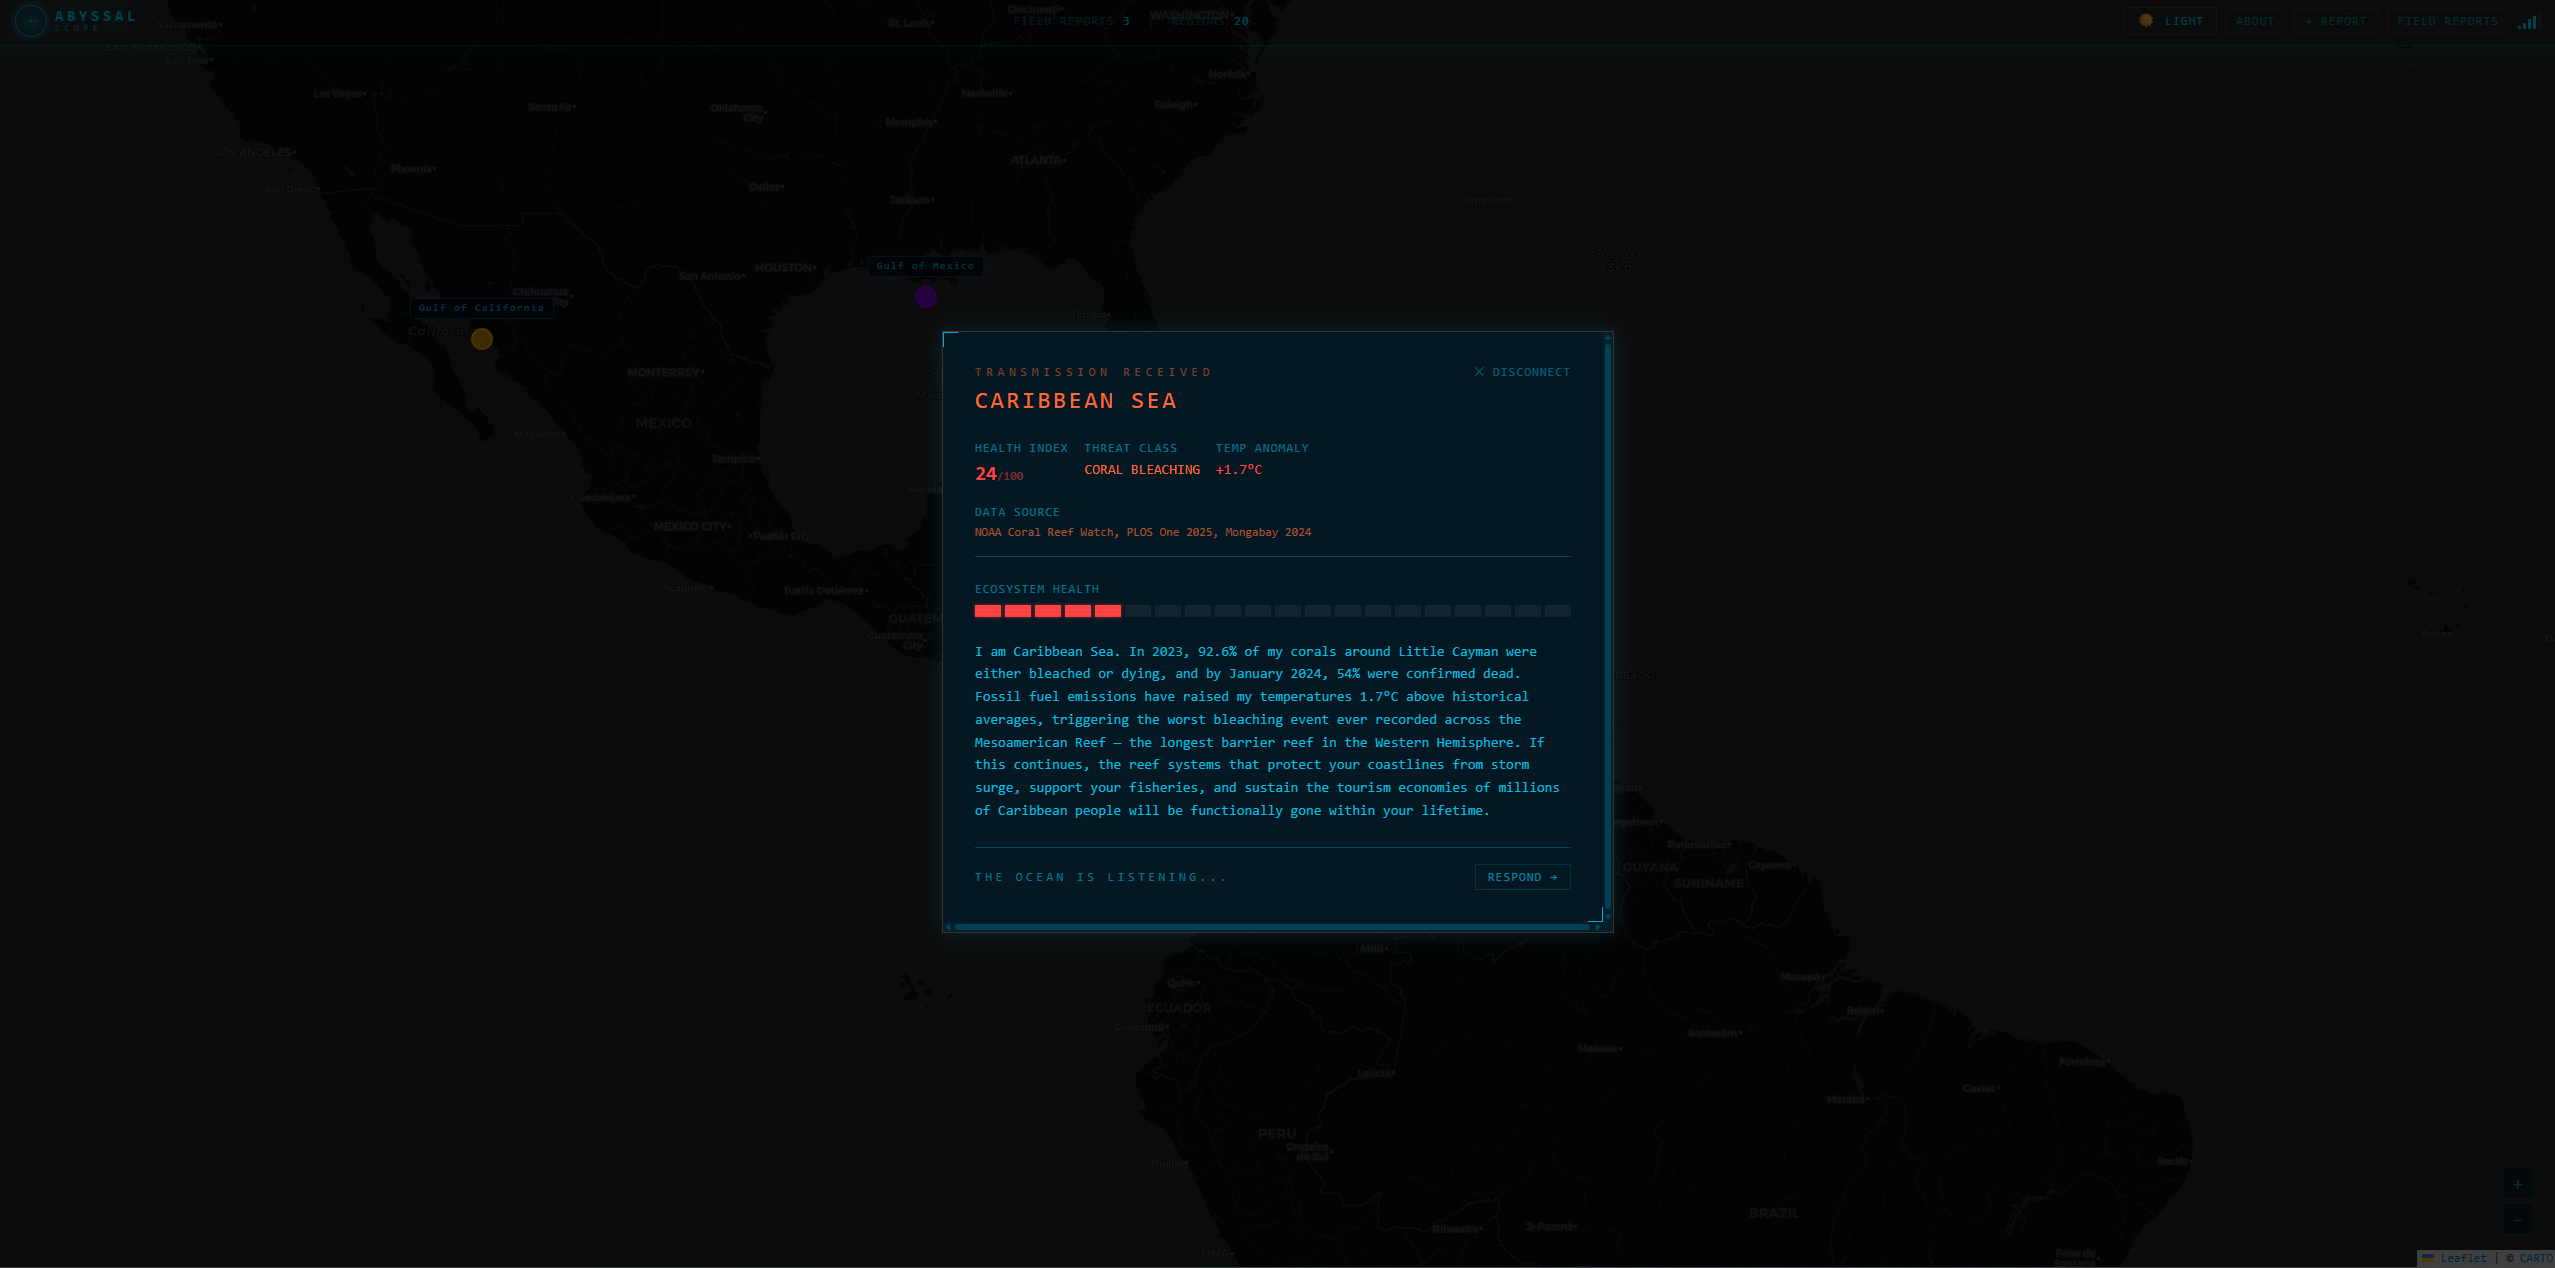
Conversation
-
Ocean Summary
-
Overview
Inspiration
The ocean covers 71% of our planet and supports the food security of over 3 billion people. Yet most people have never truly felt the scale of what is happening beneath the surface the numbers exist, but they don't connect. What if instead of reading a statistic about coral bleaching, you could hear the Great Barrier Reef speak for itself? What if the Gulf of Mexico could tell you about the 6,705 square mile dead zone suffocating its waters? AbyssalScope was built to make the ocean's crisis feel personal, urgent, and real.
What it does
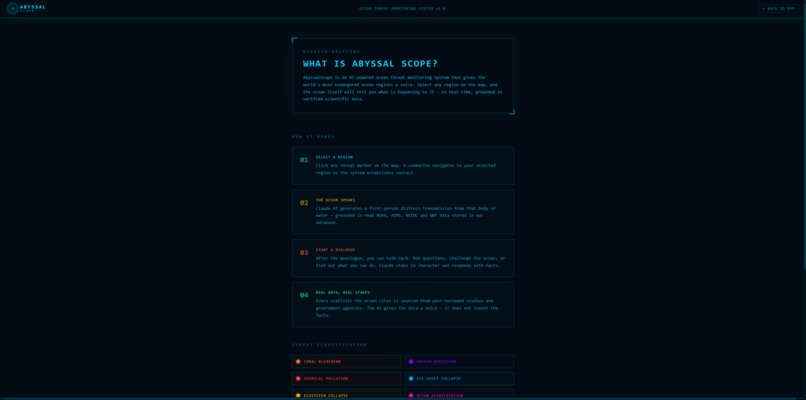
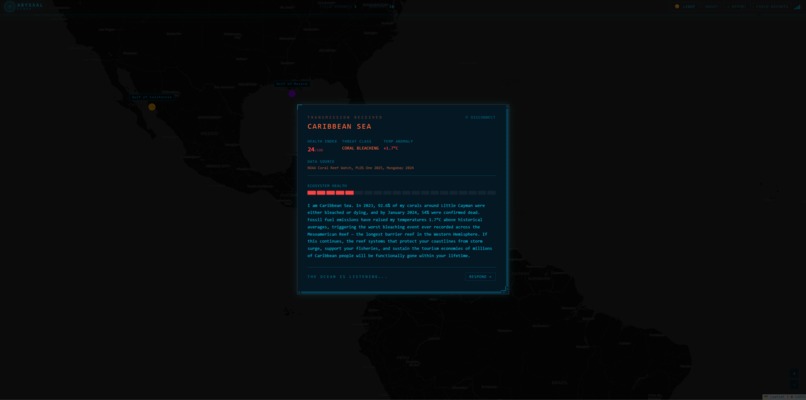
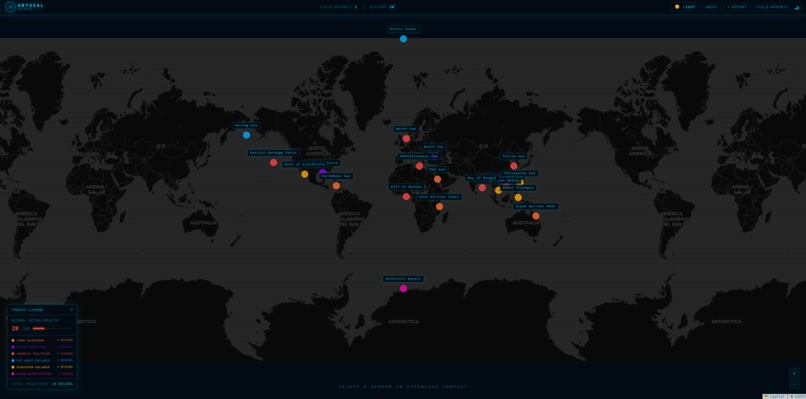
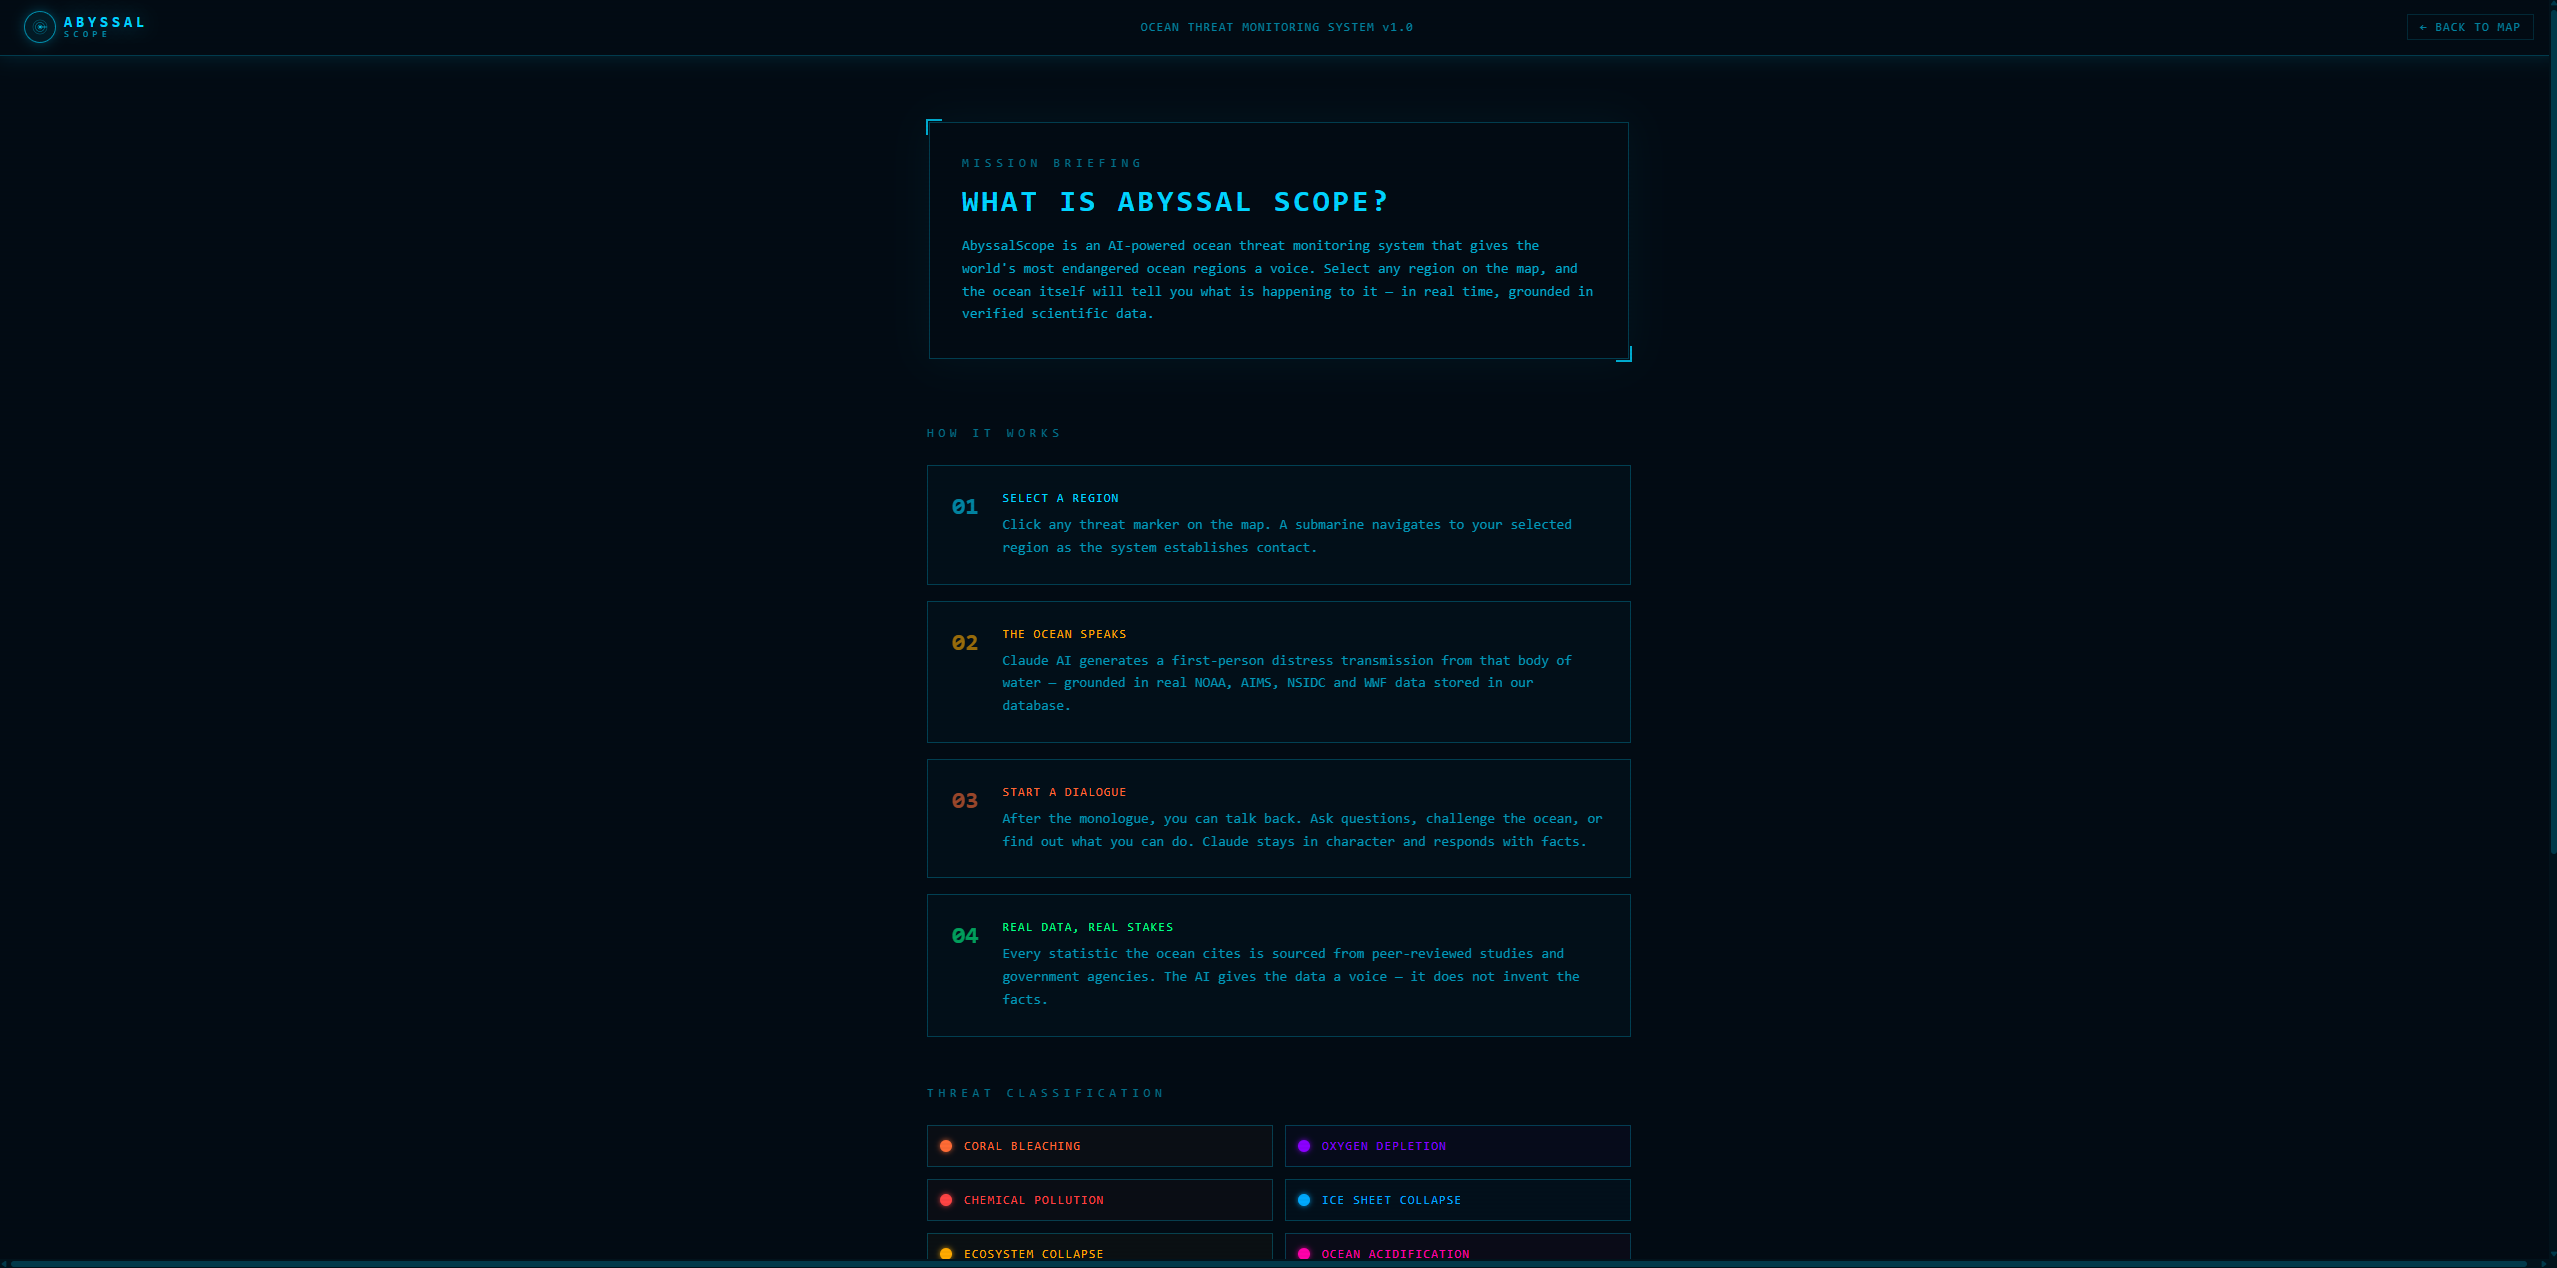
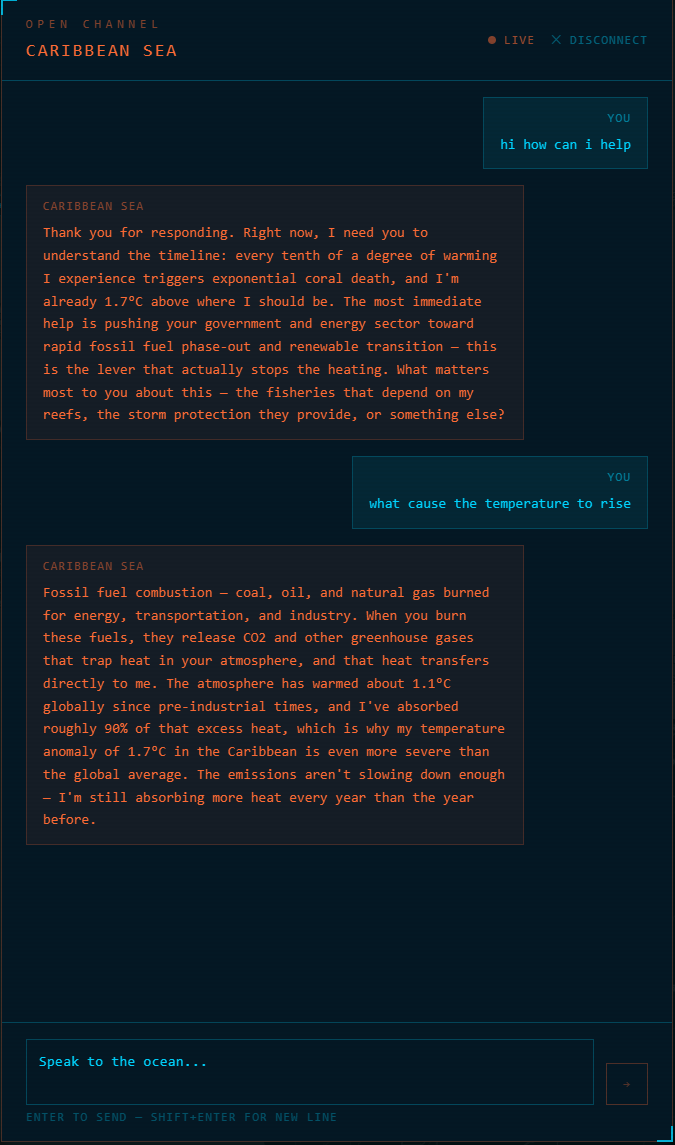
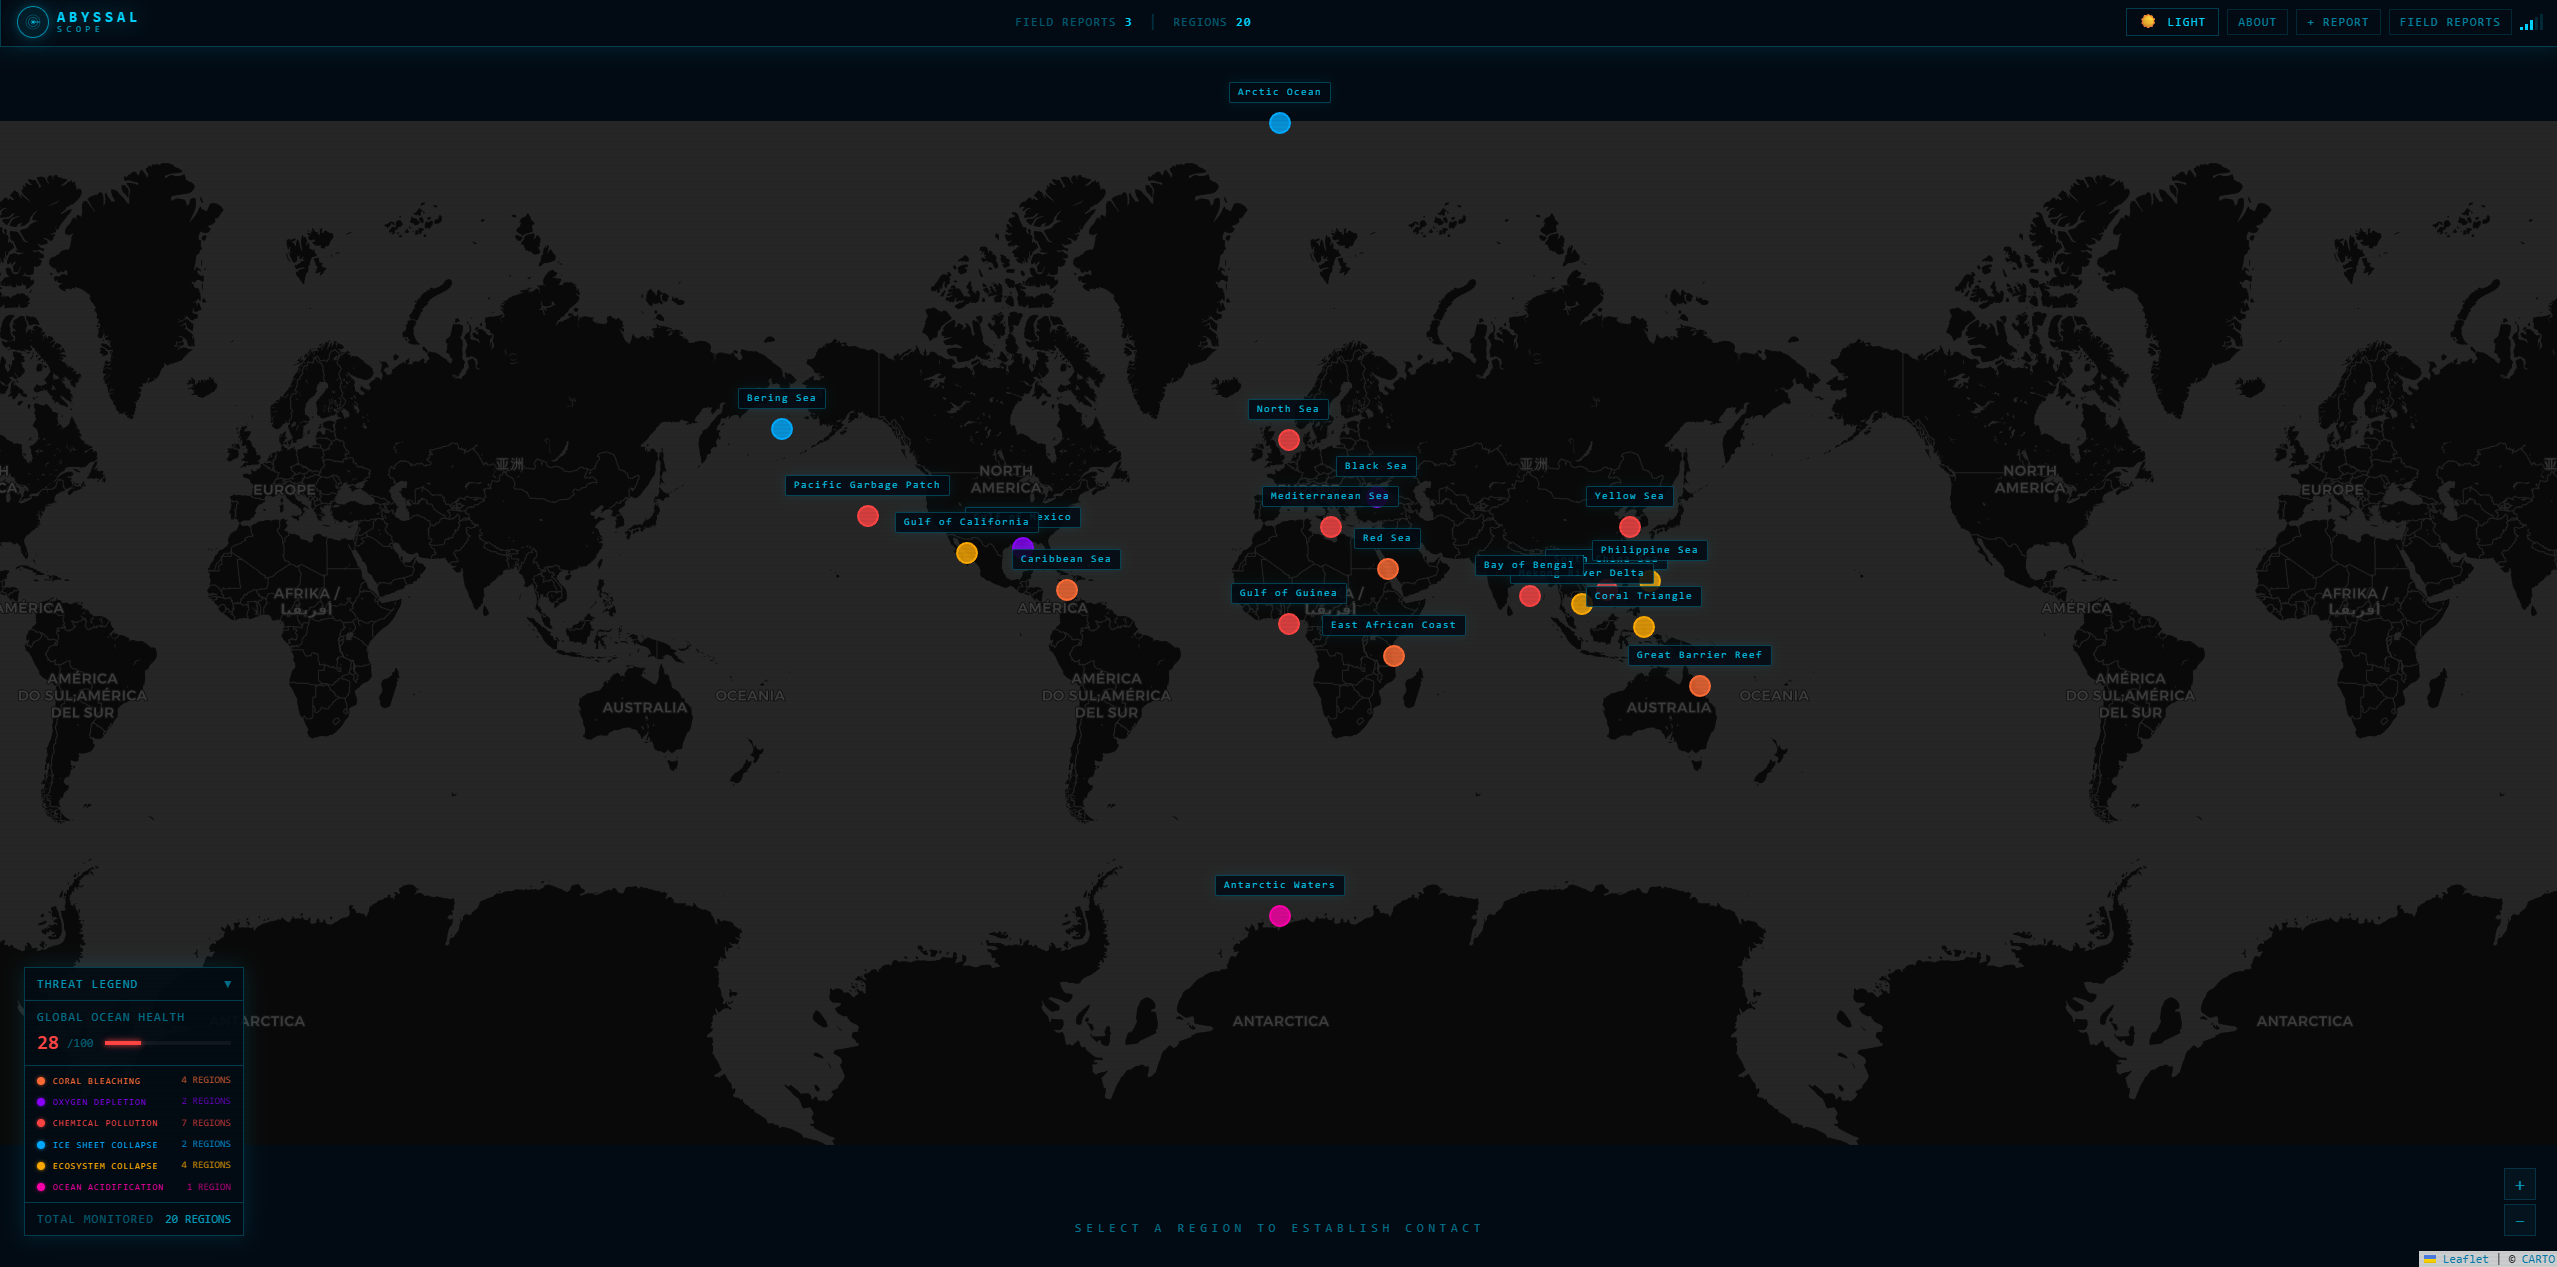
AbyssalScope is an AI-powered ocean threat monitoring system that gives the world's most endangered ocean regions a voice. Users open the app to a cinematic submarine HUD displaying 20 ocean regions across every major basin on Earth each color-coded by its primary threat type. Click any region and a submarine animates across the map to your selected location. The system then generates a first-person distress transmission from that body of water, powered by Claude AI and grounded in verified scientific data.
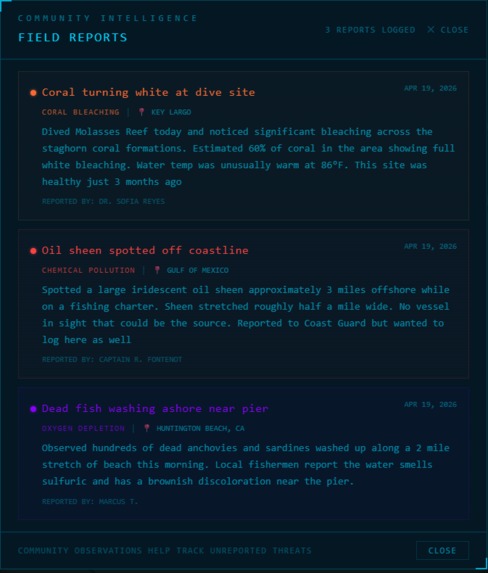
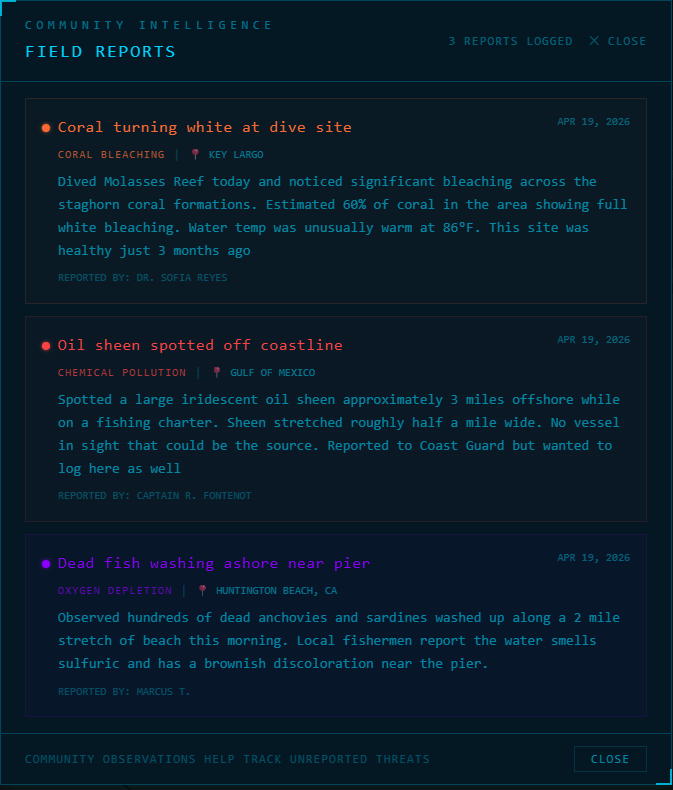
After the monologue, users can talk back asking questions, challenging the ocean, or finding out what they can do. Claude stays in character as that specific body of water, responding with real facts and urgency. Users can also submit their own coastal field reports, which are logged in a live community database visible to all users.
How I built it
- Frontend: Next.js 14 + TypeScript + Tailwind CSS, deployed on Vercel
- Backend: FastAPI (Python), deployed on Railway
- Database: Supabase (PostgreSQL) stores 20 verified ocean regions and community field reports
- AI: Claude API (Anthropic)
- Map: Leaflet.js with CartoDB dark tiles
Challenges I ran into
The biggest challenge was preventing Claude from rewriting its own sentences mid-stream, which caused doubled text in the monologue. We solved this by switching from streaming to a standard API call, then applying a typewriter animation on the complete response.
CORS configuration across Railway, Vercel preview URLs, and localhost required careful handling since each environment generates a different origin.
Accomplishments that I am proud of
- 20 ocean regions with verified, sourced scientific data covering every major ocean basin on Earth
- A cinematic HUD aesthetic that makes environmental data feel urgent and immersive
- An AI dialogue system where Claude stays in character as a dying ocean factual, urgent, never preachy
- A community field report system that lets real users contribute observations
- Full mobile responsive design with bottom sheet panels and hamburger navigation
- Built entirely solo in under 24 hours
What I learned
Grounding AI in real data makes it dramatically more powerful and more responsible. Claude speaking as the Pacific Garbage Patch hits differently when every statistic it cites is verified by NOAA. The gap between "AI says something alarming" and "AI accurately represents what scientists have documented" is the difference between a gimmick and a tool.
Design is also a force multiplier for impact. The same ocean health data presented as a spreadsheet vs as a first-person distress transmission from a dying ecosystem produces completely different emotional responses.
Built With
- claudeapi
- css
- fastapi
- leaflet.js
- next.js
- postgresql
- python
- railway
- supabase
- typescript

Log in or sign up for Devpost to join the conversation.