Inspiration
Studio and distribution teams make decisions—which title to promote, which genre to prioritize in the next slate, when to respond to a drop in social media sentiment—by looking at static dashboards that never provide the exact answer someone needs at that moment. “Which genre performs best relative to budget?” or “How did sentiment toward horror films change this week?” are real business questions, but getting the answer usually involves requesting an ad hoc report from the analytics team and waiting. We were inspired by the idea of bridging that gap: that any executive could type the question in natural language and receive, within seconds, accurate numbers, a table, and an actionable briefing—without touching SQL and without waiting for an analyst.
What it does
ABOTA is a conversational analytics engine for film and streaming with two complementary interfaces:
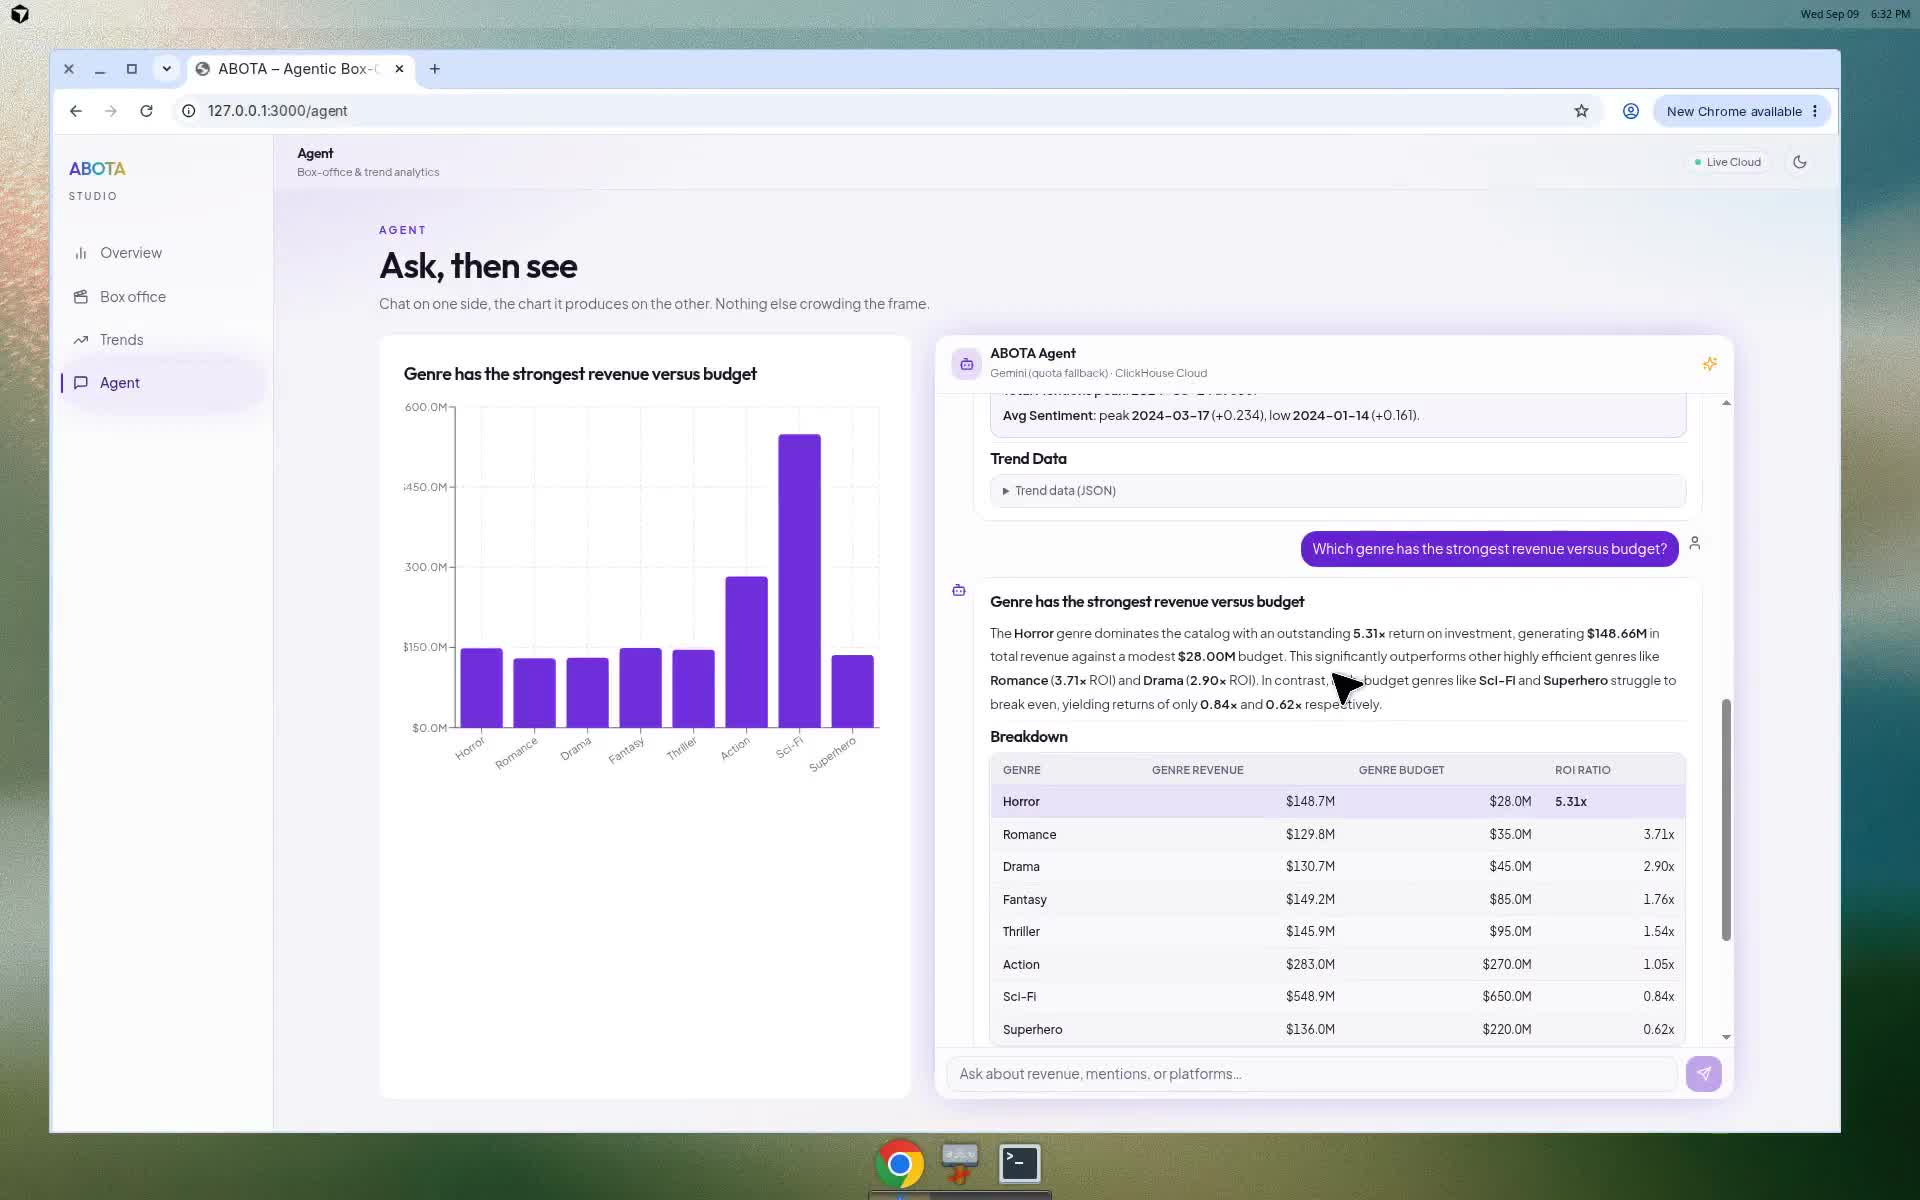
Dashboard (Overview, Box Office, Trends): fixed and always-available key performance indicators (KPIs)—total revenue, unique titles, volume of mentions, average sentiment, revenue by title/platform/genre, mentions per week—calculated using predefined SQL to ensure maximum speed and consistency. Agent (/agent): a chat where users ask open-ended questions (“Which title is leading?”, “Which genre has the best ROI?”, “How has social sentiment for X evolved?”) and receive an executive summary, a breakdown table, key conclusions, and the underlying JSON.
The most notable feature is on-demand ROI calculation (revenue / budget): when the question refers to a genre, country, year, or budget, the Agent generates a WITH … SELECT statement that performs a join between box_office_metrics and content_catalog, and returns, for example, that the horror genre has an ROI of 5.31x, while the superhero genre barely reaches 0.62x.
How we built it
The workflow is: Browser (Next.js) → FastAPI → Gemini (function calling) → MCP mcp-clickhouse → ClickHouse Cloud.
Frontend: Next.js 14 (App Router) with React 18 and TypeScript, styled with Tailwind CSS 3 and shadcn/ui components on top of Radix (Dialog, Slot). Bar charts, line charts, and cross-platform charts are rendered with Recharts, and the Agent’s briefing is displayed using react-markdown + remark-gfm to support tables and bold text directly from the model’s response.
Backend: FastAPI running on Uvicorn, with Pydantic v2 and pydantic-settings to validate contracts and environment variables, and httpx for asynchronous calls.
AI layer: Google Gemini (google-genai) with function calling determines when it needs data and constructs a SELECT (or WITH … SELECT) query using the content_catalog, box_office_metrics, streaming_activity, and social_mentions schemas.
Data layer: Instead of a text search engine (no Elasticsearch, no embeddings, no BM25), “search” is literally query → read-only SQL → ClickHouse. Gemini invokes the MCP run_select_query tool, exposed via the official mcp-clickhouse server through stdio, against ClickHouse Cloud (TLS, port 8443).
The dashboard, on the other hand, does not go through Gemini: it uses fixed SQL in backend/app/db/queries.py executed directly with clickhouse-connect, clearly separating “deterministic KPIs” from “open-ended queries.”
Infrastructure: the entire stack runs on Docker Compose (backend, frontend, and seed), with pytest for the backend and ESLin
Challenges we ran into
Let an LLM write SQL without losing control. The trickiest part was designing the rules for the Agent’s queries: only SELECT or WITH … SELECT, a single statement (no chained semicolons), LIMIT ≤ 100 unless explicitly requested otherwise, and active blocking of dangerous statements (DROP, INSERT, file(), url(), etc.) before mcp-clickhouse executes them.
Teaching the model when to perform joins. To ensure that responses regarding gender, country, year, or budget were correct, we had to explicitly state in the prompt that box_office_metrics.content_id = content_catalog.content_id is mandatory in those cases; otherwise, the model would return aggregations without catalog context.
Format currency without altering the data. We needed the briefing to display readable figures (B/M/K) without that transformation affecting the calculations for ROI, average, maximum, and minimum—so the “compact currency” format remained strictly a presentation layer, separate from the numerical pipeline.
Generating credible synthetic data. The daily box office decay (max(0.15, 1 − 0.75· d/D) with U(0.8, 1.2) noise) and the sentiment distribution (55% positive, 25% neutral, 20% negative) had to be adjusted so that the seed dataset would produce realistic patterns—opening curves that decline over time, mostly positive sentiment but with a negative tail—without being so noisy that they disrupted the Agent’s storytelling.
Resilience against Gemini’s rate limits. We added a fallback model when
Accomplishments that we're proud of
An agent that securely translates natural language into read-only SQL, with clear guardrails (a single statement, no write operations, limited LIMIT) rather than blindly relying on the model. The ROI metric working end-to-end—from the CTE generated by Gemini to the text briefing (“Average ROI 2.22x; peak Horror 5.31x, minimum Superhero 0.62x”)—as the “wow” factor that justifies having an agent and not just a dashboard. A clear separation of responsibilities: deterministic KPIs via fixed SQL queries for what you always need to see, and the Agent for what no one anticipated asking. A reproducible pipeline with Docker Compose that spins up the backend, frontend, and synthetic data seed with a single command.
What we learned
A useful data agent doesn't need a text search engine: for tabular data and aggregations, “query → SQL → columnar database” is simpler, faster, and more auditable than embeddings or BM25. The security of an agent that writes SQL lies in the backend’s validation rules, not in the prompt’s goodwill: blocking DROP/INSERT/file()/url() and enforcing a single read statement is what truly prevents disasters. Separating “what is always displayed” (a dashboard with fixed SQL) from “what is queried on demand” (an agent with Gemini + MCP) simplifies both performance and the reasoning behind what can go wrong in each scenario. ClickHouse Cloud, with functions like uniqExact, is a very convenient foundation for this type of high-volume business analytics aggregation.
What's next for ABOTA
Proactive alerts: Have the Agent notify the user when the social sentiment for a title falls below a threshold or when the ROI for a genre deviates significantly from its historical trend, without the user having to ask. More data sources: Incorporate streaming signals (streaming_activity) with greater depth—retention, series completion—and cross-reference them with box office revenue for window-by-window comparisons. Explainability of generated SQL: Display the executed SELECT statement alongside the briefing, so an analyst can audit exactly which aggregation supported each Key Takeaway. Multi-tenant and permissions: Filter catalogs and metrics by studio/client, with row-level access control in ClickHouse. Native time-series comparisons: Queries such as “compare the ROI for Horror this quarter vs. the previous one” with explicit support for time windows in the prompt and in the schema.
Built With
- clickhouse
- clickhouse-cloud
- docker
- fastapi
- gemini-function-calling
- google-gemini
- httpx
- lucide-react
- mcp-clickhouse
- model-context-protocol
- nextjs
- pydantic
- python
- radix-ui
- react
- react-markdown
- recharts
- remark-gfm
- shadcn-ui
- tailwindcss
- typescript
- uvicorn

Log in or sign up for Devpost to join the conversation.