Inspiration
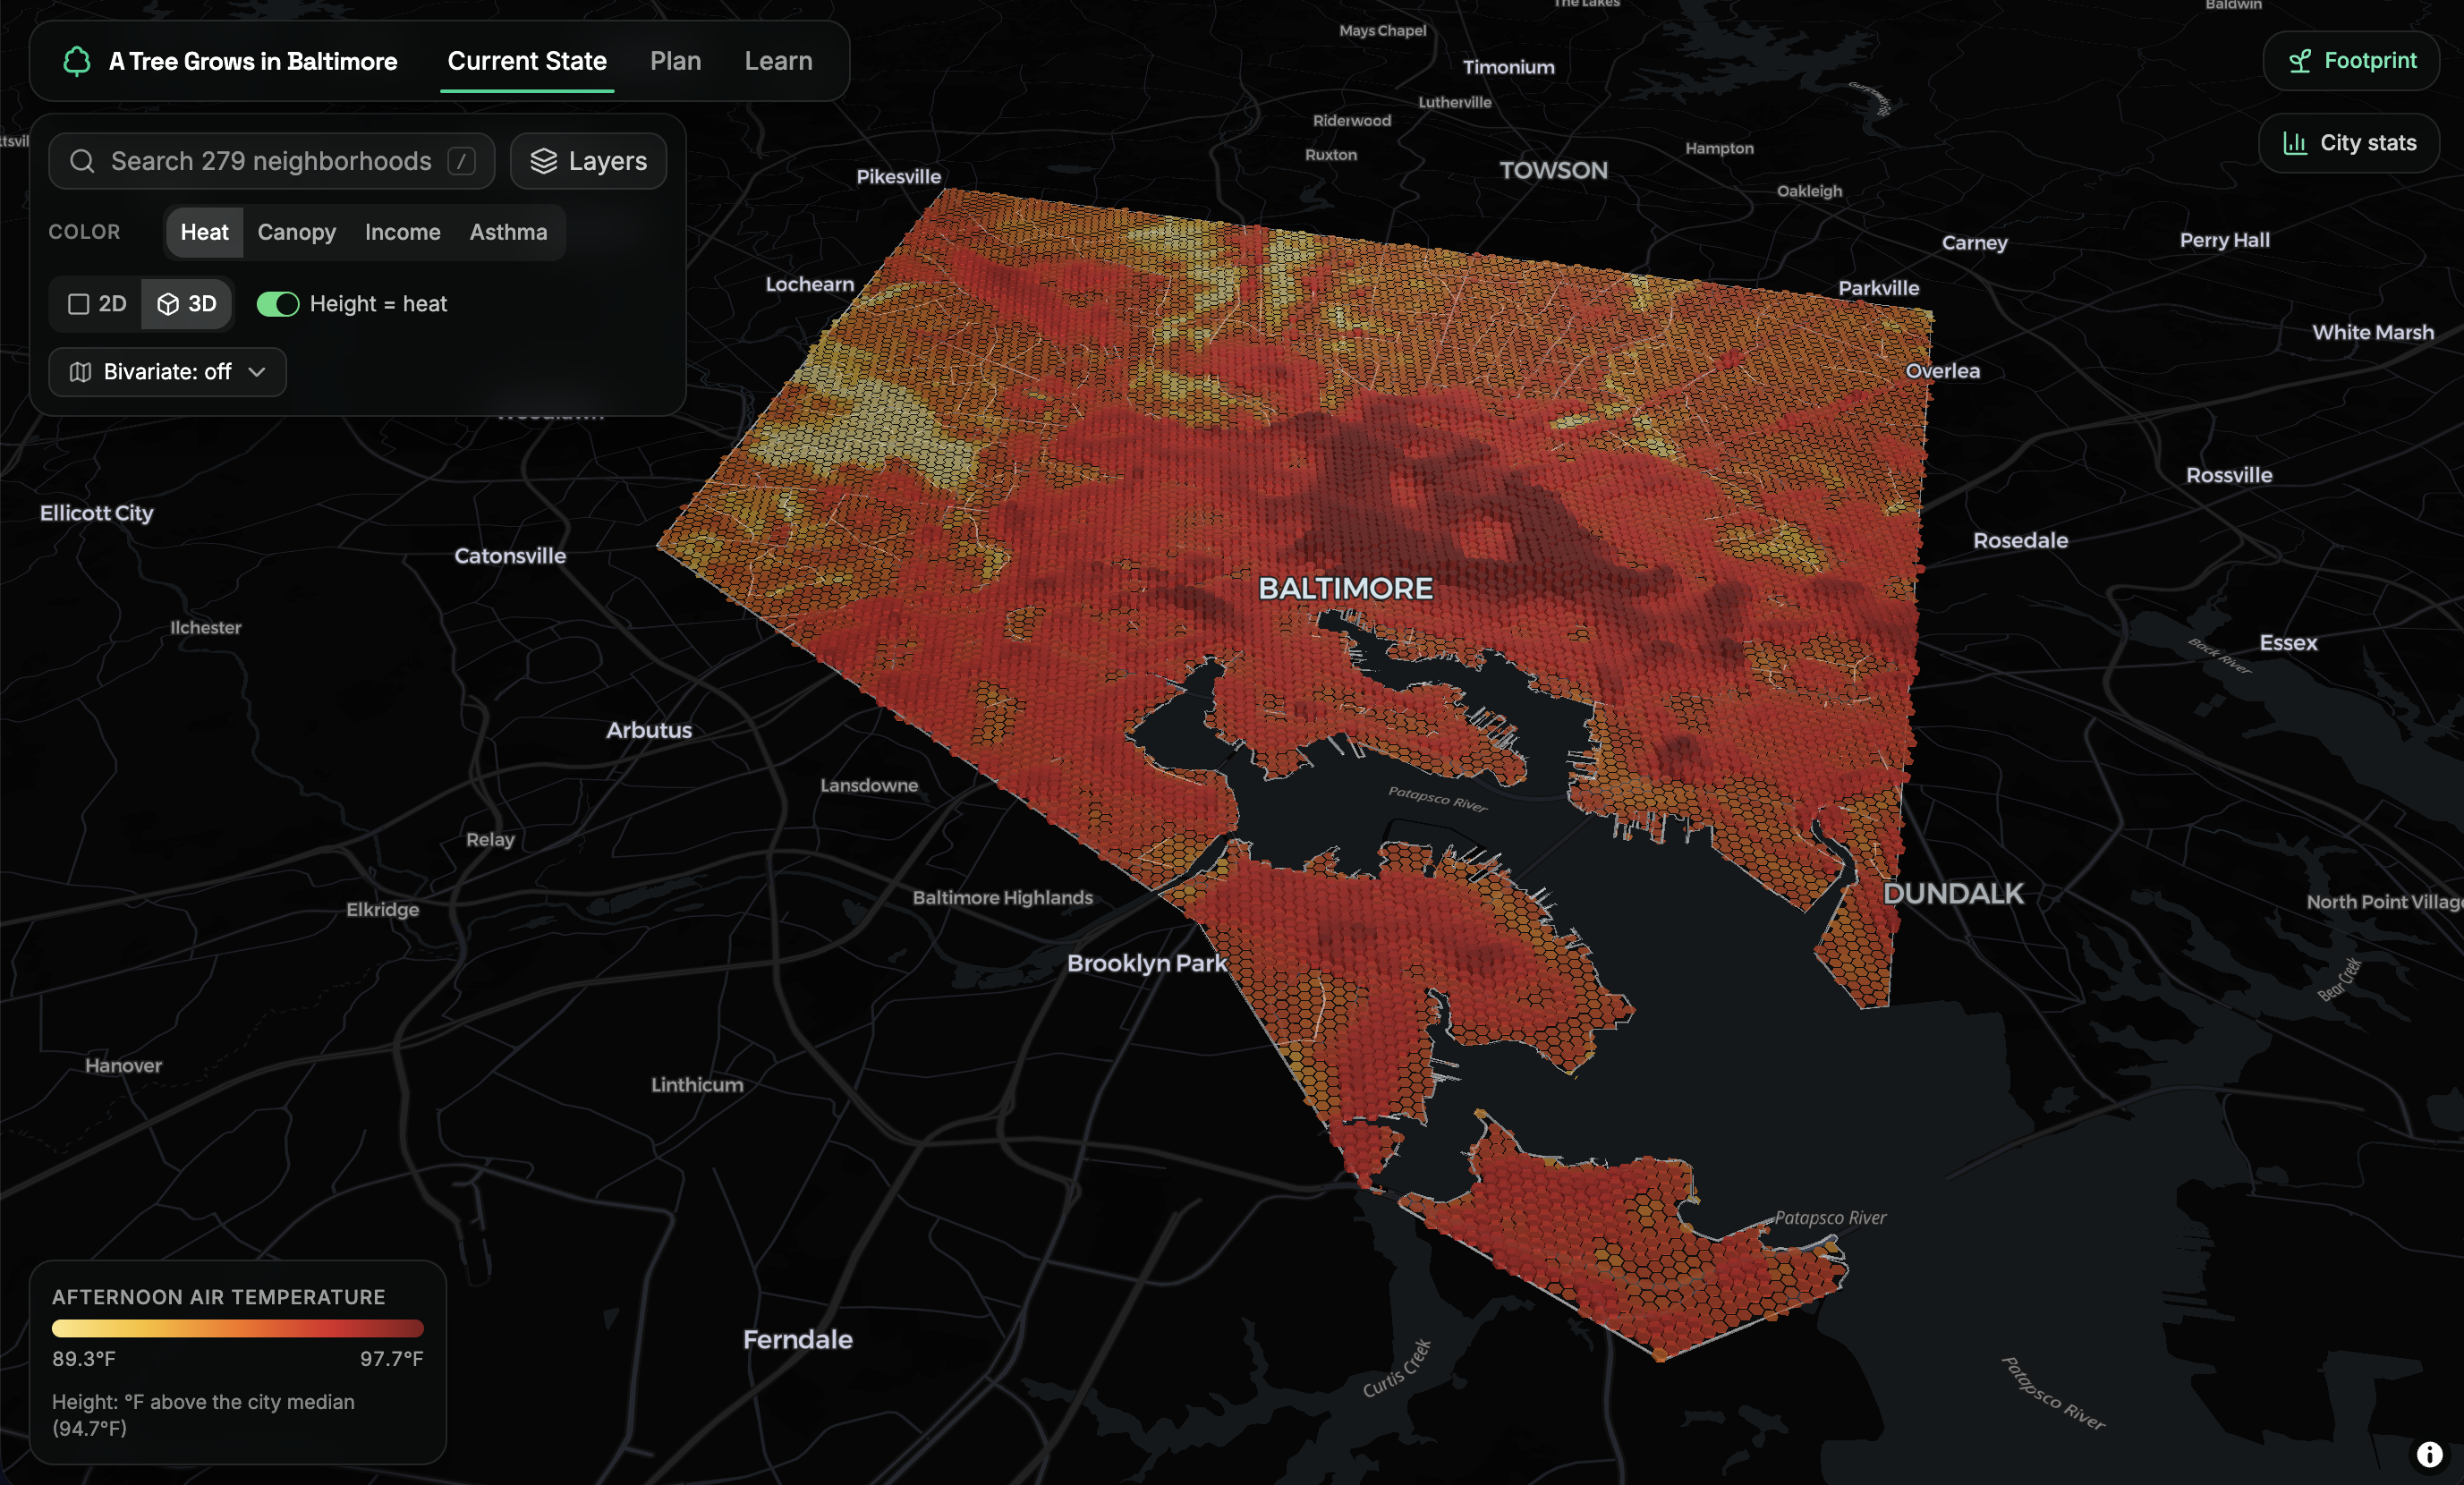
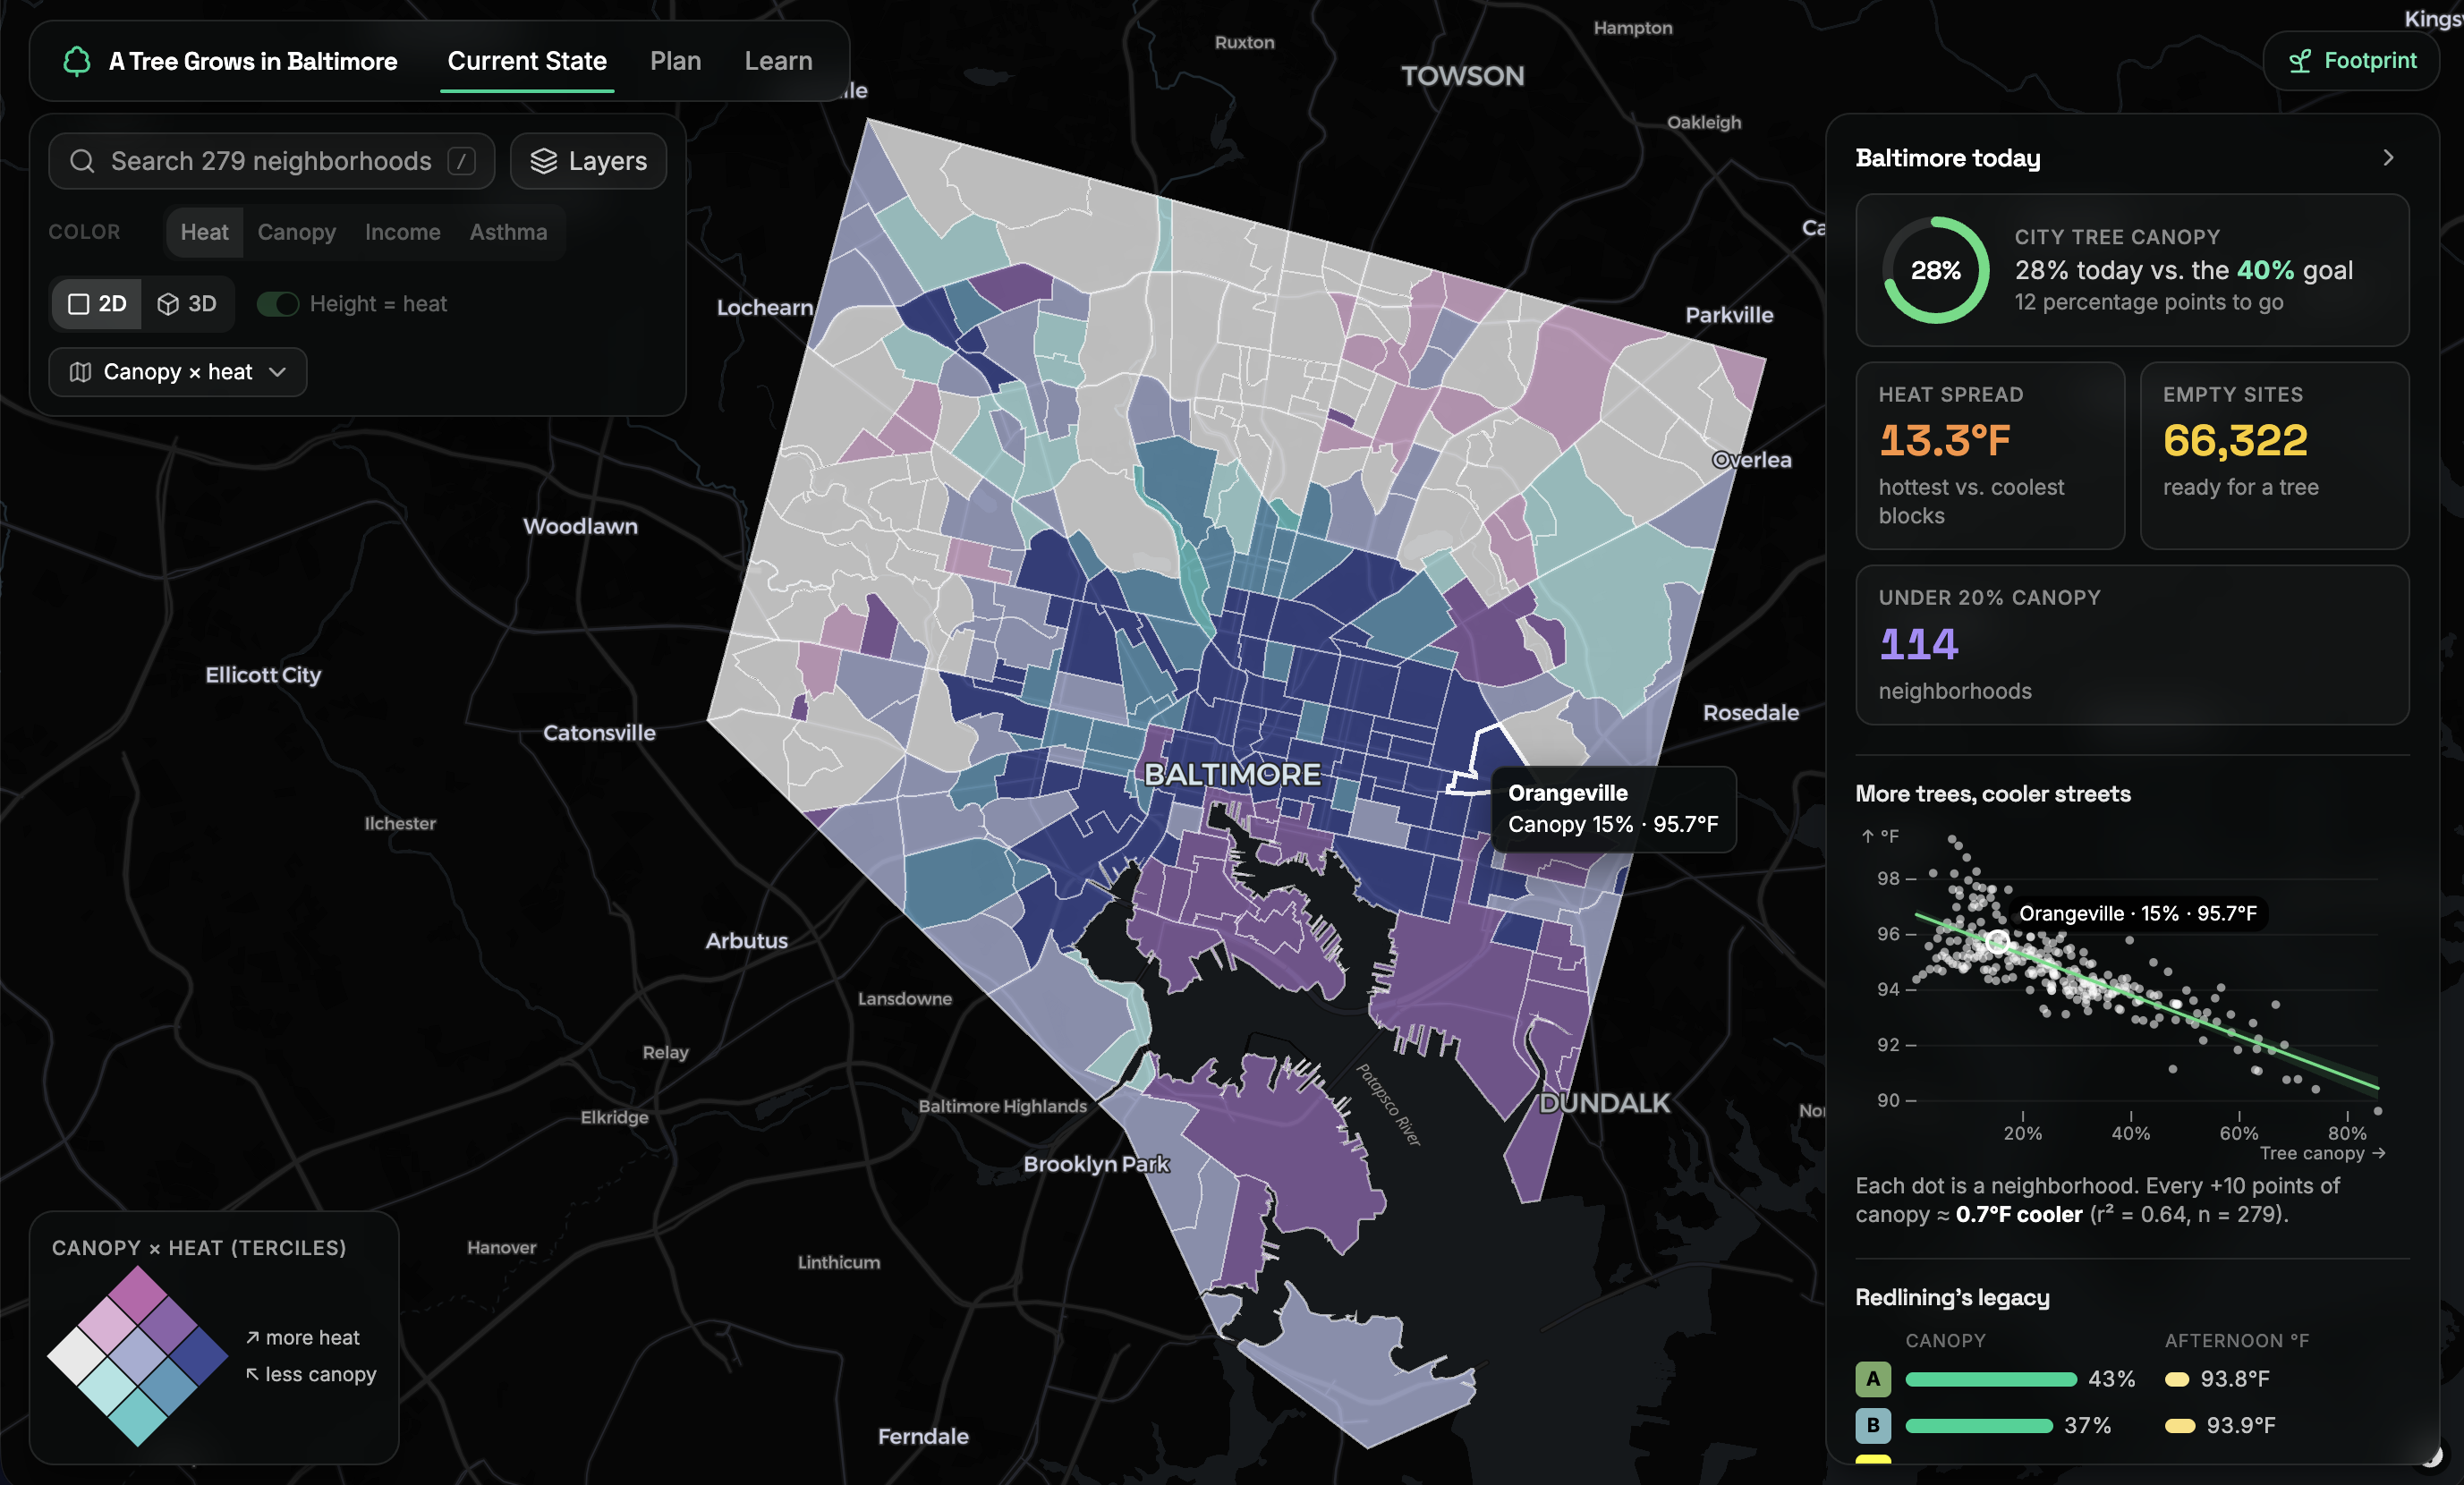
We're all well aware of the imminent threat of global warming, yet environmental conservation never gets the funding it needs. People often say, "just plant more trees," but with limited budgets, that's easier said than done, and in Baltimore, getting it wrong costs lives. From 2012 to 2018, Baltimore accounted for 28% of Maryland's heat-related deaths while holding only about 10% of the state's population (Howard Center for Investigative Journalism, Code Red, 2019). And heat doesn't hit the city evenly: on one August afternoon, Baltimore's hottest blocks were 13.3°F hotter than its coolest, and the hottest areas tend to be low-income and historically marginalized neighborhoods, the same communities least able to escape the heat. With a limited budget, every tree has to count. A Tree Grows in Baltimore uses machine learning to find exactly where new trees would cool the most people, prioritizing the communities that need it most, so that every dollar spent on planting goes as far as it can.
What it does
- Renders 2D and 3D maps of Baltimore and how temperature, canopy, income, and asthma rates change across neighborhoods
- Uses an ML model trained from scratch to predict how temperature responds to different environmental factors
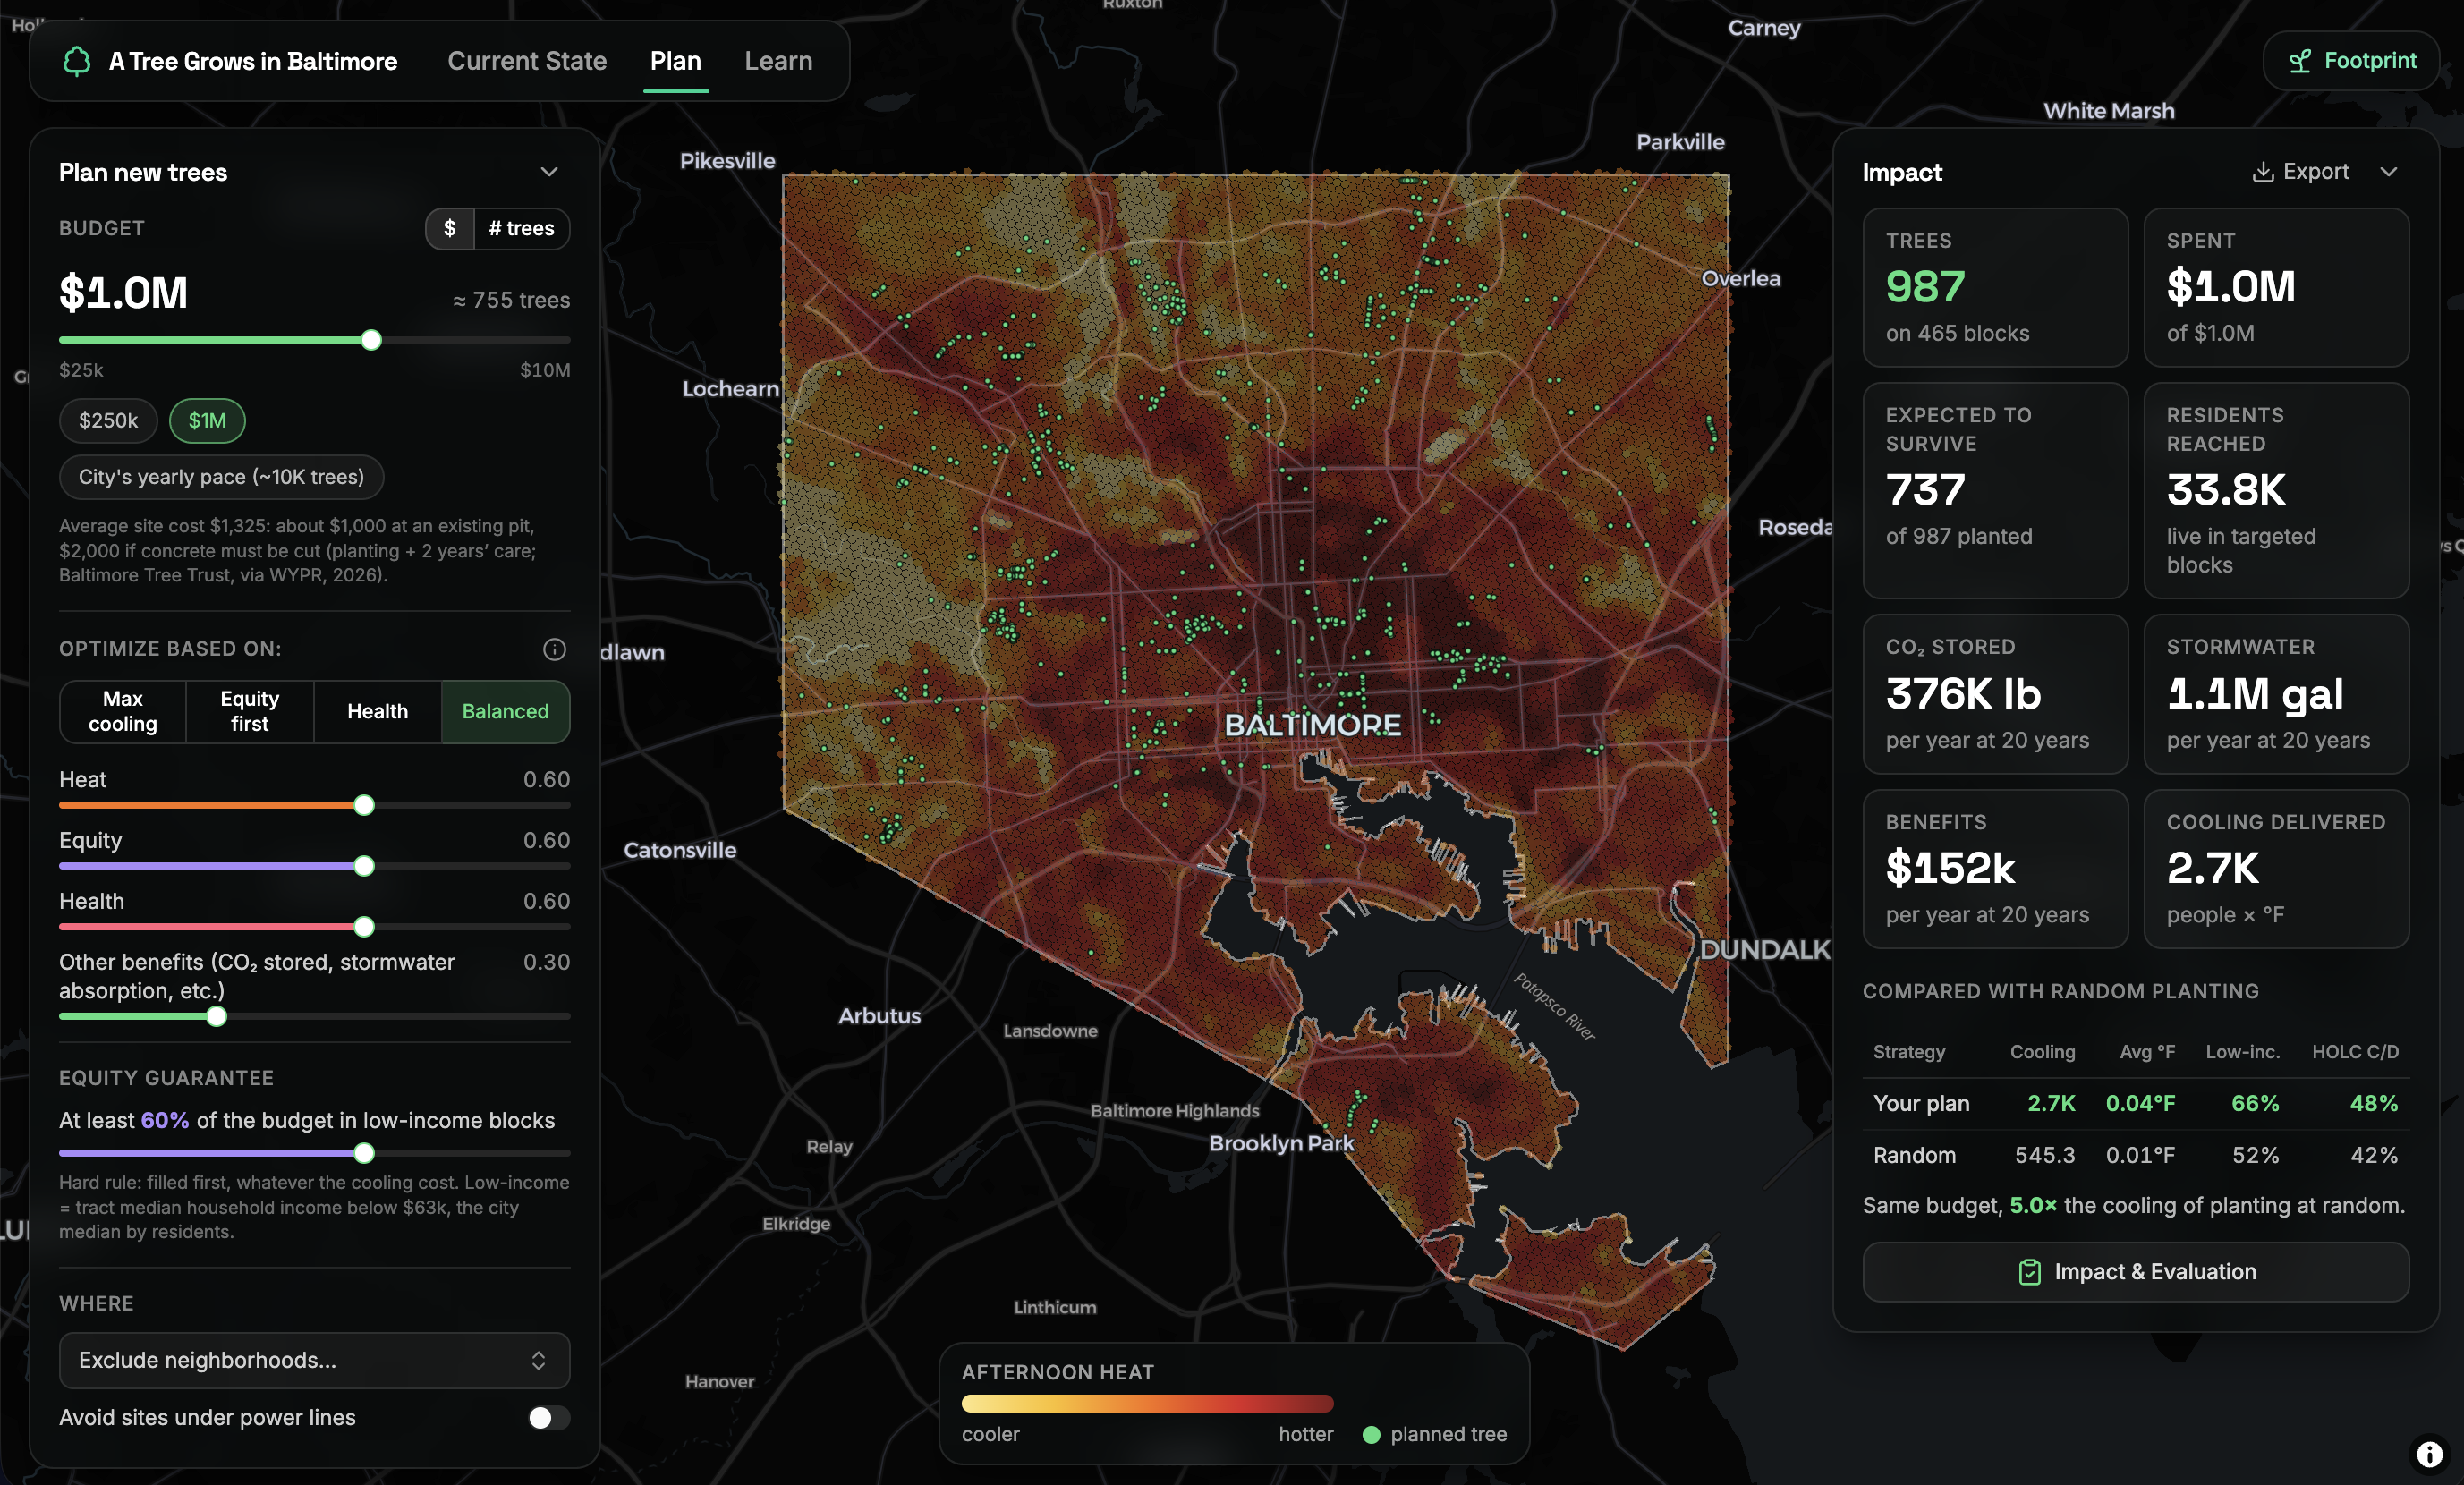
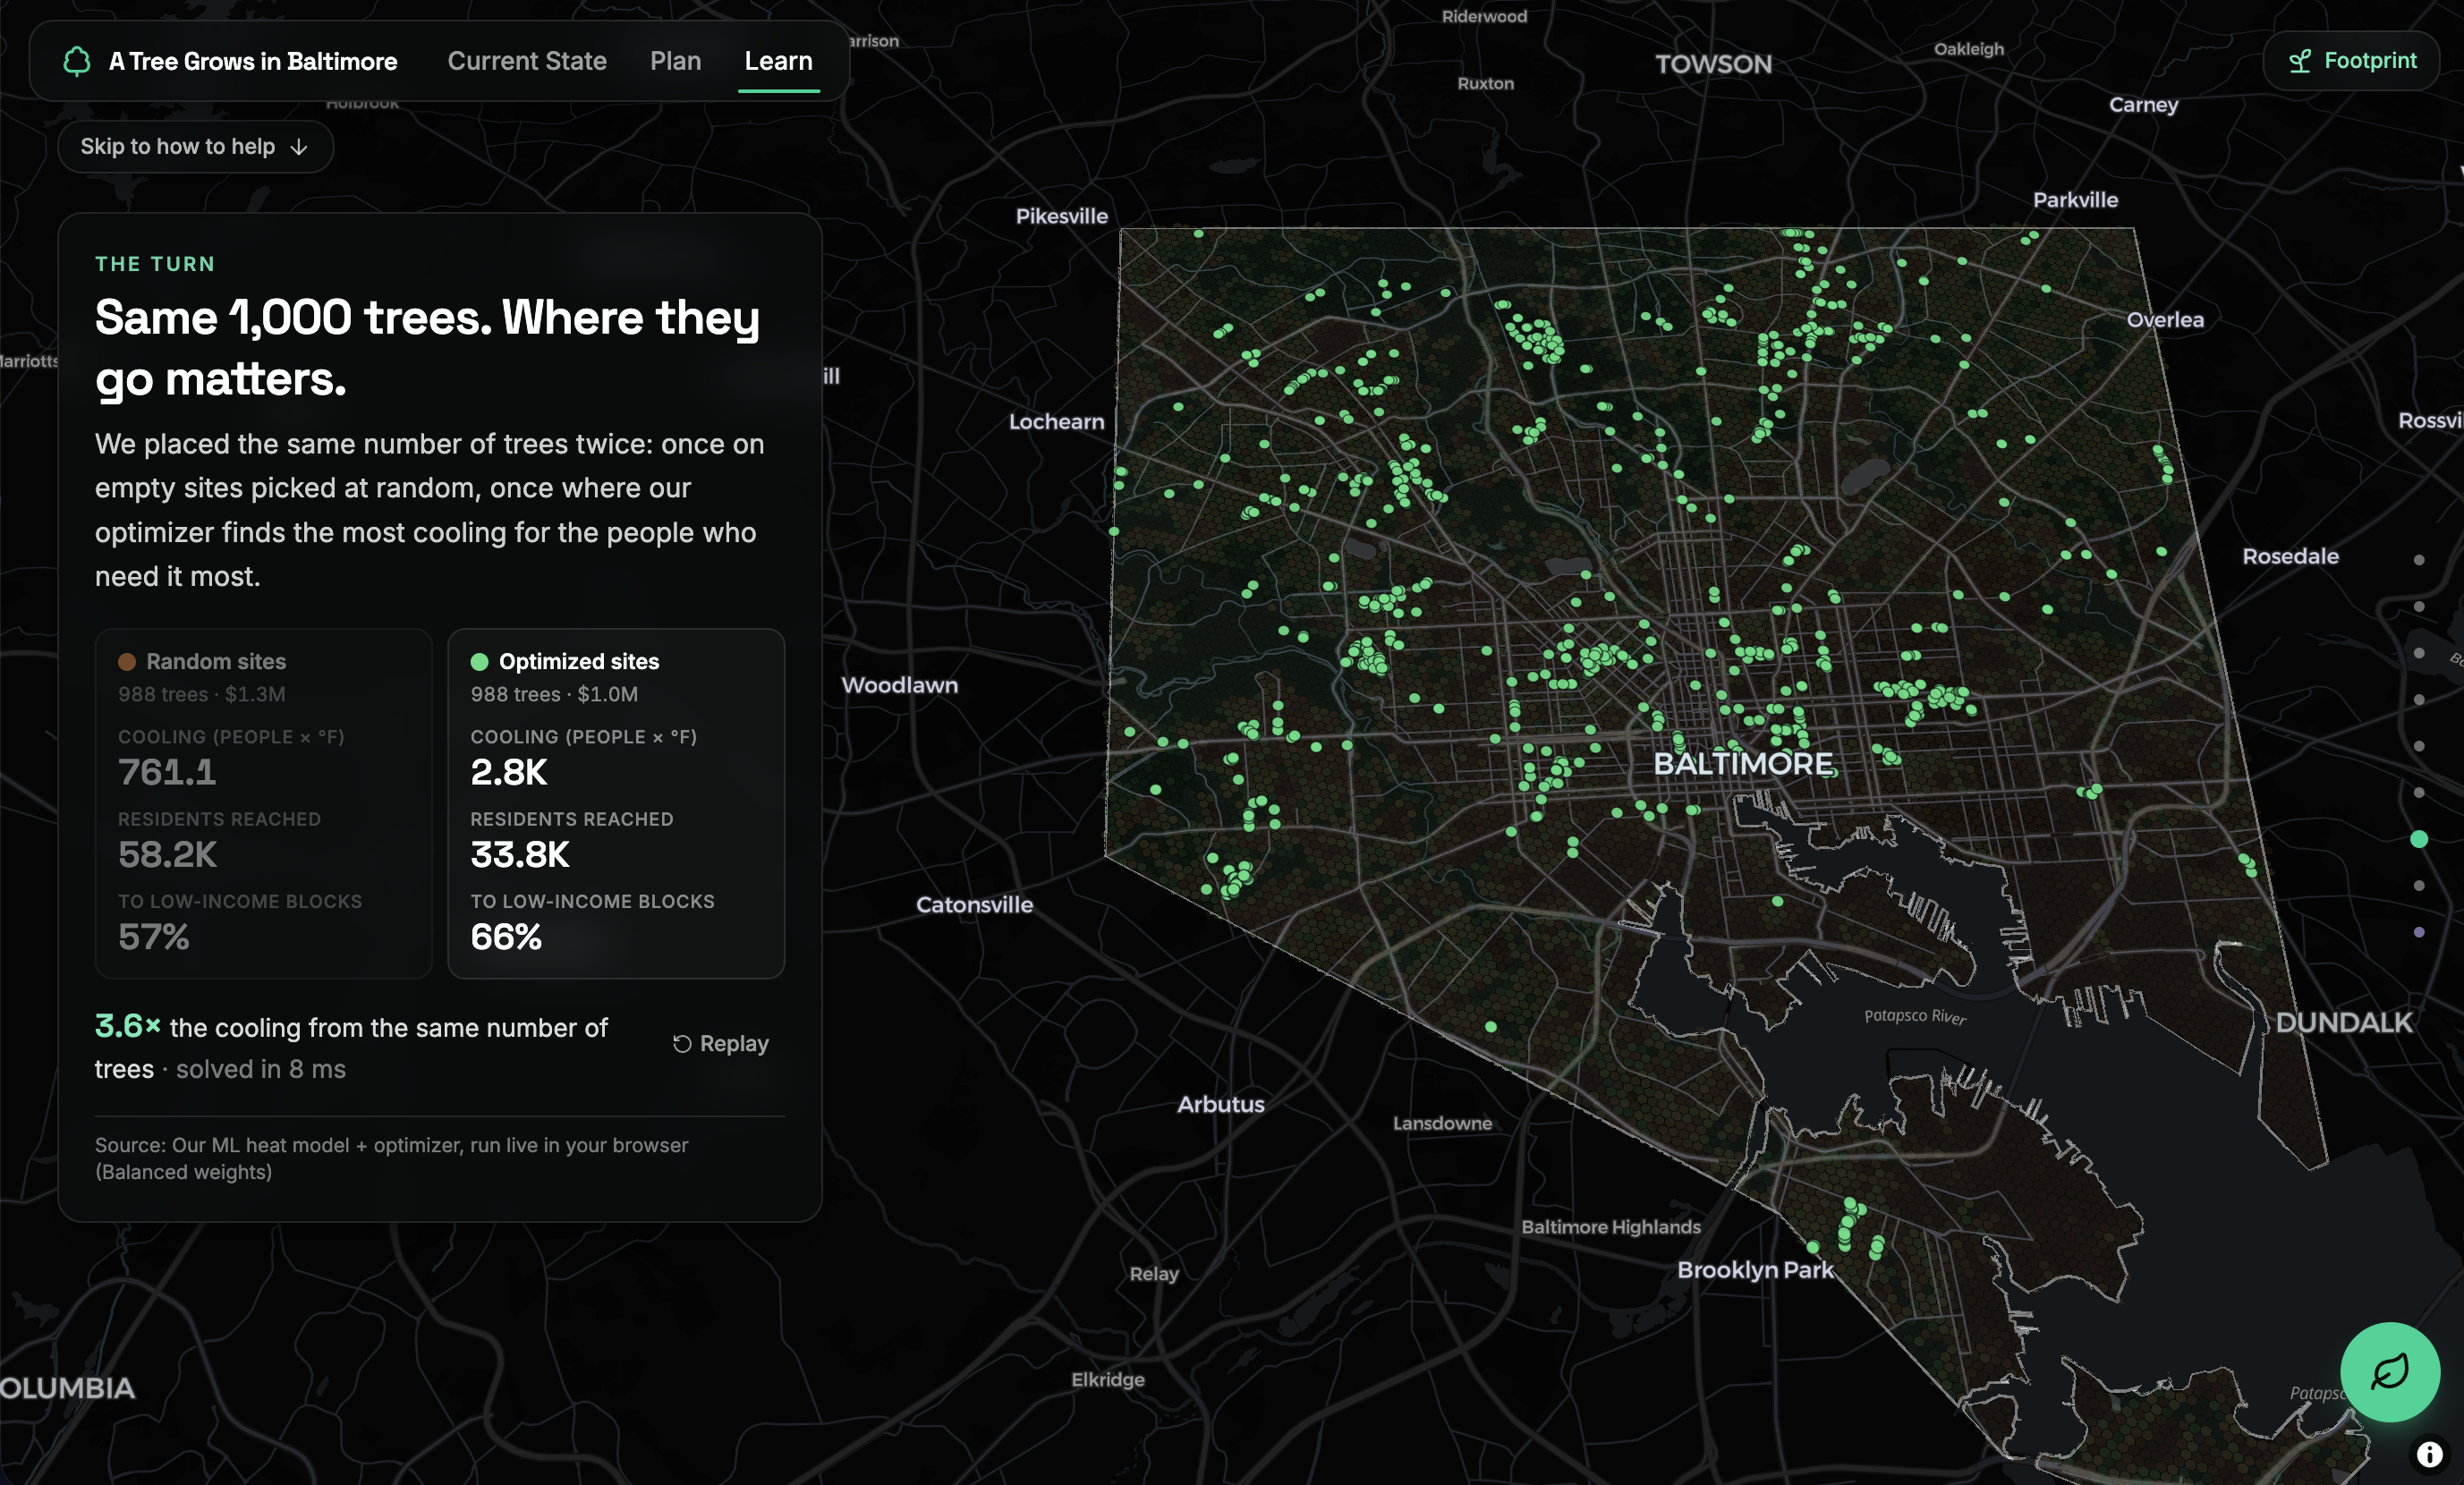
- Identifies optimal locations to plant trees, given a limited budget, to help the most people
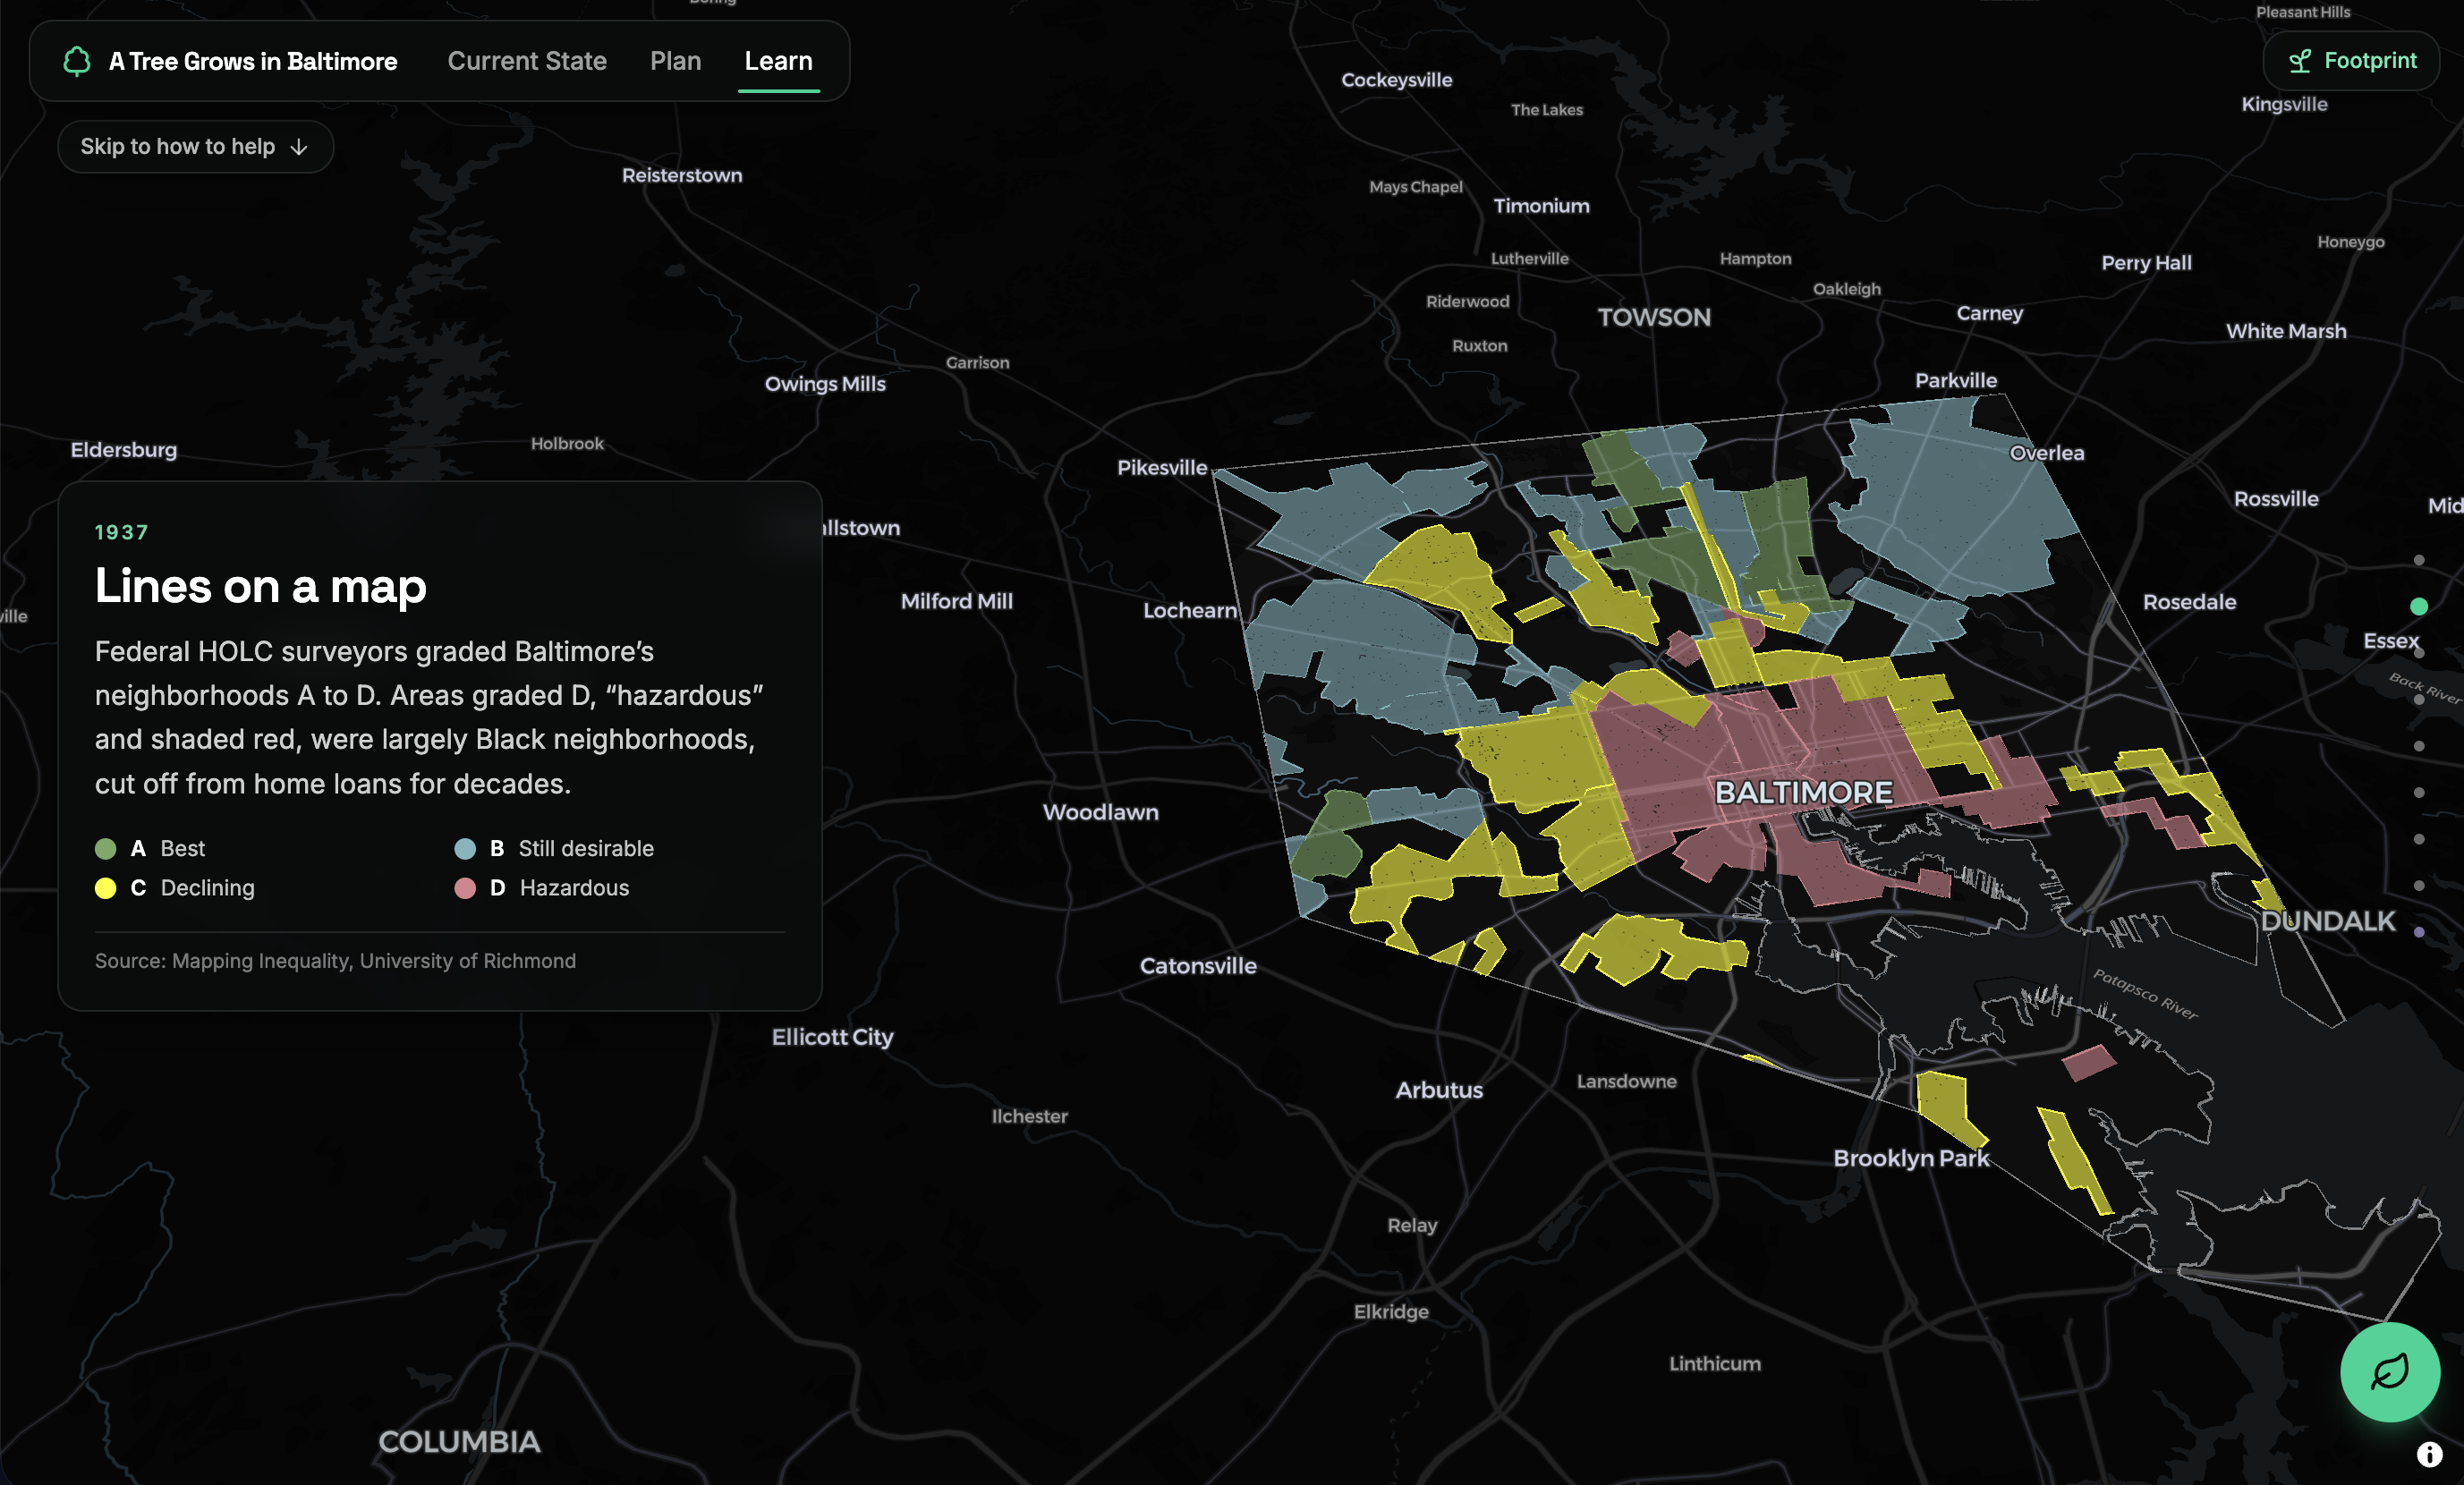
- Animates different visualizations of Baltimore's environment, teaching people about the climate crisis
- Provides resources for people to take action and help cool down Baltimore
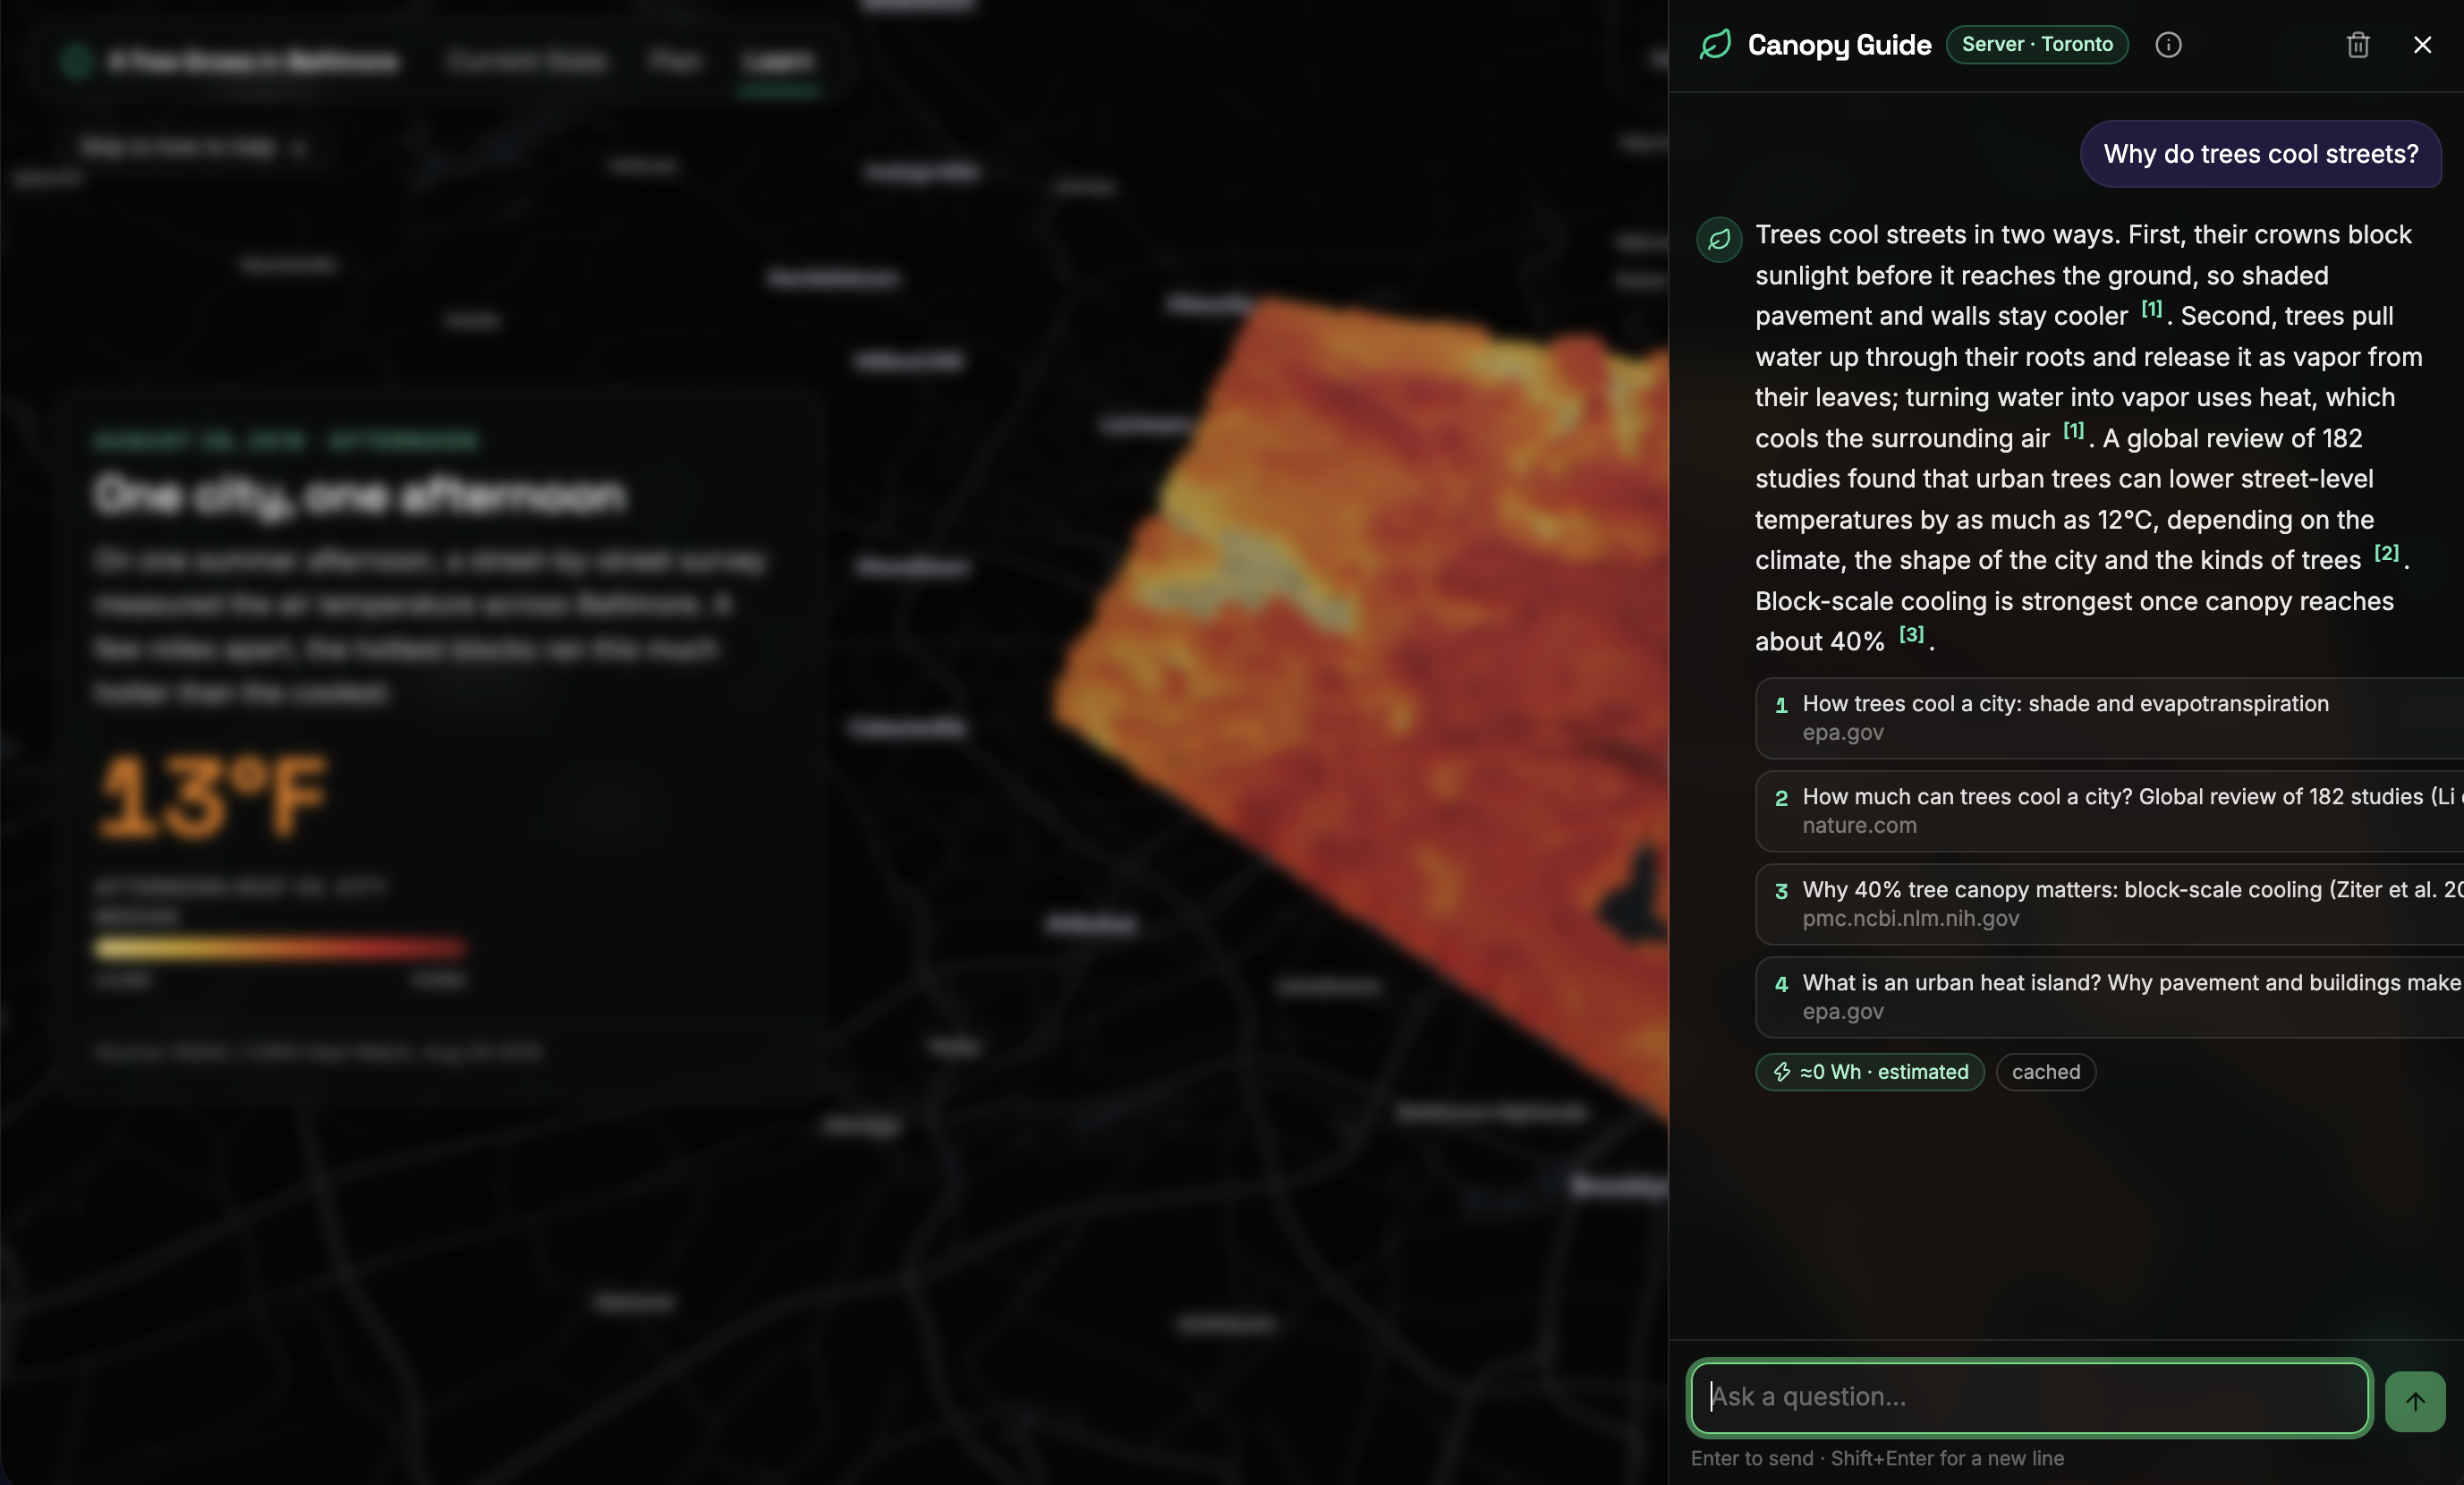
- Allows for chats with a small language model to learn more about planting trees in Baltimore, which is more energy efficient than a general LLM such as GPT or Gemini
How we built it
Data pipeline (Python): Data is aggregated onto an H3 hexagon grid using geopandas, rasterio/rasterstats and h3. I used the following sources:
- the Baltimore Forestry tree inventory (70,156 vacant sites, filtered to the 66,322 that can be planted)
- NOAA/CAPA Heat Watch air temperature
- Chesapeake Bay Program 1-meter land cover
- Census tracts and neighborhood population
- CDC PLACES asthma rates and the CDC Social Vulnerability Index
- Mapping Inequality's HOLC maps
- the Tree Equity Score
Heat model (ML): I trained a LightGBM model from scratch to predict afternoon air temperature from different land-cover features: canopy, pavement, distance to Inner Harbor, etc.
Optimizer: For each block, the model gives a cooling curve: how much each additional tree crown would lower the temperature, including cooling that spills over onto neighboring blocks. For each candidate site, the curve gets weighted by how many people live there, the tree's chance of survival in that area, the site's cost, and more. I implemented a greedy algorithm to optimize this value.
Frontend: React, Vite, TypeScript, Tailwind, and shadcn/ui, MapLibre + deck.gl, zustand, Motion, Observable Plot and scrollama. The trained LightGBM model runs directly in the browser.
Chat backend: FastAPI with Ollama running a small local model (qwen3.5:2b) and embeddinggemma for retrieval. The chat searches a fact-checked corpus of 68 documents using hybrid search (embeddings + BM25). It routes neighborhood and site questions to the app's real data and streams answers with numbered sources. No cloud LLM APIs are used.
Deployment: DigitalOcean App Platform for the site, plus a DigitalOcean Droplet for the chat backend.
Challenges we ran into
- Getting clean animations on the rendered maps... there were a lot of issues with glitching when switching between maps
- Learning how to deploy on Digital Ocean
Accomplishments that we're proud of
- Building a reactive UI that shows many different visualizations and maps
- Building an ML model from scratch
- Building my own chatbot
- Fully deployed application that doesn't just run locally
What we learned
- There is such a dramatic difference in temperature across Baltimore, and low-income communities are hit so much worse by global warming. Not only is the temperature higher, but asthma rates are also higher.
- How to deploy applications using DigitalOcean
- I never worked with map visualizations before, so that was fun to learn!
What's next for A Tree Grows in Baltimore
- Expanding to other cities
- Improving the performance of the chatbot
Built With
- fastapi
- python
- react
- tailwind
- typescript
- vite


Log in or sign up for Devpost to join the conversation.