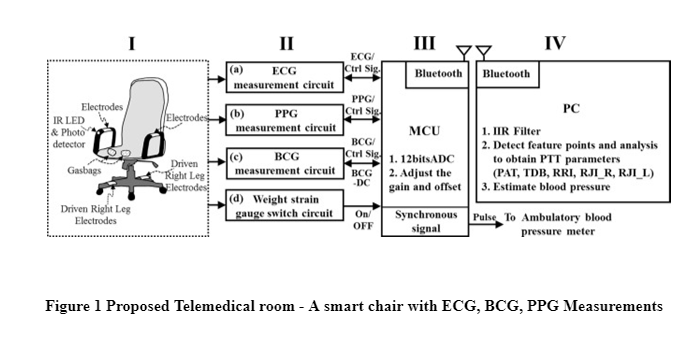
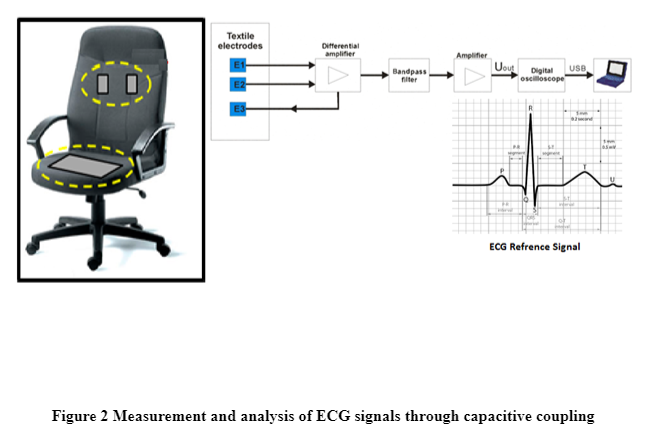
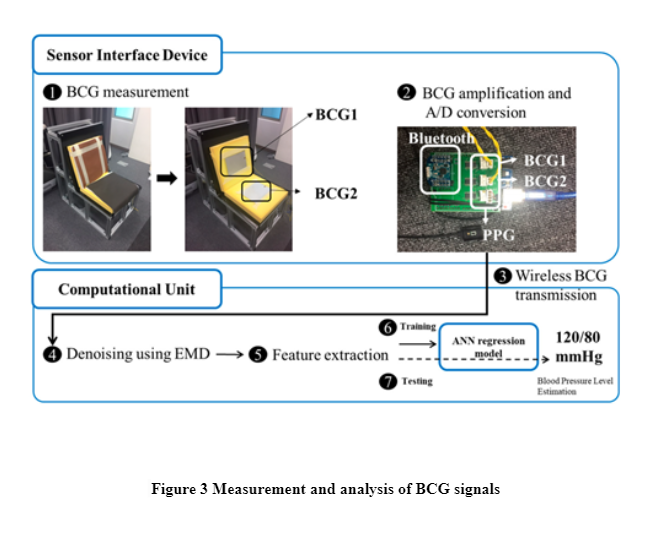
In this work, we present a novel design of an Internet of Things (IoT) and telemedicine based health monitoring system-The Smart Chair. Sensors and associated hardware needed to monitor the vital physiological parameters of the human body are available on the chair, thereby leading to the idea of a Smart Chair. It enables the subject to be seated in a relaxed posture during the acquisition of physiological signals from various sensors attached to his/her body. The raw signals from the sensors are processed digitally by an onboard microcontroller and analyzed for any common abnormalities in the health parameters of the subject. The results are then transmitted to a secured web server using a Wi-Fi module present in the system. The data can be viewed at any later time by a doctor from any remote location on his phone/ computer that is connected to the Internet. The subject can also have the results transmitted to his/her own phone using a custom Android application which receives the data from the Smart Chair using Bluetooth. The snapshot of results along with the corresponding text file can be sent as an Email/ MMS to a remote doctor for a quick feedback. The Smart Chair also sends an SMS with all the health details to a remote doctor's phone in case of an emergency, thus facilitating telemedicine in rural areas. Throughout the design phase of the system, the cost was kept minimal. The key focus of the presented work is to propose the design of a product that will be useful and easily affordable by the people of developing nations who have limited access to proper healthcare facilities. For Sick, disabled, Old age it is important to have frequent monitoring of health and that too in a less painful way. The normal treatment or health monitoring of such patients would require them to go to the hospitals, wait for a long time and go through a series of medical tests moving here and there in the hospital. For Old age people it might be a tough time to go through all these. For children it might be difficult to make them cooperate for such conditions. Hence we have come out with a product that would ease the whole process and also make patients be more cooperative. A. Measurement of ECG signals through cloth material provided The ECG signal is measured through capacitive coupled electrodes installed in the seat that includes a high-input impedance amplifier and sensing electrode surface. The system is composed of two parts: active electrodes and data acquisition unit. The proposed system contains 3 electrodes: 2 active electrodes for measurement of bipolar ECG lead and one Right Leg Drive (RLD) electrode to reduce mains noise. The active electrode provides transfer of signal from the human body through clothes to the acquisition unit which is responsible for digitalization of the measured signal and sending of the digitized signal into Personal Computer (PC). Data acquisition unit is responsible for digitalization of measured signals and sending of measured digital data into the PC. Impedance between skin and sensor will be relatively high because of the insulating effect produced by the clothing. In each of the cathode sections we need to convert the displacement current into a voltage and this can be achieved using the high input impedance amplifier. The capacitive electrodes are placed on the vertical part of the seat and the RLD electrode is placed on the horizontal part of the seat. The RLD electrode is represented by a conductive plate which is connected to the RLD output of the ADS1191. Measured subject is sitting on the RLD electrode and bipolar ECG is measured from the person's back by a pair of active electrodes. The device is supplied by a 12V DC adapter. Active electrodes are connected with the data acquisition unit via shielded cables. The active electrode was created from a two-sided printed circuit board (PCB) with a surface of 4 x 4 cm squared. Each passive and active component and pads for connections of shielded cables were placed on the component side. The second side of the PCB presents the face of the electrode. A guard plate was created to reduce leakage current which can be responsible for increasing the noise. B. Measurement of BCG signals through cloth material provided Ballistocardiography (BCG) is a technique to monitor mechanical activity of the heart by recording mechanical forces on the body’s surface. We used a thin and flexible foil, consisting of charged polymer layers containing air voids that behave in a similar way to electrical capacitors. Mechanical activity causes physical deformations of the sensor’s geometry. If the geometry of the enclosed air voids changes, their electrical charges move with respect to each other. These charge shifts can be measured by the sensor electrodes, converted to a voltage signal, and subsequently displayed as an ECG related signal. The BCG sensor acquired mechanical movement by a change of charge with 1000 Hz. The calculating time allowed an almost real-time analysis with a latency of less than 2 seconds. Heart contraction valve movement, blood flow, respiration, muscular activity and other mechanical activities were measured by the BCG foil and were part of the resulting BCG signal. Depending on the subject’s position related to the sensor, the force vector of each mechanical activity produced corresponding amplitudes. The superposition of different mechanical vectors impaired the signal analysis, so that the genuine signal had to be cleaned by filtering for the specific frequency range Therefore, to obtain the blood pressure, the instantaneous phase was obtained from the above signal by using Hilbert transform and IPD was determined. The blood pressure value will be estimated by taking the median of the IPD values of two to BCD signals. An artificial neural network is used for regression analysis and finally the blood pressure value will be estimated from the BCG signal transmitted.
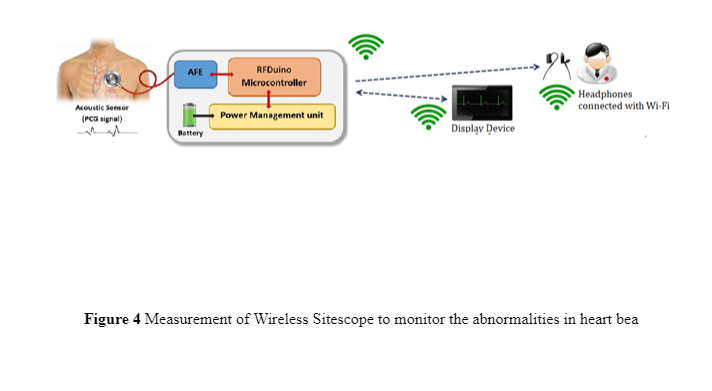
C. Measurement of PPG signals through cloth material provided In order to obtain the PPG signal we can place a 3 series of LEDs at the back of the chair and 3 series of photo detectors to collect the reflected light back. 3 series of LEDs have been placed in order to increase the intensity of the light for transmission and to produce circular emission patterns. In order to obtain the PPG signal through clothing we are showing that the cloth behaves as an additional tissue layer and it observes a few amounts of light. Therefore, when a PPG sensor is placed at their back of chair we need to consider that there are three tissues present at the front of LED light. The first tissue is considered as the material off the chair and the second issue is considered as the cloth that is wearied by a human and the third tissue is considered as be normal human body tissue. Show the variation of intensity of light should be done. The intensity variations of the LED can be provided by the different output voltages produced by digital to analogue converter. D. HR Monitoring & BP Estimation The heart rate and blood pressure can be calculated from the obtained ECG PPG and BCG signals. By measuring the correlation factor and mean of the ECG and BCG signal the cardiac cycle can be calculated. Using regression algorithms and calculating the interludes among neighboring R crests of ECG and J crests of BCG the hundred can be estimated and compared with the derivative of PPG signals. When a patient enters into this Telemedical room and sits in the smart chair, the biological signal of the patient will be estimated and displayed on the screen and also will be transmitted to the doctor through a 5G communication environment. The smart chair will be able to obtain ECG BCG and PPG signal and also estimate the temperature of the patient and transmitted directly e to the doctor and the heart rate and blood pressure measurement with the temperature of the patient can be estimated from the above signals and displayed on the screen which helps the patient to know the detail about his body condition. D. Wireless Setescope to monitor the abnormalities in heart beat: The beating of the heart and the resulting flow of blood through the heart produces heart sound. The heart sounds S1 and S2 are high-pitched sounds and heard well from the diaphragm of the stethoscope. The normal heart sounds S1 and S2 have frequency ranges of 50–60 Hz and 80–90 Hz, respectively. S3 can be heard during the rush of blood entry to the ventricle from the atrium and is normally a pre-diastolic low-pitched sound and has a bandwidth of 20–30 Hz. The fourth heart sound (S4) happens at the end of the diastole, which is a low-pitched sound and can be well-characterized by the bell of the stethoscope and has a frequency range below 20 Hz. Despite being audible, S1 and S2 have their amplitude vary and sometimes become very weak and could not be heard due to abnormalities. A real-time heart sound signal acquisition, amplification, filtering, digitization, and wireless transmission are accomplished by the sensor sub-system. A custom sensor was designed and implemented using a traditional stethoscope chest piece to amplify the heart sound waveform. A small microphone sensor with bandwidth of 20–600 Hz is selected to perform the conversion of the heart sound to electrical signal. The microphone was placed in the rubber tubing very close to the chest piece as shown in Figure. This also includes analogue front end (AFE), and RFduino microcontroller with embedded Wi-Fi module. The custom-built stethoscope acquires the acoustic signal, amplifies and filters it through AFE, and then digitizes and transmits the raw data to the decision-making subsystem. The AGE is required to maintain a high signal-to-noise ratio (SNR), high common mode rejection, and less baseline drift and saturation problems. The pre-amplifier circuit takes the very weak heart sound signals from a microphone and amplifies it to the suitable level. RFduino uses Arduino IDE as a user interface program, which allows testing and running of pre-written sketches and takes advantage of the existing libraries. RFduino has a 10-bit analog-to-digital (ADC) module, which is capable of acquiring the acoustic signal at 500 Hz sampling rate with the resolution of 2.93 mV. Moreover, the dimension, low-power consuming feature, 3.0V operating voltage, and built-in BLE module made RFduino an excellent choice for this application. The sensor subsystem is powered through a Li-ion battery that is connected directly through a Power Cell board. The power management module (PMM) is a boost converter (to 3.3 V and 5 V) and micro-USB charger in one. The boost converter has solder jumper selectable 5 V and 3.3 V output, and an under-voltage protection of 2.6 V. The module can be charged by mobile charger using an on-board micro-usb connector and is capable of delivering 3.3 V or 5 V. The PMM is configured to provide 3.3 V output to the RFduino, and the AFE module.


Log in or sign up for Devpost to join the conversation.