-
Dashboard
-
Code
🚀 What Inspired Us Hand injuries are among the most common and severe incidents in manufacturing, often resulting in amputations, fractures, or long-term disability. While OSHA collects thousands of injury reports, most insights remain hidden inside unstructured text fields. We wanted to unlock those hidden patterns and transform safety data into actionable intelligence using the power of AI and NLP.
🛠️ How We Built It Data Source: We used OSHA’s Severe Injury Reports dataset, filtering for Manufacturing industries and incidents involving hands, fingers, or thumbs.
Data Cleaning (Python): Cleaned and filtered 20,000+ records using pandas and datetime. Missing values were handled, and date columns were standardized.
NLP & AI (spaCy + Rule-Based Logic):
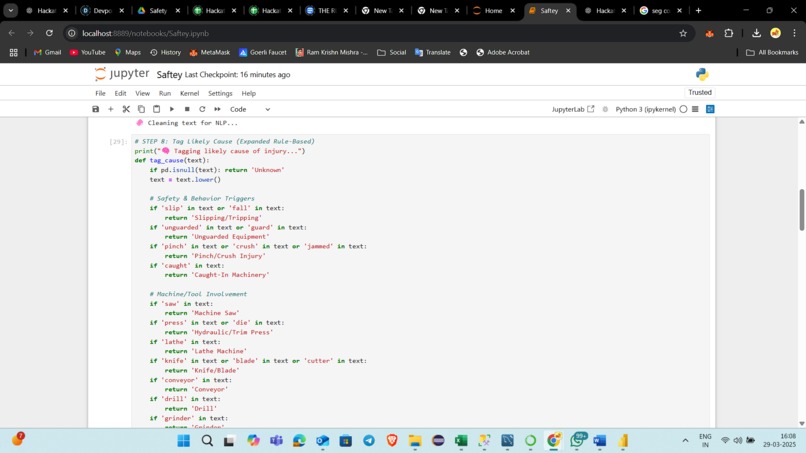
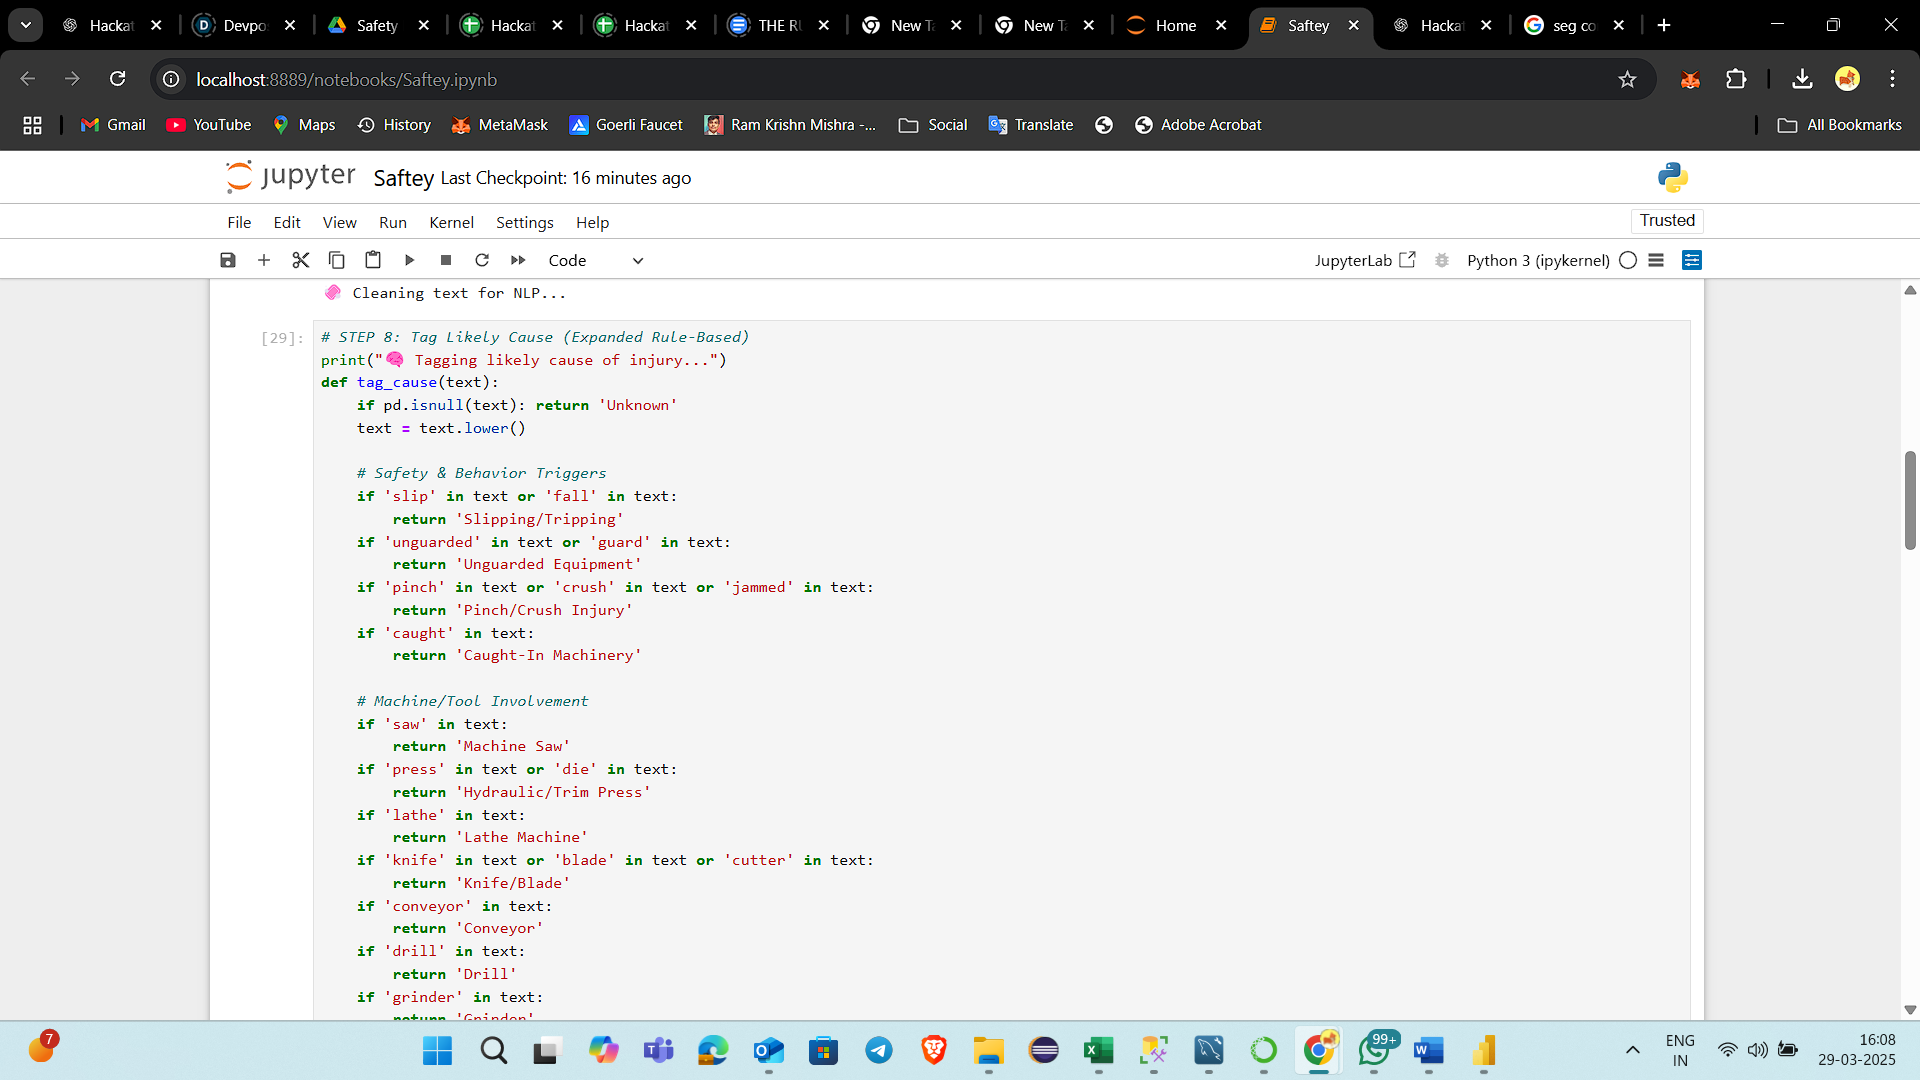
Used rule-based keyword tagging to detect likely injury causes (e.g., "unguarded equipment", "slipping", "machine saws").
Used spaCy NER to extract entities like machines, tools, and affected body parts from narrative text.
Extracted top keywords from narratives using CountVectorizer to find recurring terms and themes.
Data Enrichment: Added new columns like Likely Cause, Cleaned Source, Narrative Entities, and Month.
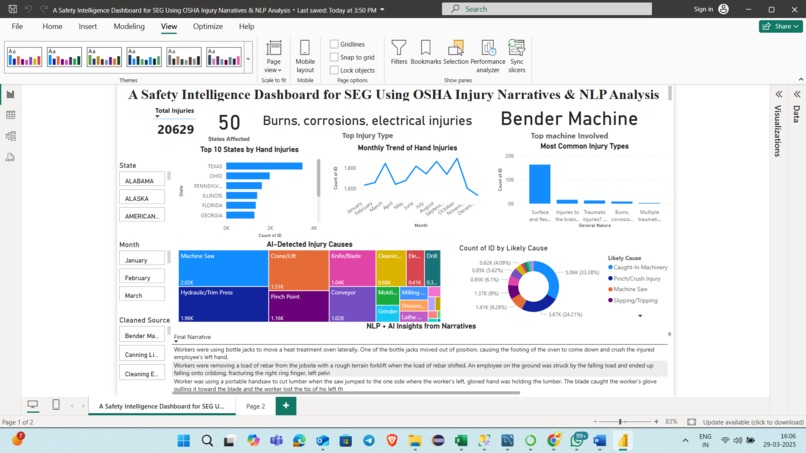
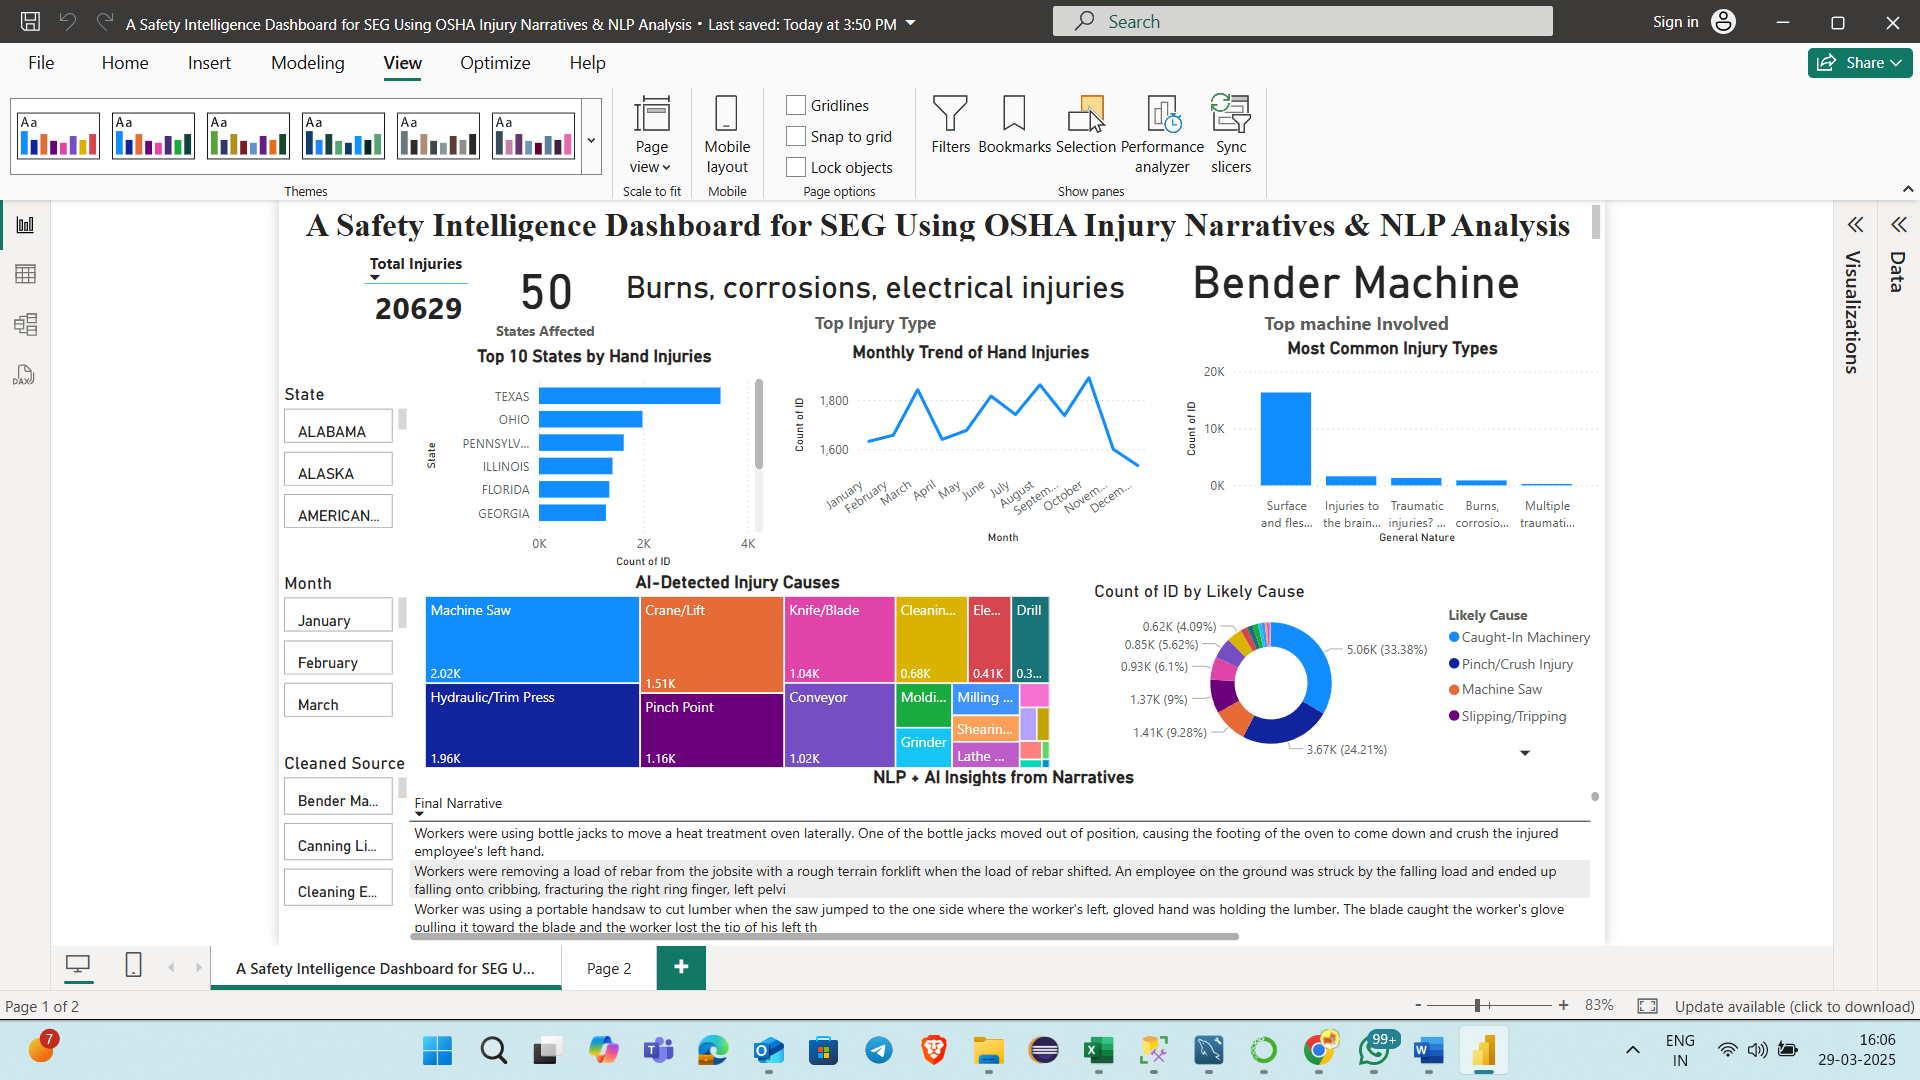
Dashboarding (Power BI): Built an interactive dashboard with slicers, AI-tagged causes, KPI cards, timeline analysis, and raw narrative visibility.
🎯 What We Learned How to apply Natural Language Processing (NLP) to messy real-world safety data
How simple rule-based AI can bring huge clarity to unstructured incident reports
The importance of visual storytelling in turning data into decision-ready insights
How to design a user-friendly dashboard that speaks to both technical and non-technical stakeholders
🧗 Challenges We Faced The narrative text was unstructured, inconsistent, and often noisy — requiring creative keyword engineering.
Many causes were not labeled in the dataset, so we had to build our own tagging logic for AI-based categorization.
Choosing the right visuals and layout in Power BI to balance detail with clarity.
Making the NLP pipeline fast and understandable within a limited timeframe.
✅ Impact This dashboard gives safety managers, analysts, and manufacturing leaders a clear view of what’s causing hand injuries, where they’re happening, and how to reduce them — potentially saving lives and millions in workplace injury costs.
Built With
- excel
- jupyter-notebook
- matplotlib
- pandas
- power-bi
- python
- scikit-learn
- spacy

Log in or sign up for Devpost to join the conversation.