Predicting Apartment Performance in a Post-COVID World
Inspiration
Before COVID-19, the apartment rental market followed predictable patterns: proximity to downtown, dense amenities, and short commutes drove revenue growth. Then the pandemic hit, and everything changed. Remote work, health concerns, and lifestyle shifts fundamentally rewrote renter preferences.
When we analyzed 8,000 apartment properties across the Sun Belt, we discovered a shocking pattern: only 20% of top-performing properties (2015-2020) remained top performers post-COVID (2022-2025). Pre-COVID success factors became post-COVID liabilities. The old playbook was obsolete.
This challenge inspired us to build machine learning models that could capture this structural break and predict which properties would thrive in the new normal.
What it does
Our solution predicts apartment RevPAR (Revenue Per Available Unit) growth with state-of-the-art accuracy by:
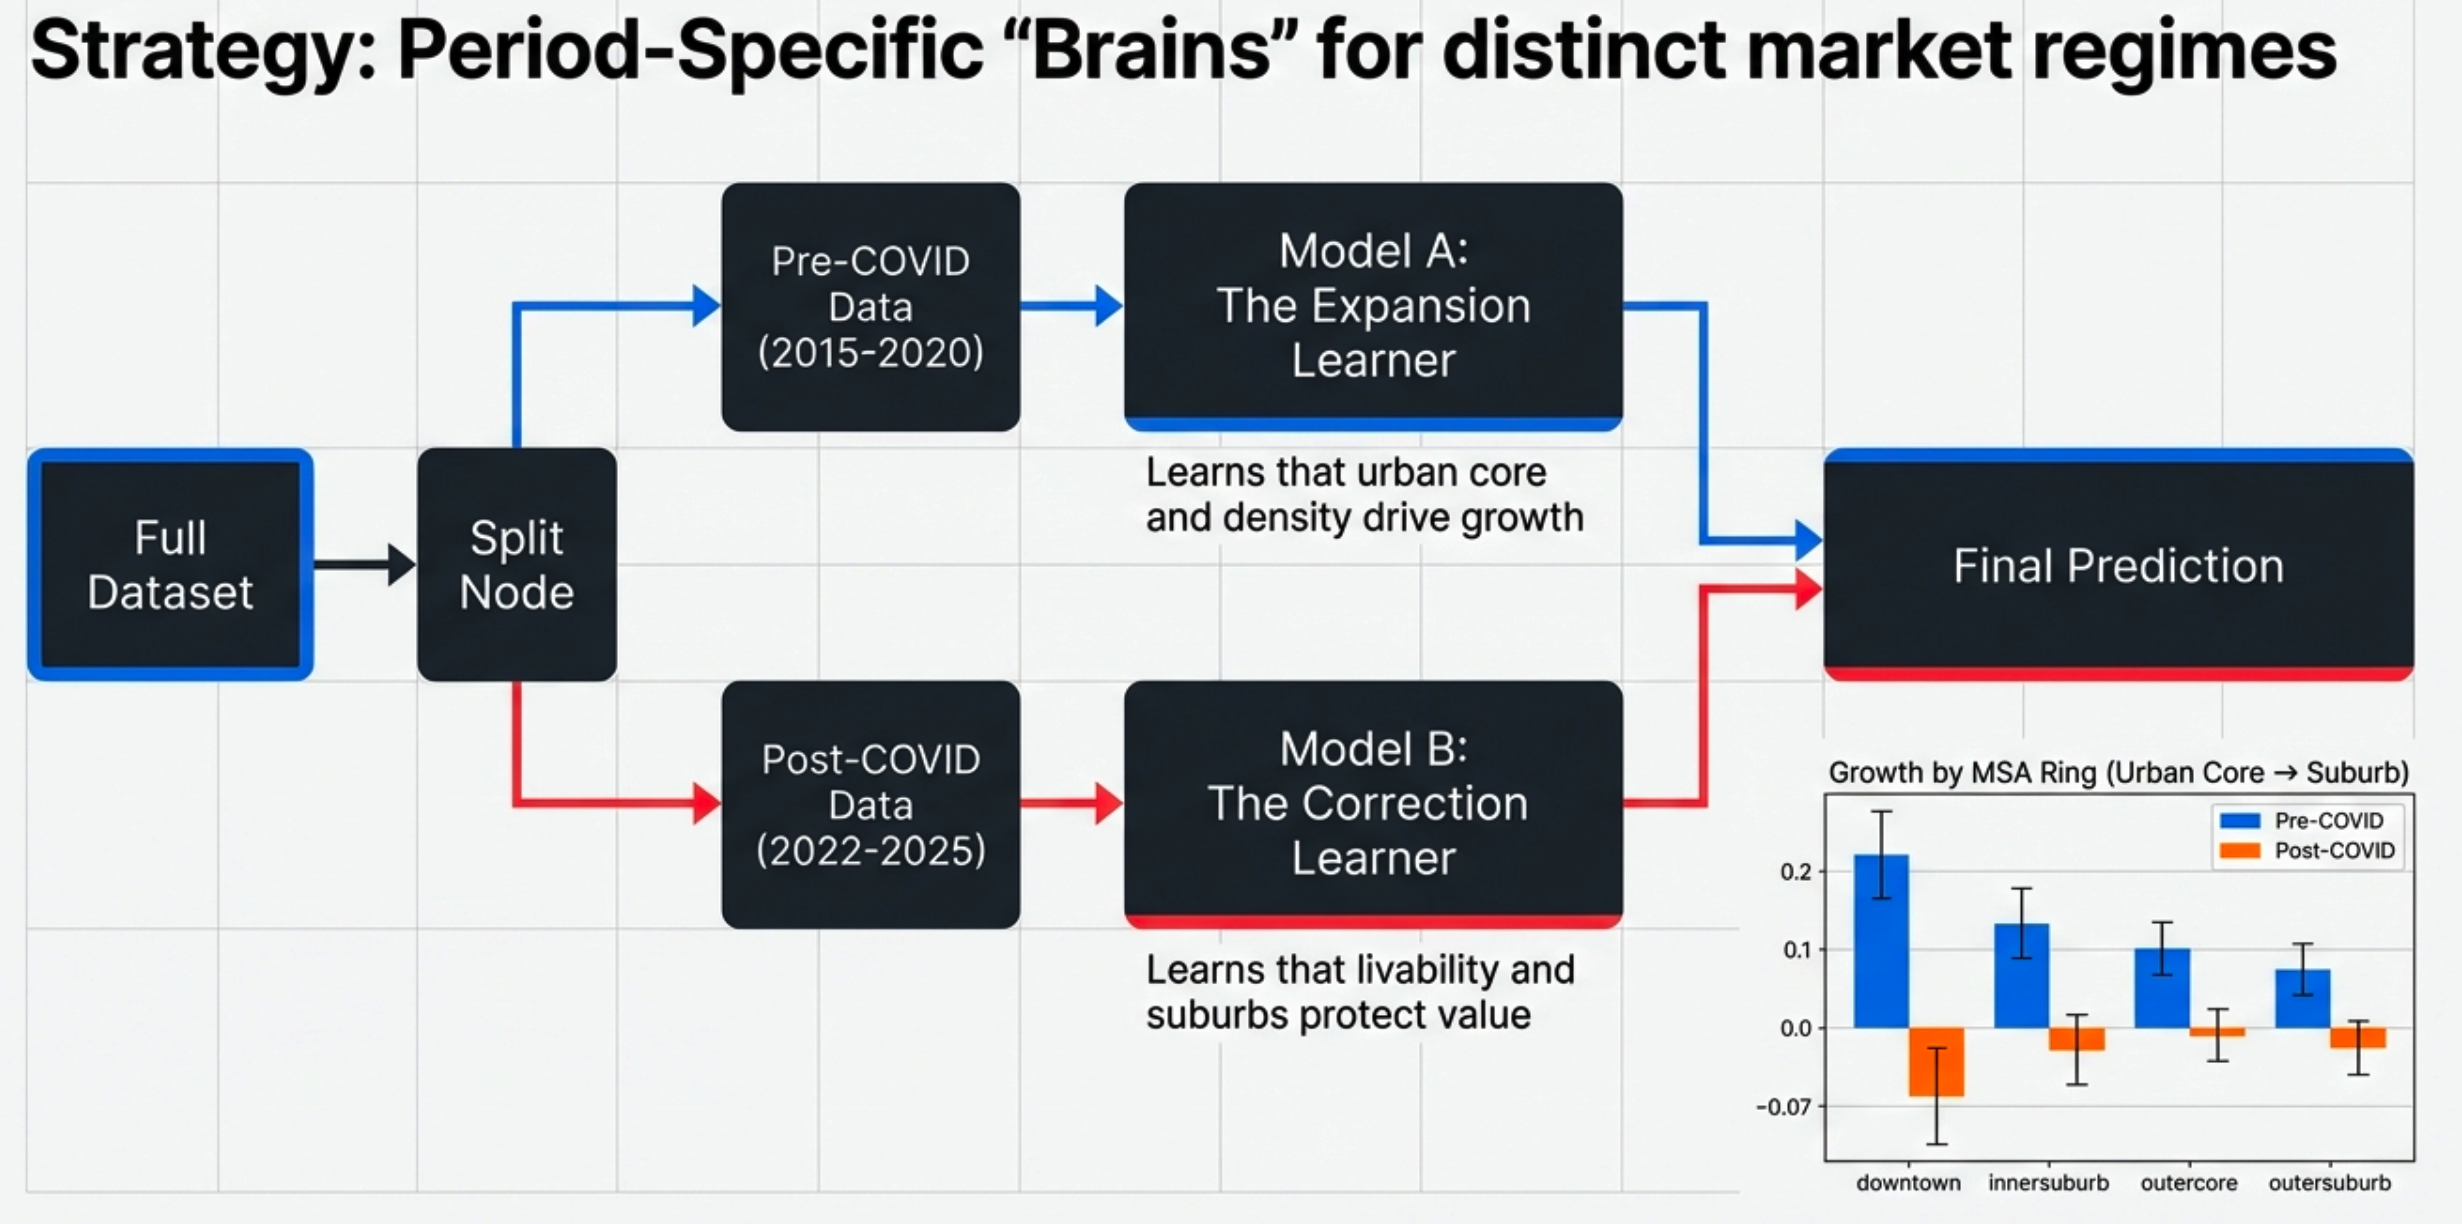
Learning from both eras separately — We train distinct XGBoost models for pre-COVID and post-COVID periods, recognizing that renter preferences fundamentally shifted.
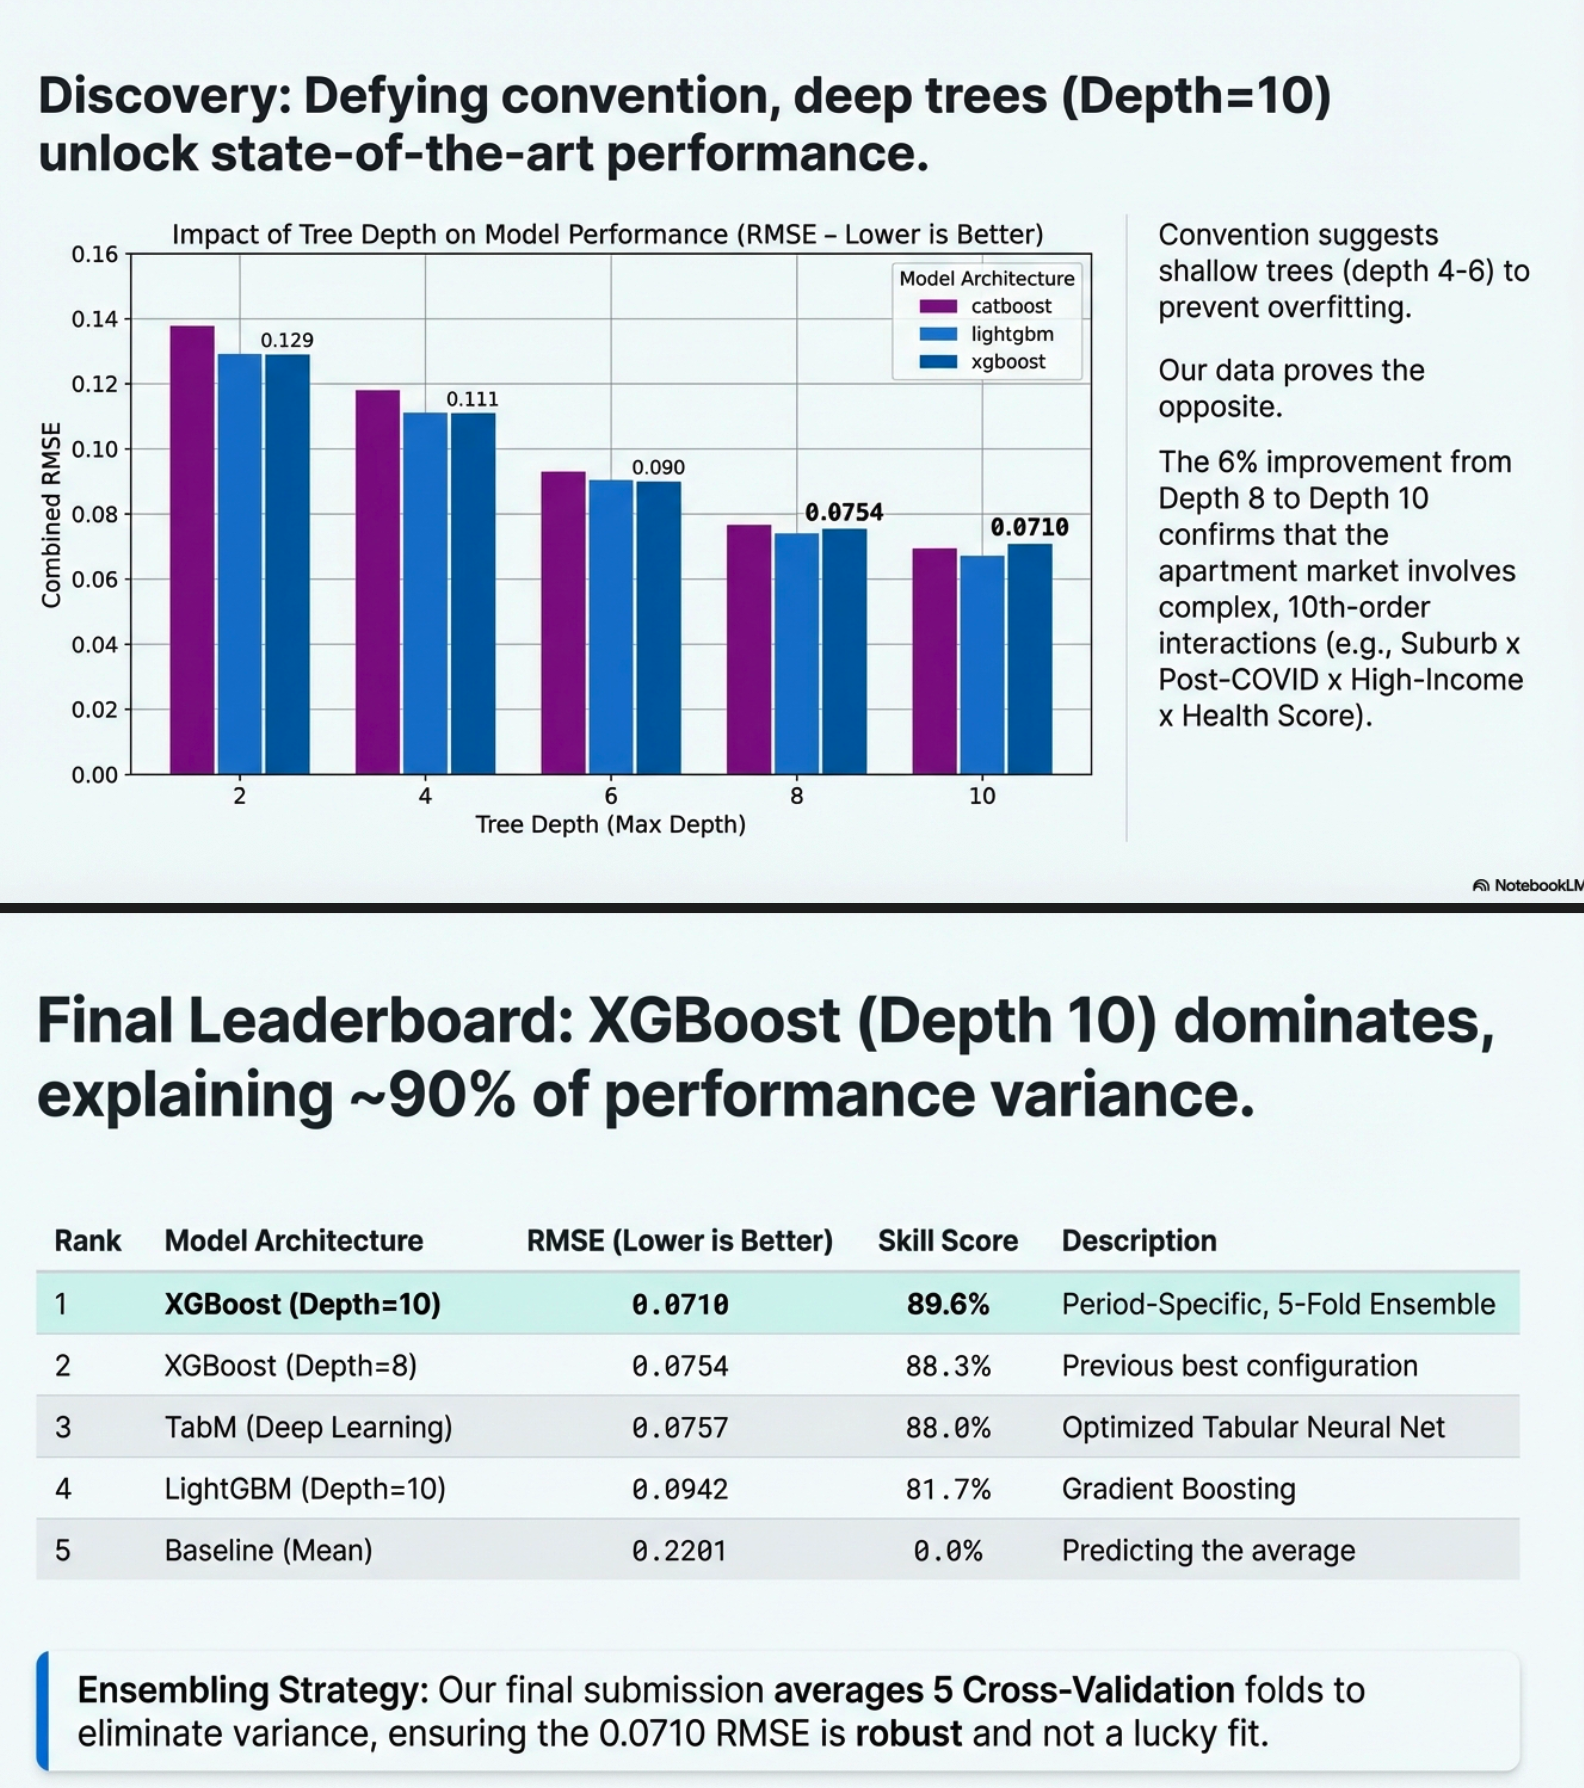
Discovering optimal model depth — Through systematic experimentation, we found that tree depth=10 (far beyond conventional 4-6) captures the complex, high-order interactions in neighborhood data.
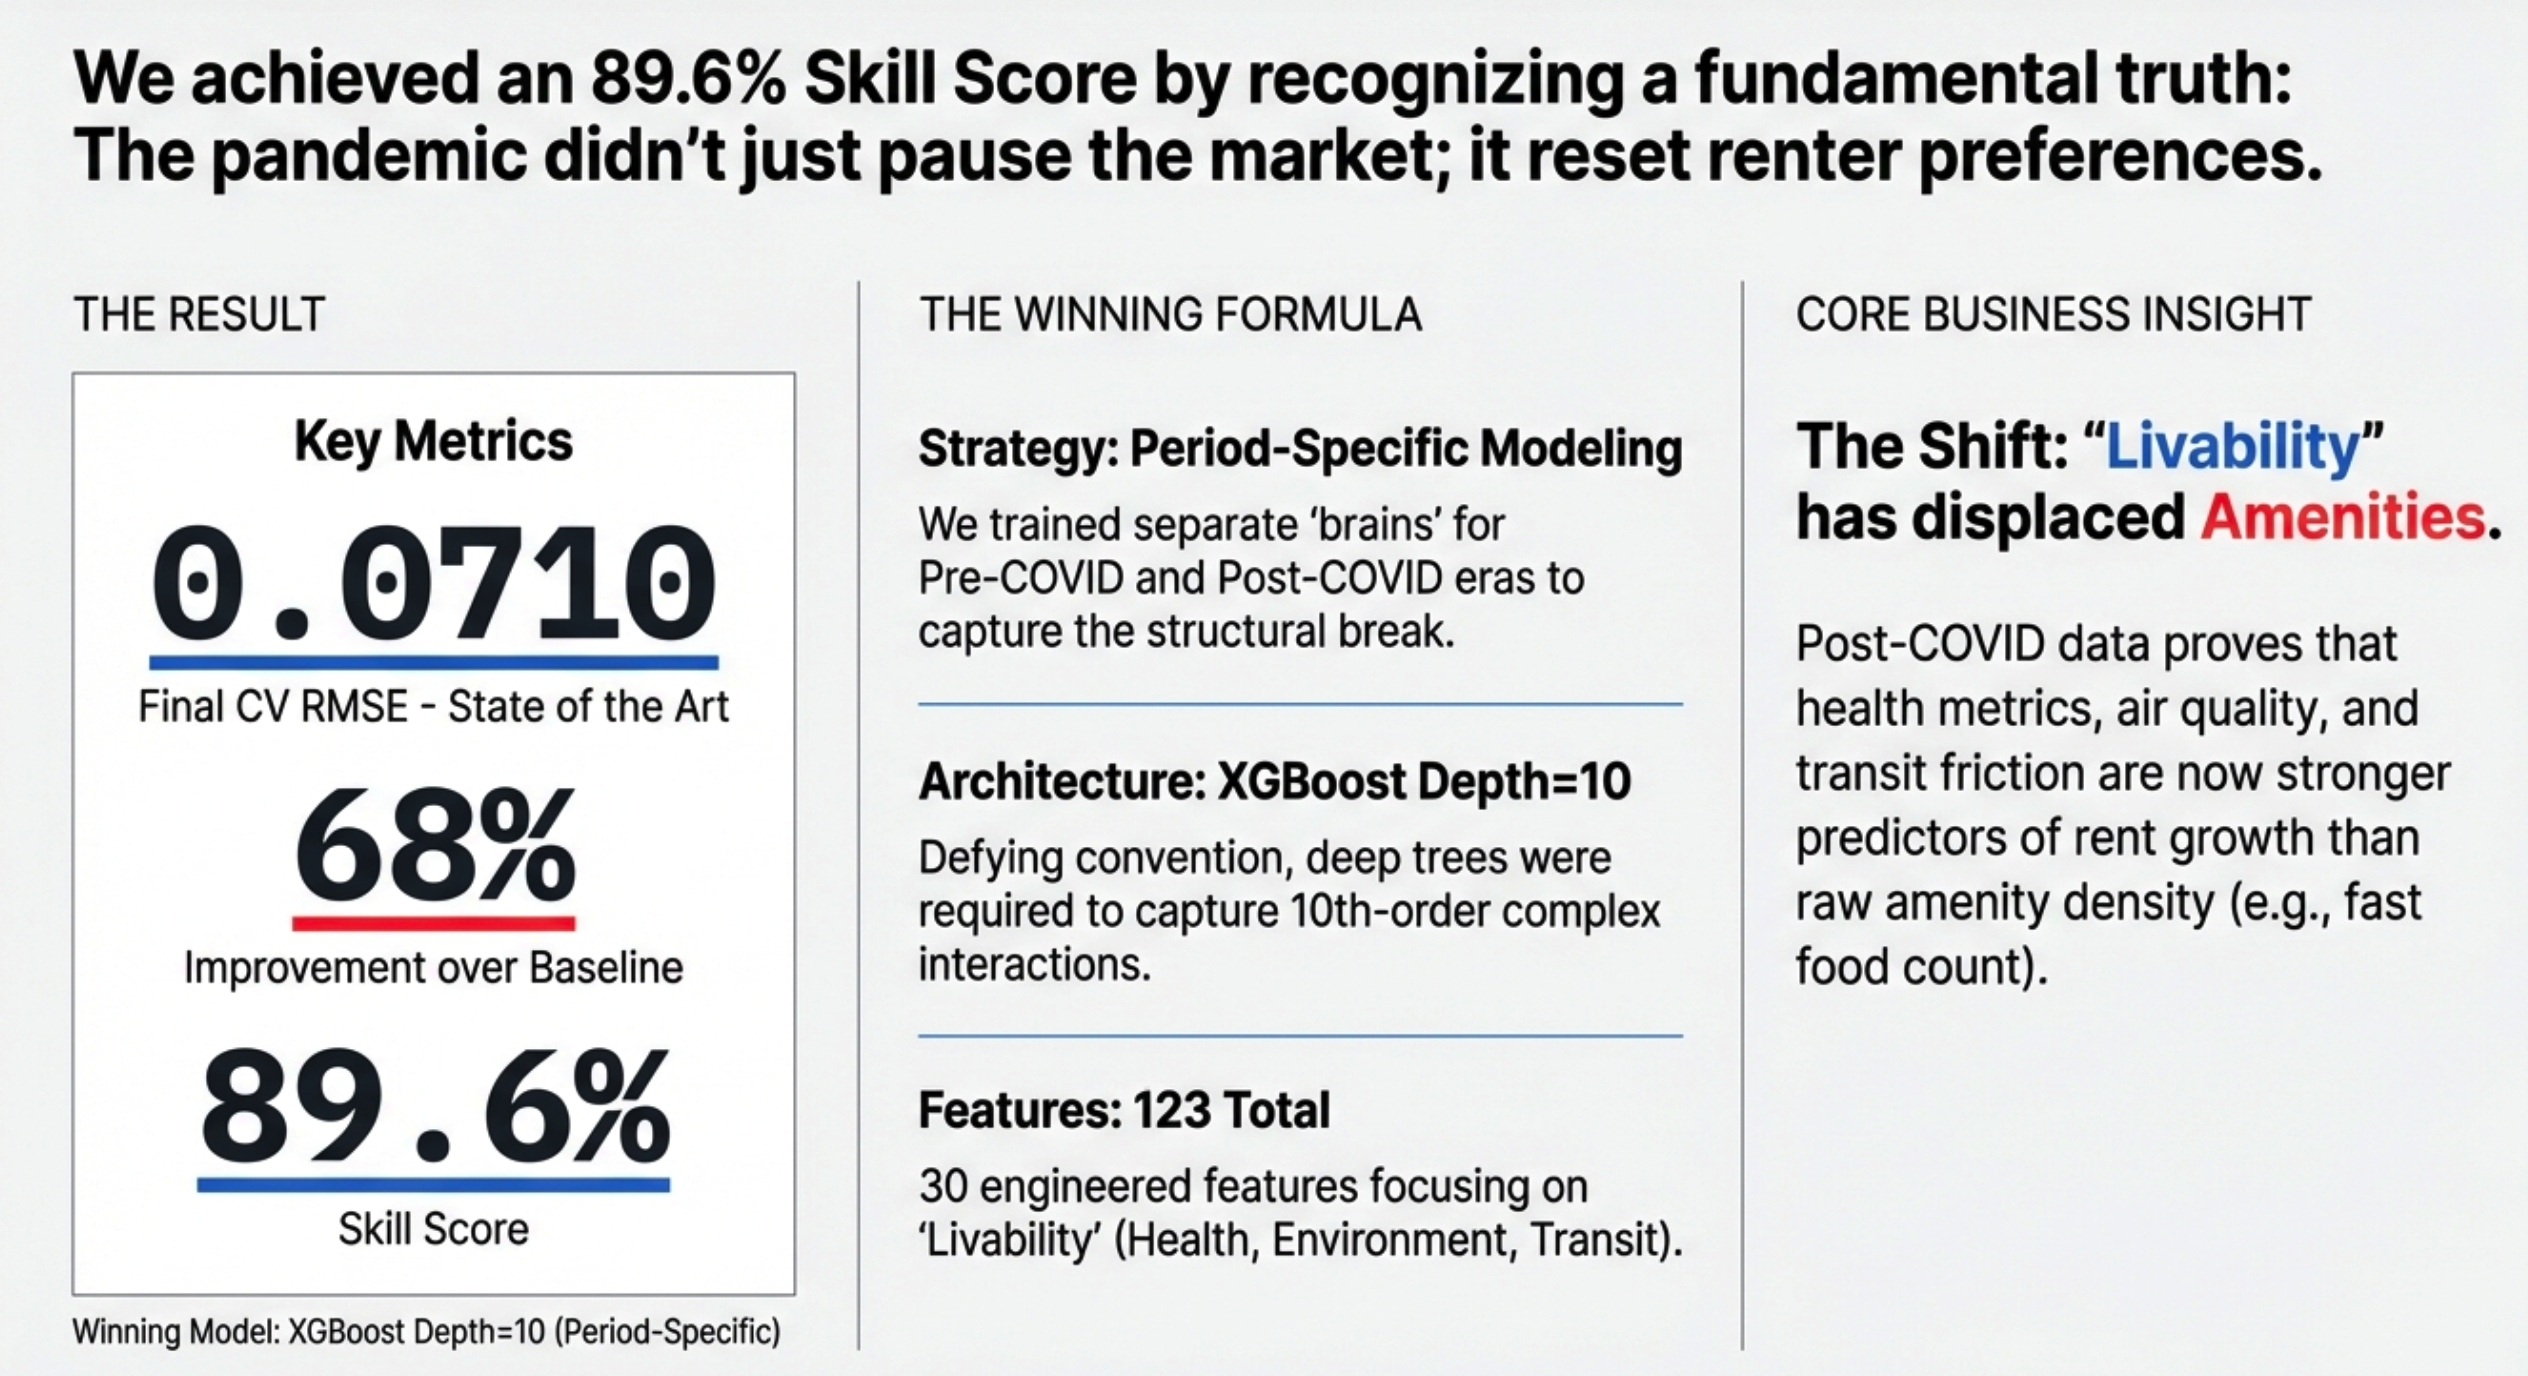
Identifying what matters now — SHAP analysis reveals that livability metrics (health access, air quality, transit flexibility) now predict performance better than traditional location factors.
The model achieves 0.0710 RMSE (89.6% skill score), a 68% improvement over baseline predictions.
How we built it
Data Pipeline:
- 38,941 training observations across 7 Sun Belt states
- 123 features: property characteristics, amenities, AARP livability metrics, housing economics
- Drivetime analysis (10/15/30 minutes) capturing the "X-minute city" concept
Feature Engineering:
- 30 engineered features including property age polynomials, amenity ratios, AARP composite scores, and post-COVID interaction terms
- Ratio features (mortgage/rent spread, high-end food %) outperformed raw counts
Modeling Strategy:
- Period-specific architecture: separate models for pre/post COVID
- 5-fold cross-validation with ensemble averaging (10 models total)
- Systematic depth tuning across XGBoost, LightGBM, and CatBoost
- Compared against foundation models (TabPFN, TabM)
Tech Stack:
- Python, pandas, scikit-learn
- XGBoost, LightGBM, CatBoost, TabM
- SHAP for interpretability
- Matplotlib/Seaborn for visualization
Challenges we ran into
1. The Quartile Reshuffling Problem Early unified models performed poorly because they tried to learn contradictory patterns. Properties that succeeded pre-COVID (dense urban cores) often failed post-COVID (suburban health-rich areas). The solution was architectural: split the timeline.
2. Depth Sensitivity Conventional wisdom suggests shallow trees (depth 4-6) to avoid overfitting. Our experiments showed monotonic improvement up to depth=10, revealing that this problem requires capturing 10th-order feature interactions. Trusting the data over convention was key.
3. Interpretability vs Performance Balancing model complexity with explainability. SHAP analysis helped us communicate why the model works, not just that it works—critical for real-world adoption.
Accomplishments that we're proud of
- State-of-the-art performance: 0.0710 RMSE, 68% better than baseline
- Rigorous experimentation: 40+ training runs, systematic depth analysis, multiple model architectures
- Actionable insights: Discovered that post-COVID renters prioritize health/transit over downtown proximity—a finding with real investment implications
- Robust methodology: CV ensemble eliminates variance, period-specific design captures structural breaks
What we learned
Technical:
- Period-specific modeling is a powerful pattern for problems with regime changes
- Depth tuning can yield surprising results—don't blindly follow conventional hyperparameter ranges
- Livability indices (AARP) contain rich signal often overlooked in real estate modeling
Domain:
- The "15-minute city" concept means something fundamentally different post-COVID
- Renter preferences shifted from convenience to quality of life
- Structural breaks require architectural solutions, not just better features
What's next
Short-term:
- Extend to other metro areas (Midwest, Northeast) to test generalizability
- Incorporate time-series features (momentum, seasonality) for dynamic predictions
- Build interactive dashboard for property-level predictions
Long-term:
- Real-time preference tracking: detect emerging shifts before they become structural breaks
- Multi-asset class expansion: apply period-specific framework to office, retail, industrial
- Causal inference: move from "what predicts" to "what causes" performance differences
Built With
- python
- xgboost
- lightgbm
- catboost
- scikit-learn
- pandas
- numpy
- shap
- matplotlib
- seaborn


Log in or sign up for Devpost to join the conversation.