Inspiration Data is the lifeblood of modern decision-making, yet most business teams and domain leaders face a persistent bottleneck: the analytics divide.
To extract meaningful answers from business datasets, teams typically face two painful options:
The BI Backlog: Submitting tickets to data engineering teams and waiting days for static dashboards in tools like Tableau or PowerBI. Naive LLM Chatbots: Pasting data into generic chat models, which frequently hallucinate mathematical calculations, suffer from single-turn context amnesia, and pose major security liabilities when executing arbitrary code. We asked ourselves: What if an AI system could act like a Senior Principal Data Analyst—conversational and intuitive, yet grounded in deterministic mathematics, strictly sandboxed for safety, and capable of producing formal executive dossiers without human query bias?
This vision inspired Graph Analytics: an enterprise-grade, stateful conversational analytics platform that pairs the multi-agent reasoning of LangGraph and Google Gemini with the deterministic precision of Pandas, an AST-isolated execution sandbox, and ReportLab PDF generation.
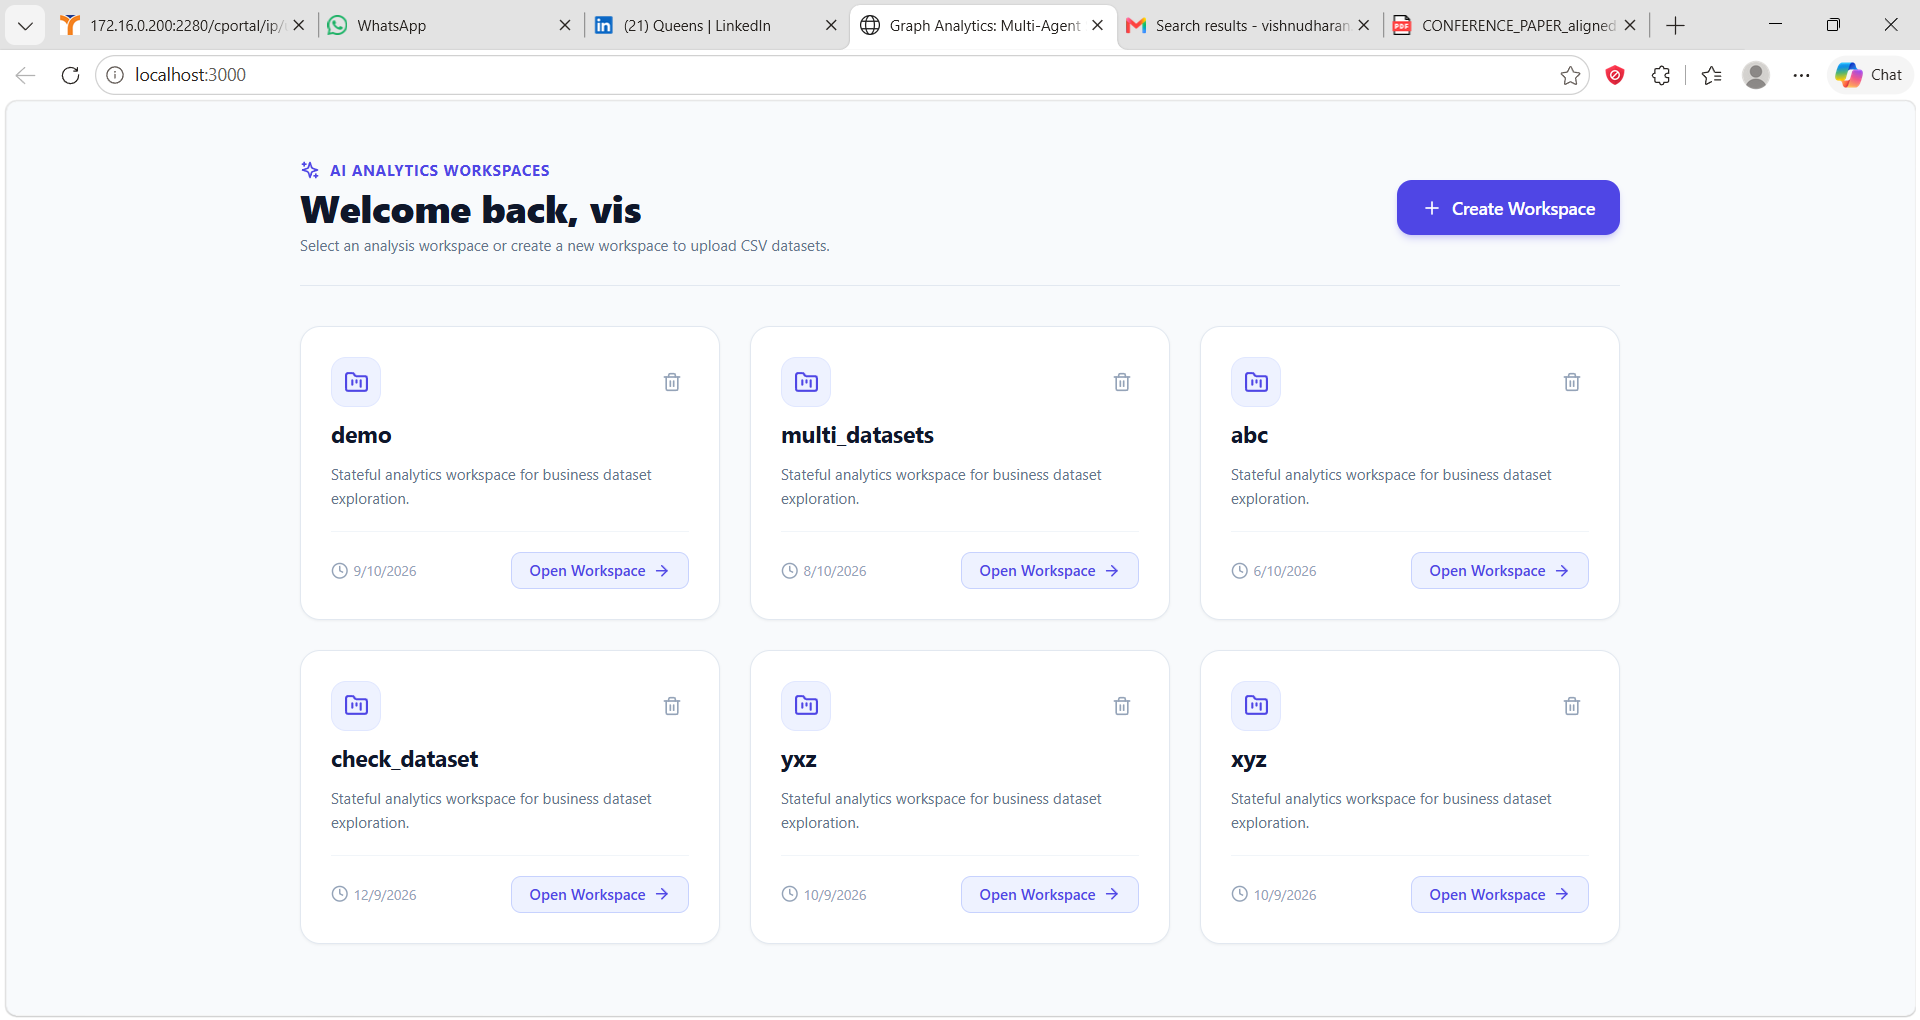
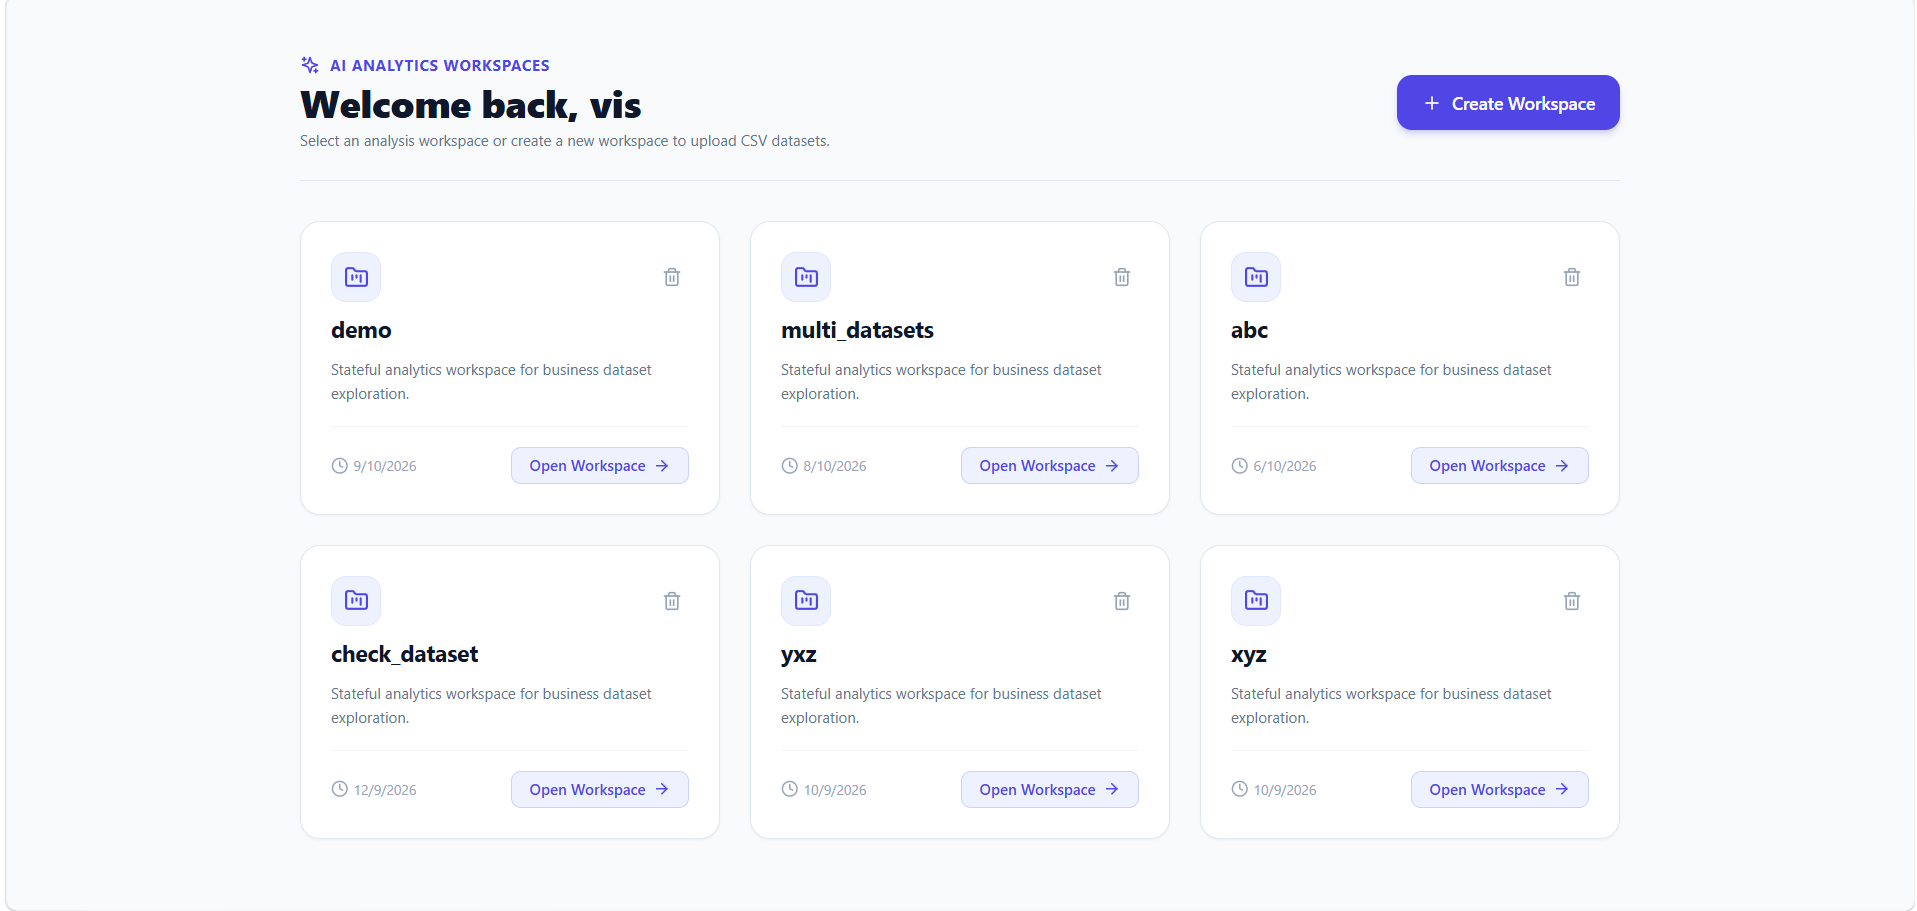
What it does Graph Analytics transforms raw tabular datasets into interactive business intelligence through three core pillars:
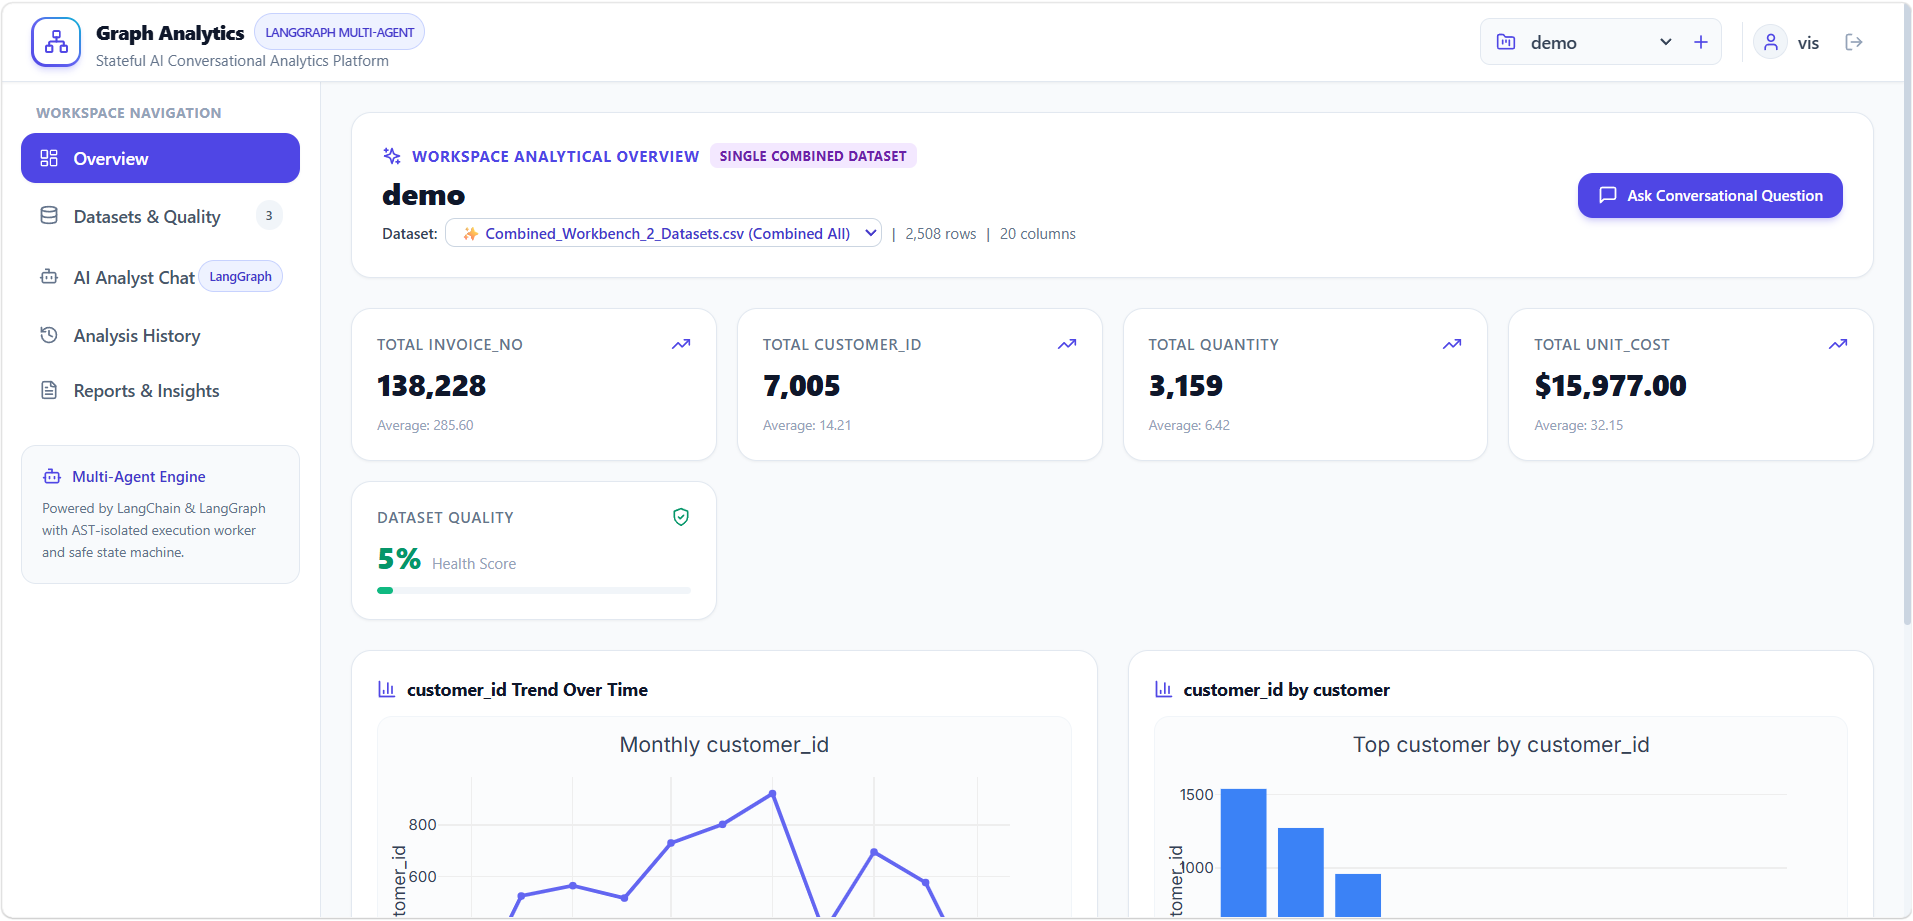
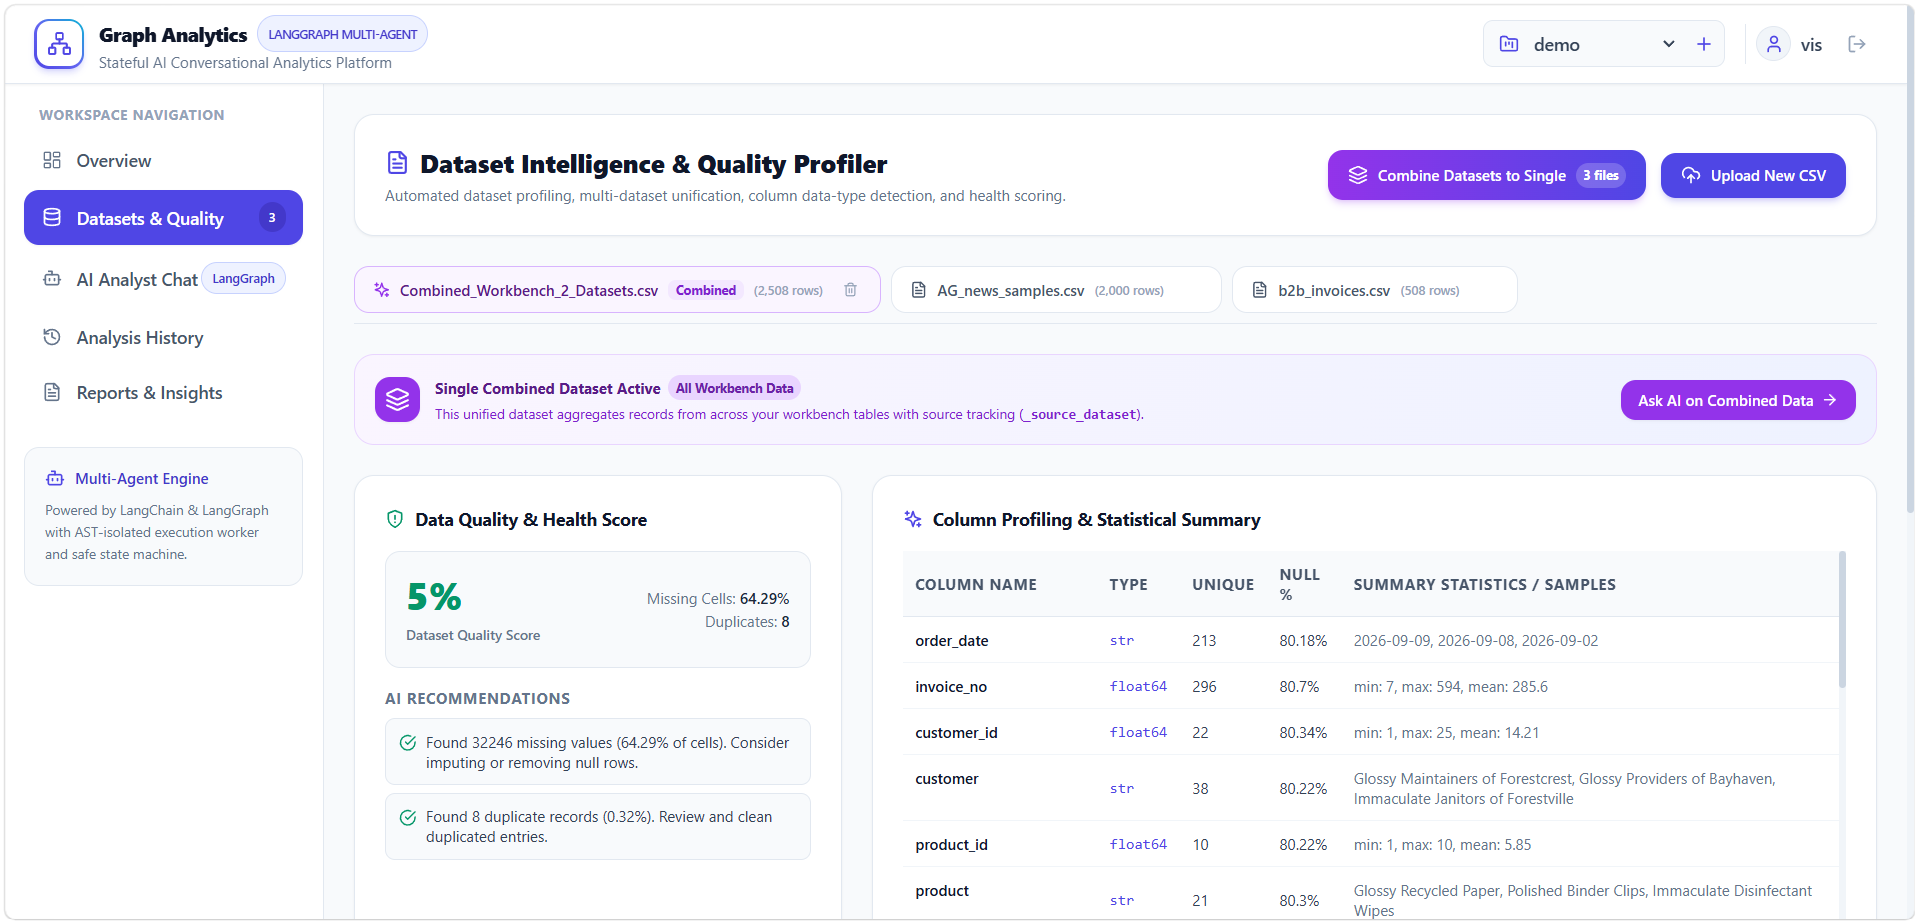
- Automated Dataset Profiling & Health Scoring Upon uploading any CSV file, the platform profiles the data in milliseconds. It computes schema taxonomies, missing cell distributions, and duplicate records to derive a composite Data Quality Health Score:
$$\text{Quality Score} = \max\left(5.0,, 100 - \left(1.5 \times \text{Missing%} + 2.0 \times \text{Duplicate%}\right)\right)$$
It immediately generates an initial interactive Plotly dashboard showcasing primary KPIs, distributions, and trends.
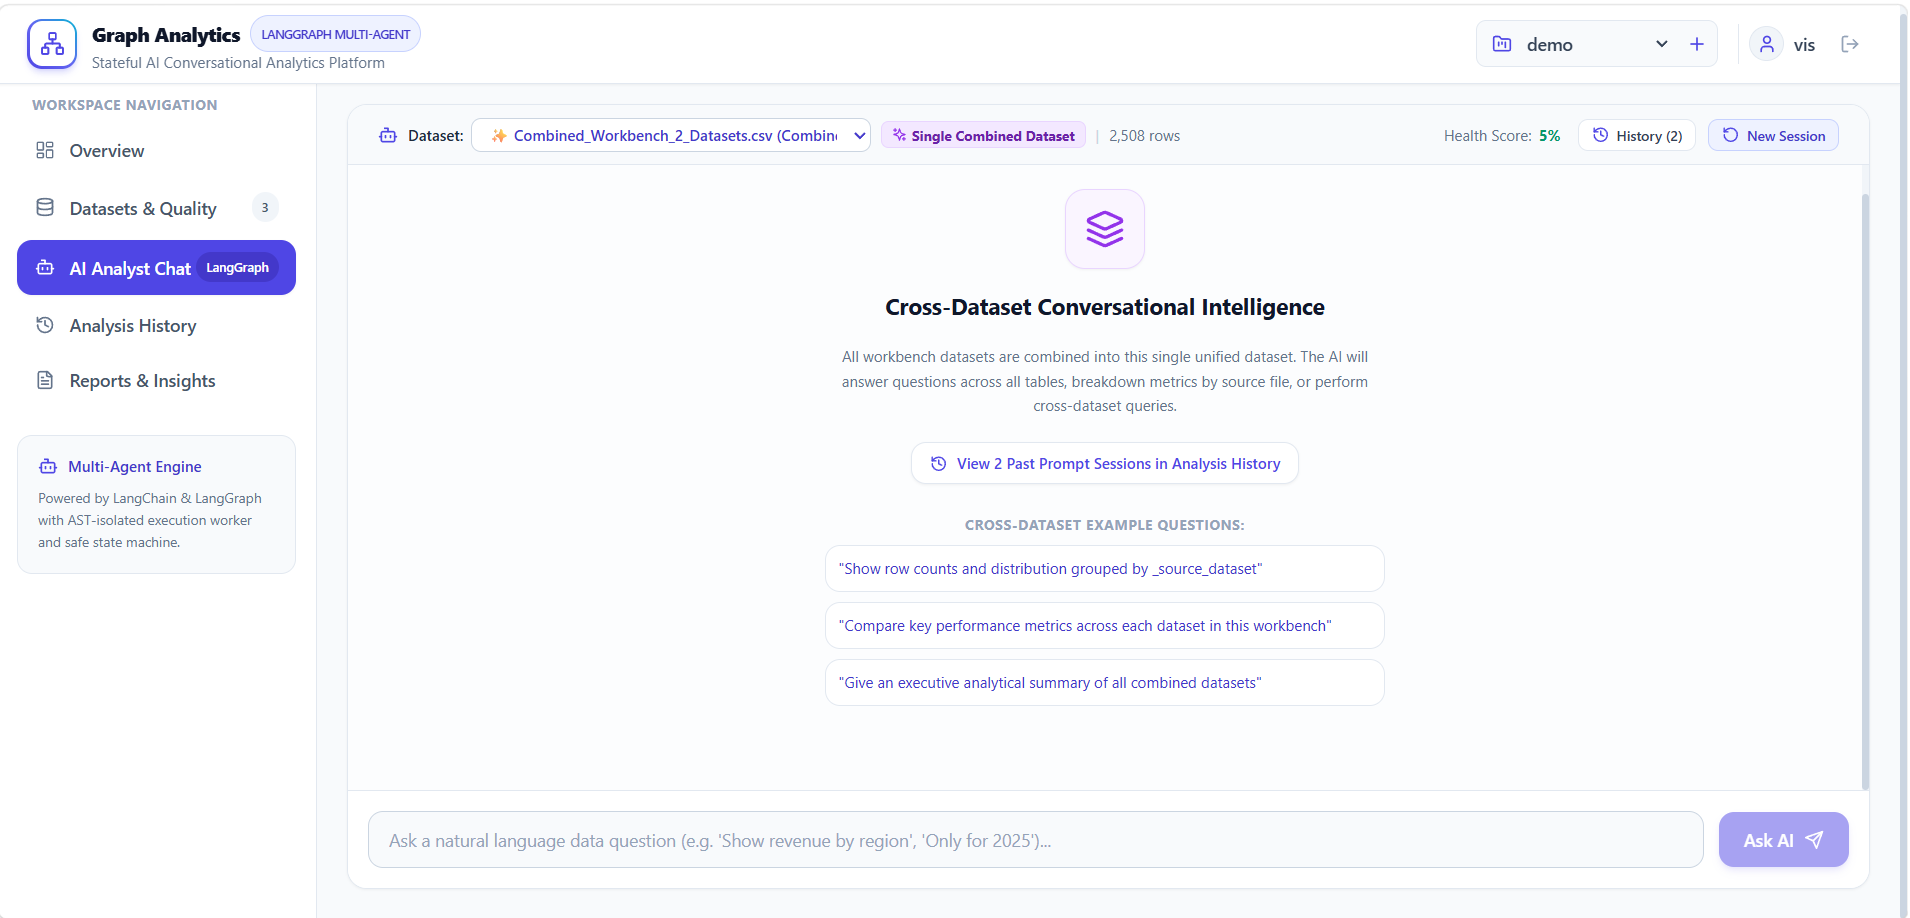
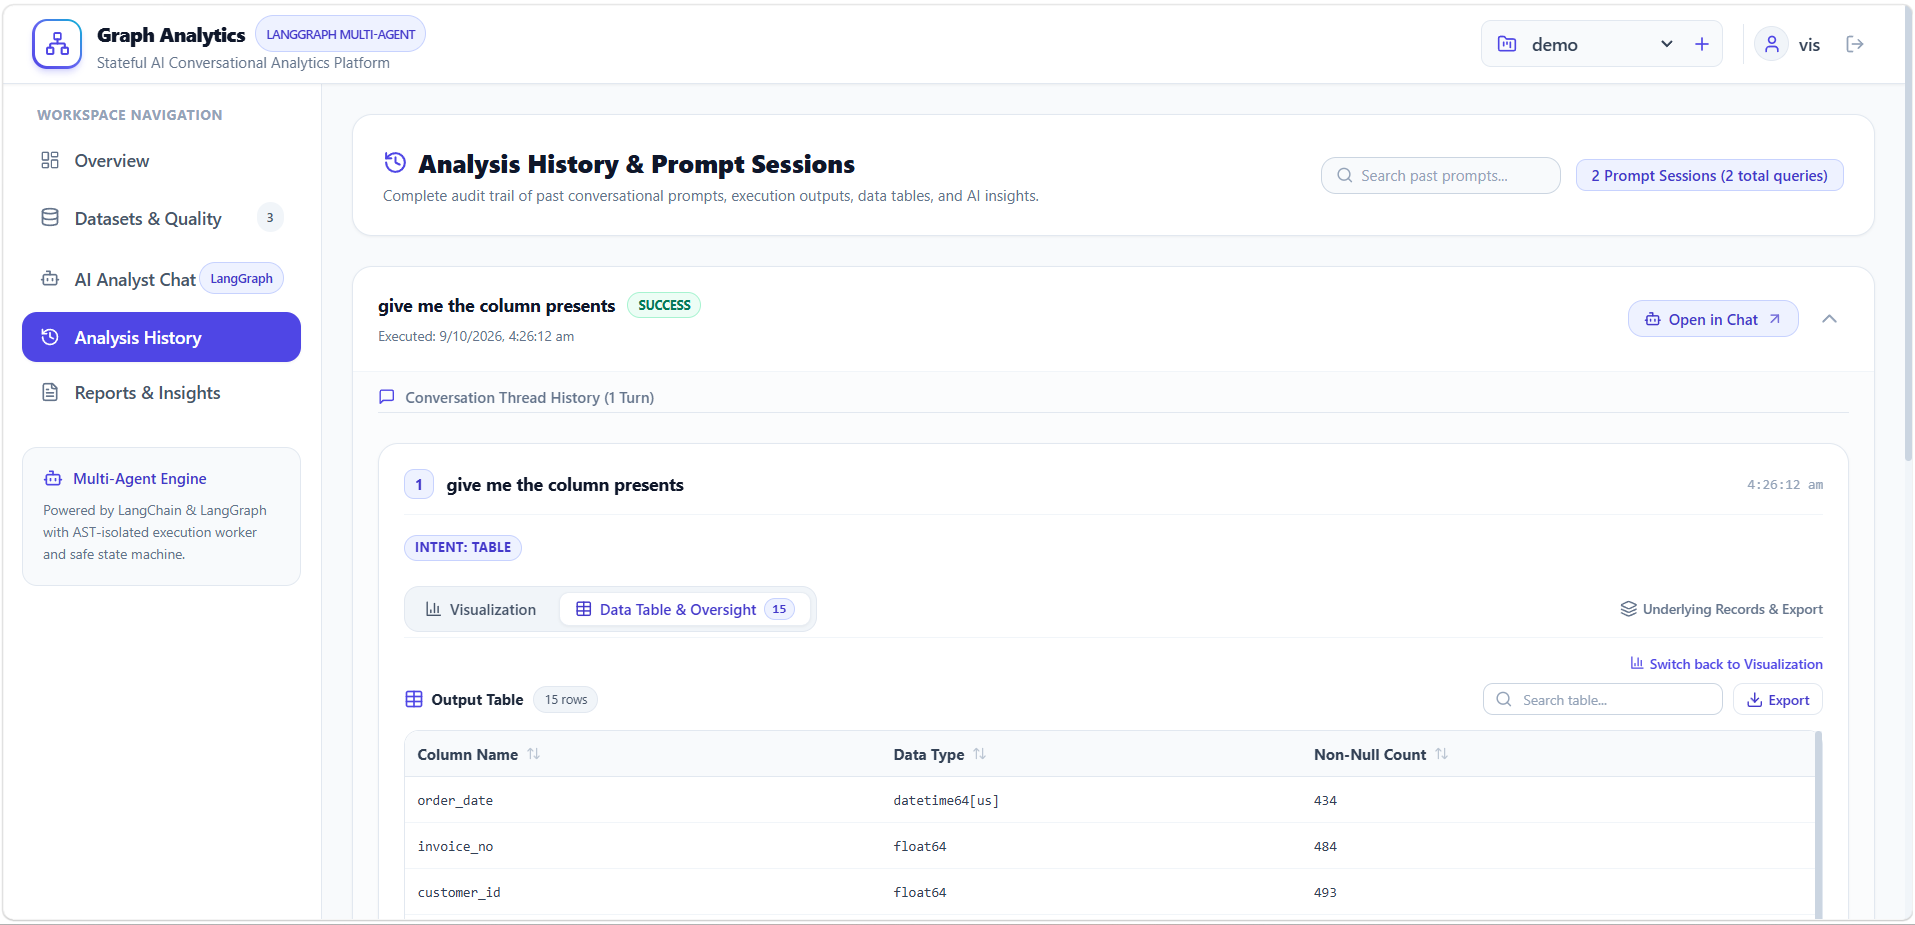
- Multi-Agent Stateful Conversational Analytics Users can interrogate their data using natural language ("What is our revenue by region?" $\rightarrow$ "Filter that to Enterprise customers only" $\rightarrow$ "Compare profit margins between 2024 and 2025").
Context Retention: Preserves active filters, selected dimensions, and analytical state across turns. AST-Validated Sandbox Execution: Generates Python Pandas code that is statically inspected against dangerous system calls (os, sys, subprocess, socket operations, and file I/O) before executing in an isolated subprocess sandbox. Interactive Visualizations & Findings: Returns interactive Plotly charts, data tables, key business takeaways, and follow-up query suggestions.
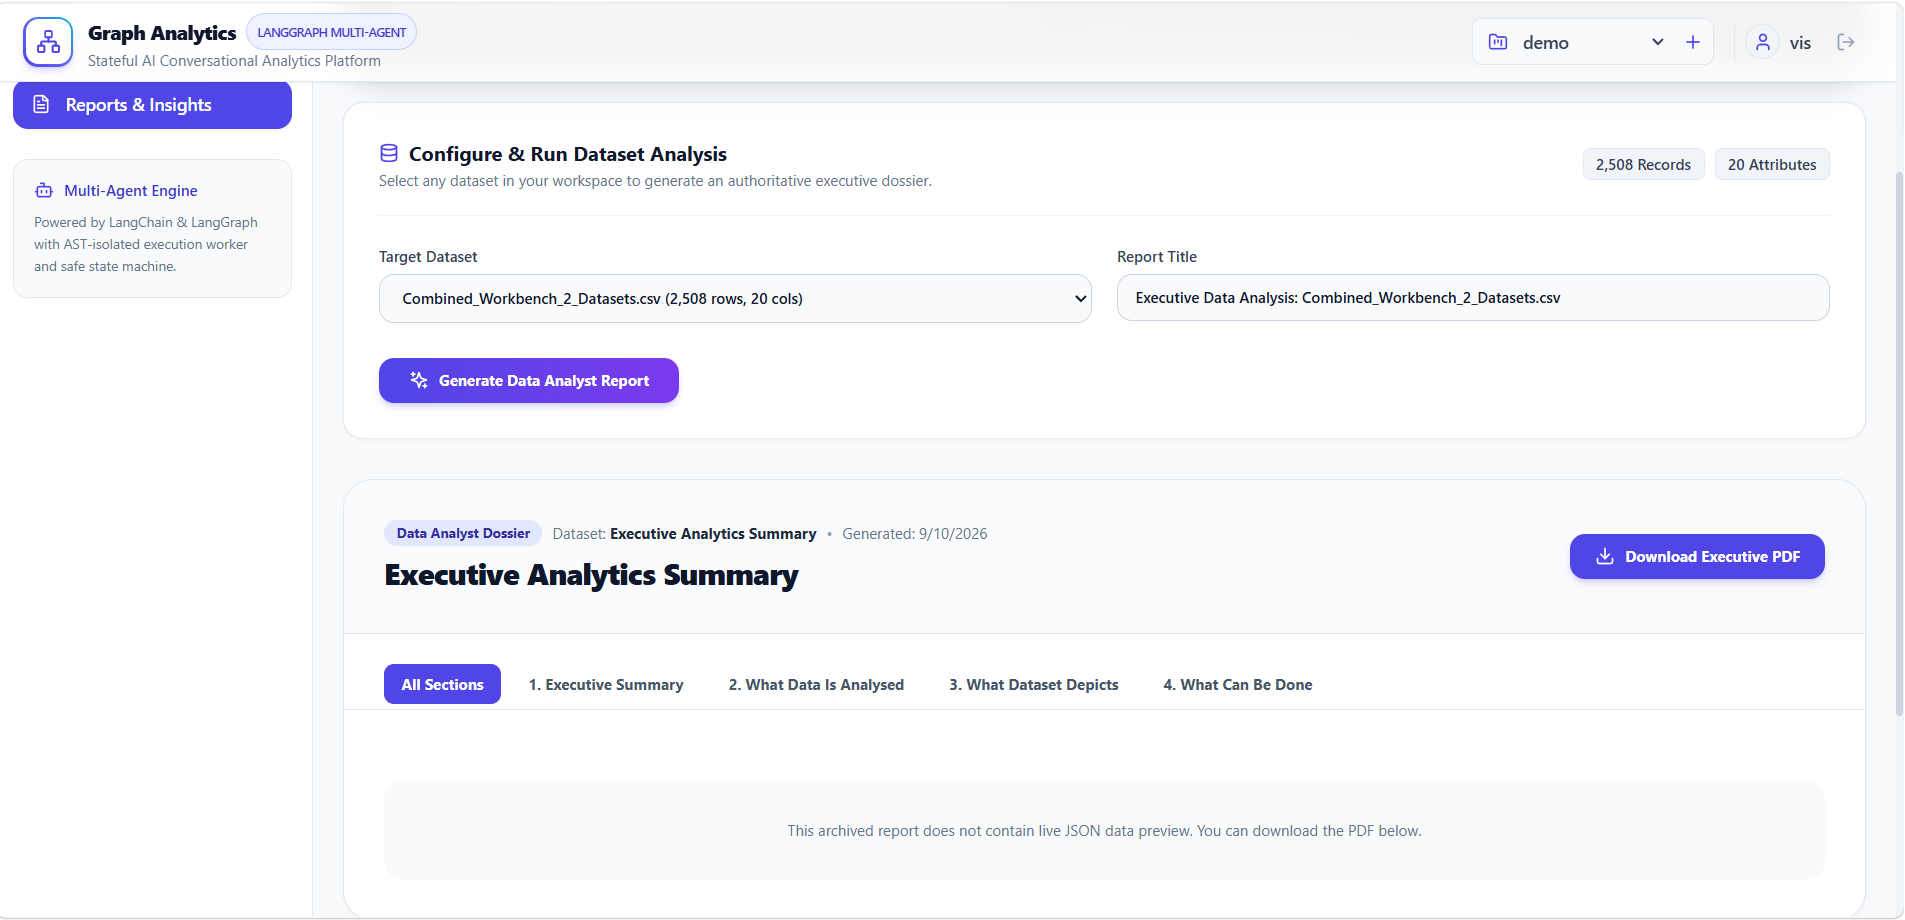
- Autonomous Data Analyst Executive Report Generator Rather than regurgitating chat transcripts, the report builder acts as an autonomous data analyst examining any dataset in the workspace:
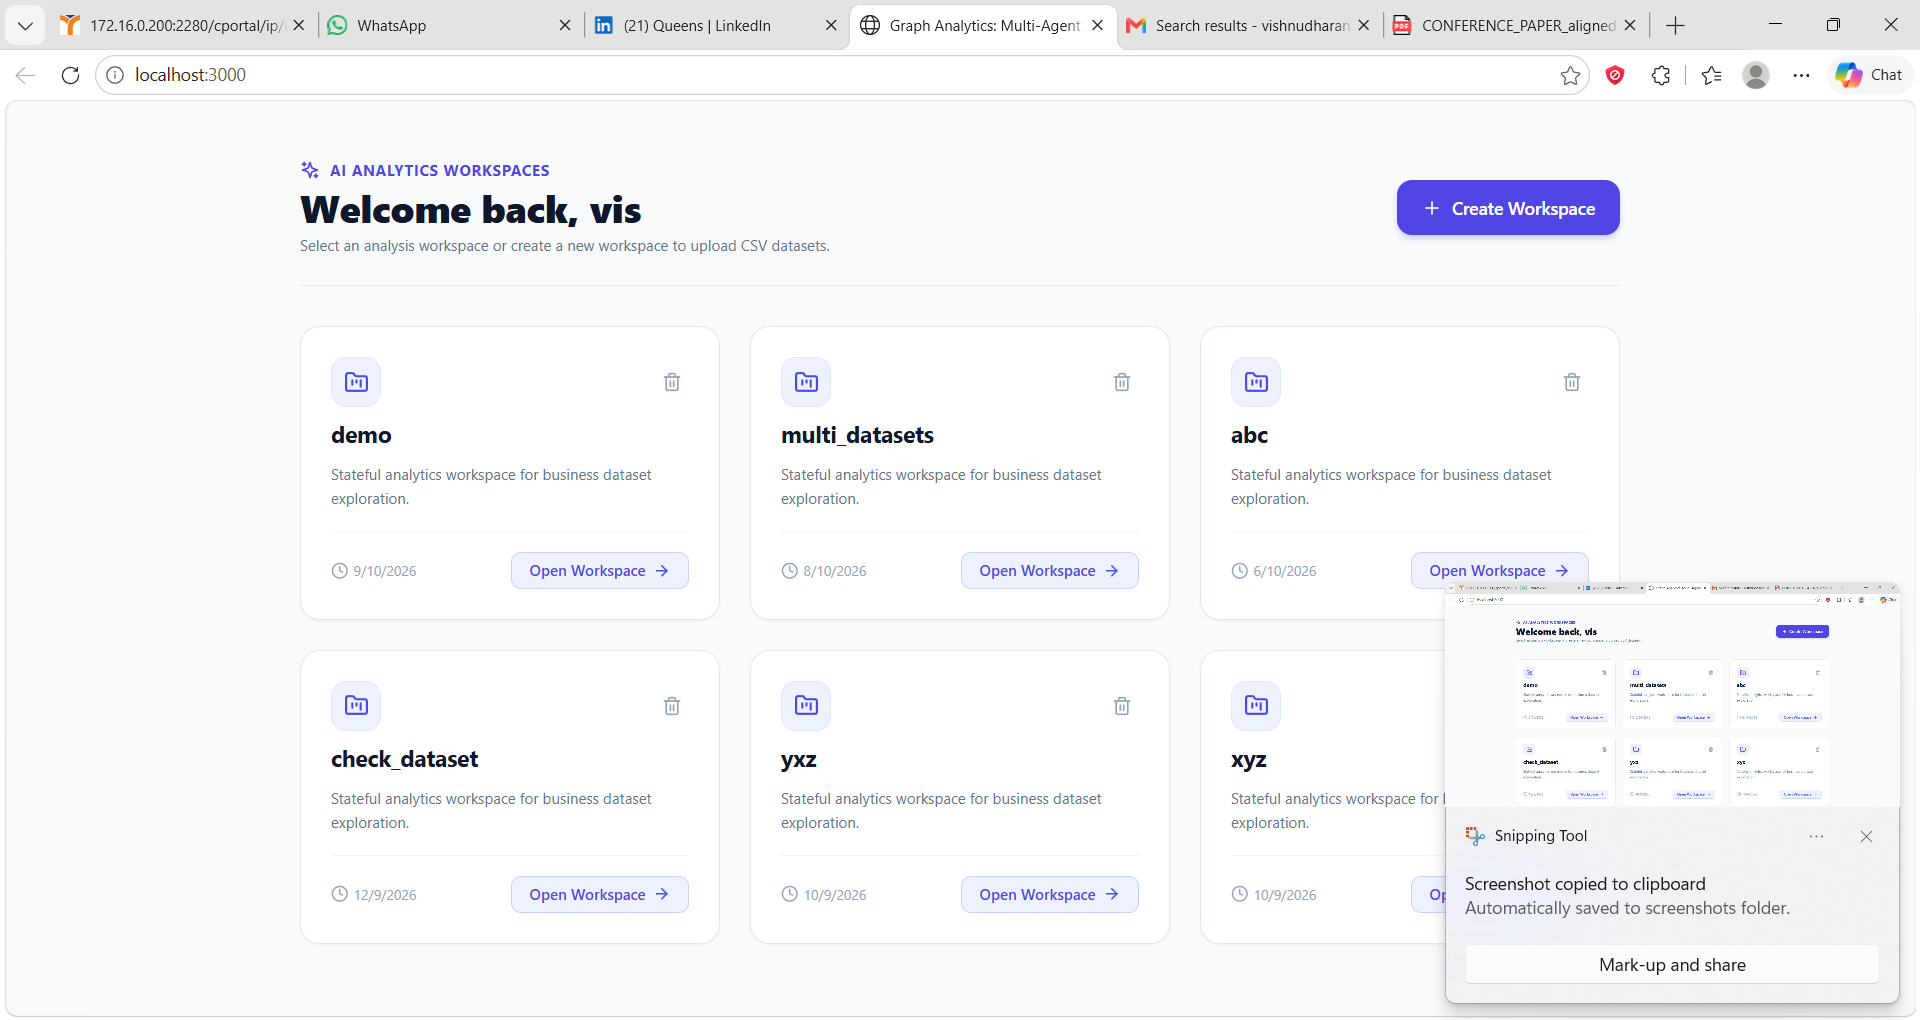
Executive Summary & Scope: High-level domain overview, record scale, and observation window. Summary of What Data Is Analysed: Quantitative metric tables (Total Sum, Mean, Min, Max, and $\sigma$ Standard Deviation), categorical dimension shares, and a data hygiene audit. What Is Currently This Dataset Depicting Generally: Operational baseline state, volume concentrations (Pareto $80/20$ skews), dominant segments, and risk/outlier notes. What Can Be Done: Prescriptive strategic levers, advanced machine learning roadmaps (time-series forecasting, clustering segmentation), and feature enrichment advice. Executive PDF Export: 1-click programmatic PDF dossier compilation via ReportLab. How we built it Graph Analytics is built as a 4-tier decoupled full-stack architecture:
[ React 18 + Vite + Tailwind UI ] ▲ │ REST API (FastAPI + Pydantic v2) ▼ [ LangGraph Multi-Agent Engine ] ──► [ AST Security Sandbox (worker.py) ] │ │ ▼ ▼ [ Google Gemini LLM API ] [ Deterministic Pandas Execution ] │ │ └──────────────────┬───────────────────┘ ▼ [ SQLite / SQLAlchemy Persistence & ReportLab PDF ] Agent Orchestration: LangGraph coordinates an 11-node state graph: Context Loader $\rightarrow$ Query Understanding $\rightarrow$ Clarification Gate $\rightarrow$ Planner $\rightarrow$ Pandas Code Generator $\rightarrow$ AST Validator $\rightarrow$ Sandbox Executor $\rightarrow$ Self-Correction Recovery $\rightarrow$ Result Validator $\rightarrow$ Plotly Engine $\rightarrow$ Insights Agent. LLM Backbone: Google Gemini (gemini-flash-latest with candidate fallback to gemini-3.1-flash-lite) handles intent classification, query planning, and strategic synthesis. Execution & Security: Python's ast module inspects syntax trees before execution. Code runs inside an isolated worker.py subprocess with a 15-second strict timeout. Backend: FastAPI with SQLAlchemy and SQLite, handling JWT authentication, workspace multi-tenancy, and dataset profiling. Document Engine: ReportLab programmatically compiles formatted executive PDF dossiers with tables, typography, and KPI scorecards. Frontend: React 18, TypeScript, Vite, Tailwind CSS, and Plotly.js, styled in a clean, modern white theme. Challenges we ran into Deterministic Sandboxing vs. Execution Flexibility: Early LLM-generated code occasionally attempted to use Python built-ins or file writes (df.to_csv()). We solved this by writing a custom AST visitor (validator.py) that strictly permits DataFrame manipulation on df while blocking all unauthorized imports and system calls.
Self-Correction in Multi-Agent Loops: Runtime exceptions (e.g., column casing mismatches or KeyError) can stall single-shot pipelines. We introduced a Recovery Agent Node that catches stderr tracebacks and routes them back to Gemini with the exact dataset schema, achieving self-healing execution in up to 2 retry attempts.
ReportLab XML Entity Pitfalls: Financial and analytical text frequently uses mathematical comparators (Revenue > $1000 & Margin < 20%). In ReportLab's flowable parser, unescaped < and & characters cause immediate XML syntax crashes. We built strict XML-escaping filters across every dynamic table cell and paragraph flowable.
Moving Beyond "Chatbot Transcripts": Early PDF reports merely stitched together past conversational chat bubbles. Real business stakeholders do not want chat logs; they want data analyst intelligence. We redesigned the report engine from the ground up to evaluate the underlying dataset directly, deriving statistical distributions, operational trends, and prescriptive action plans.
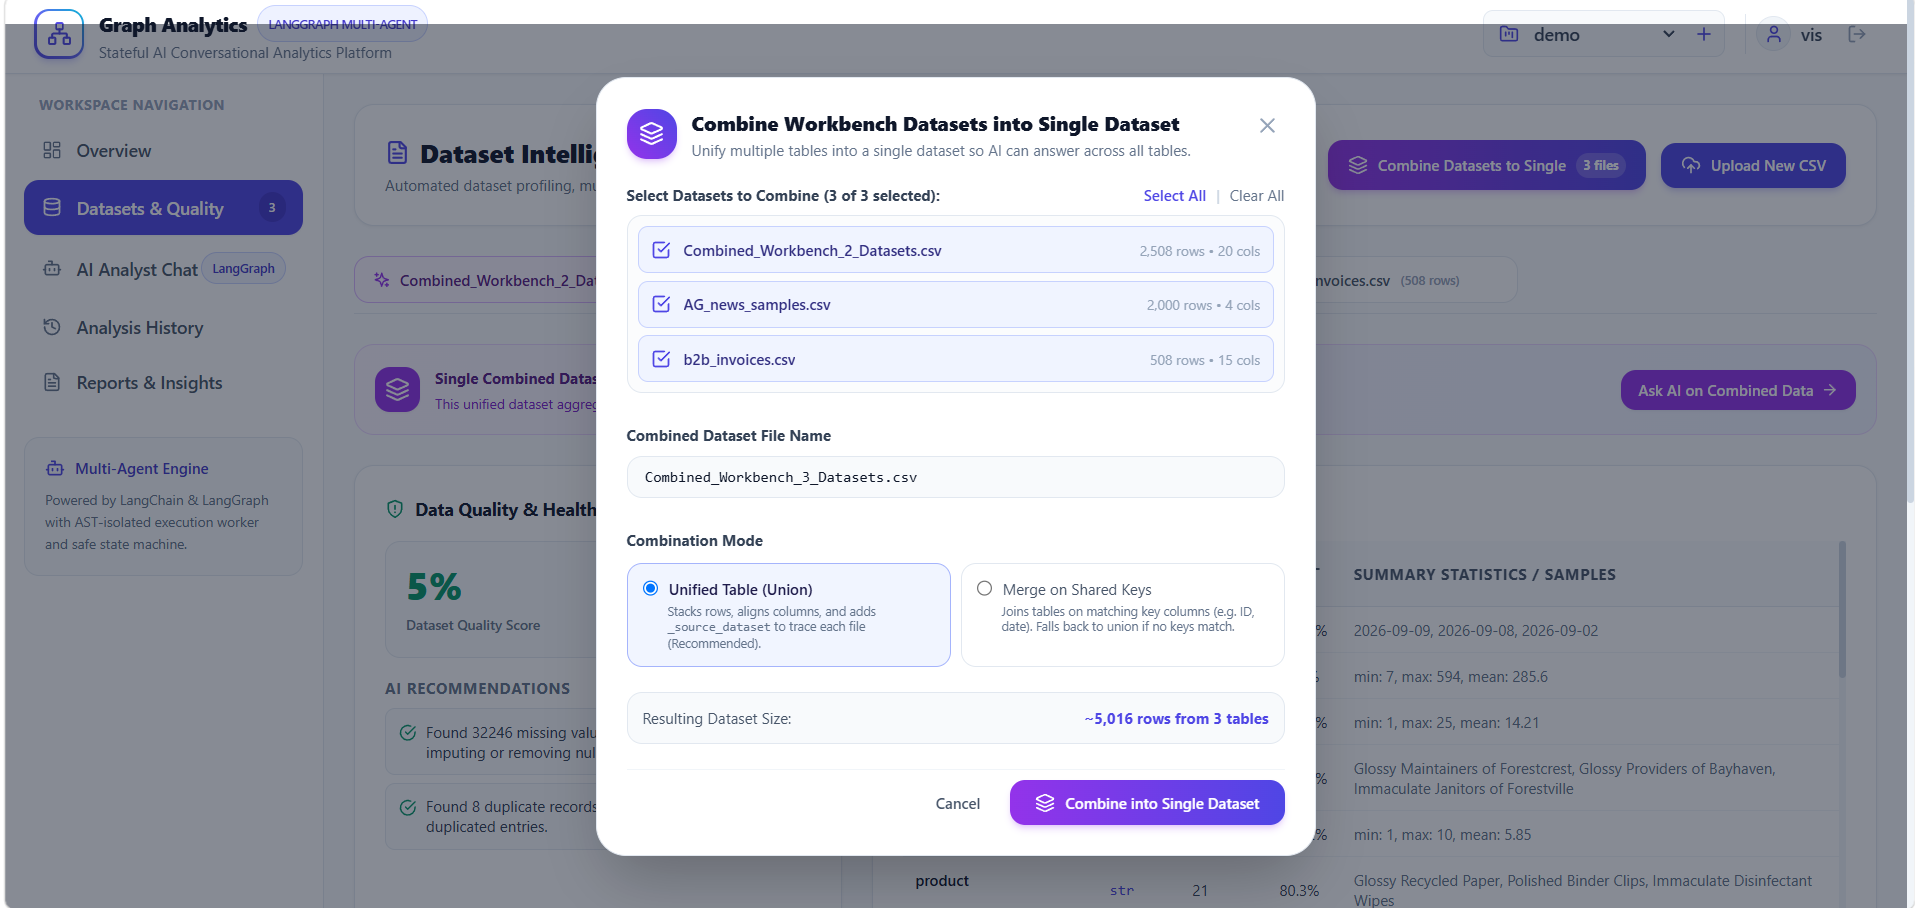
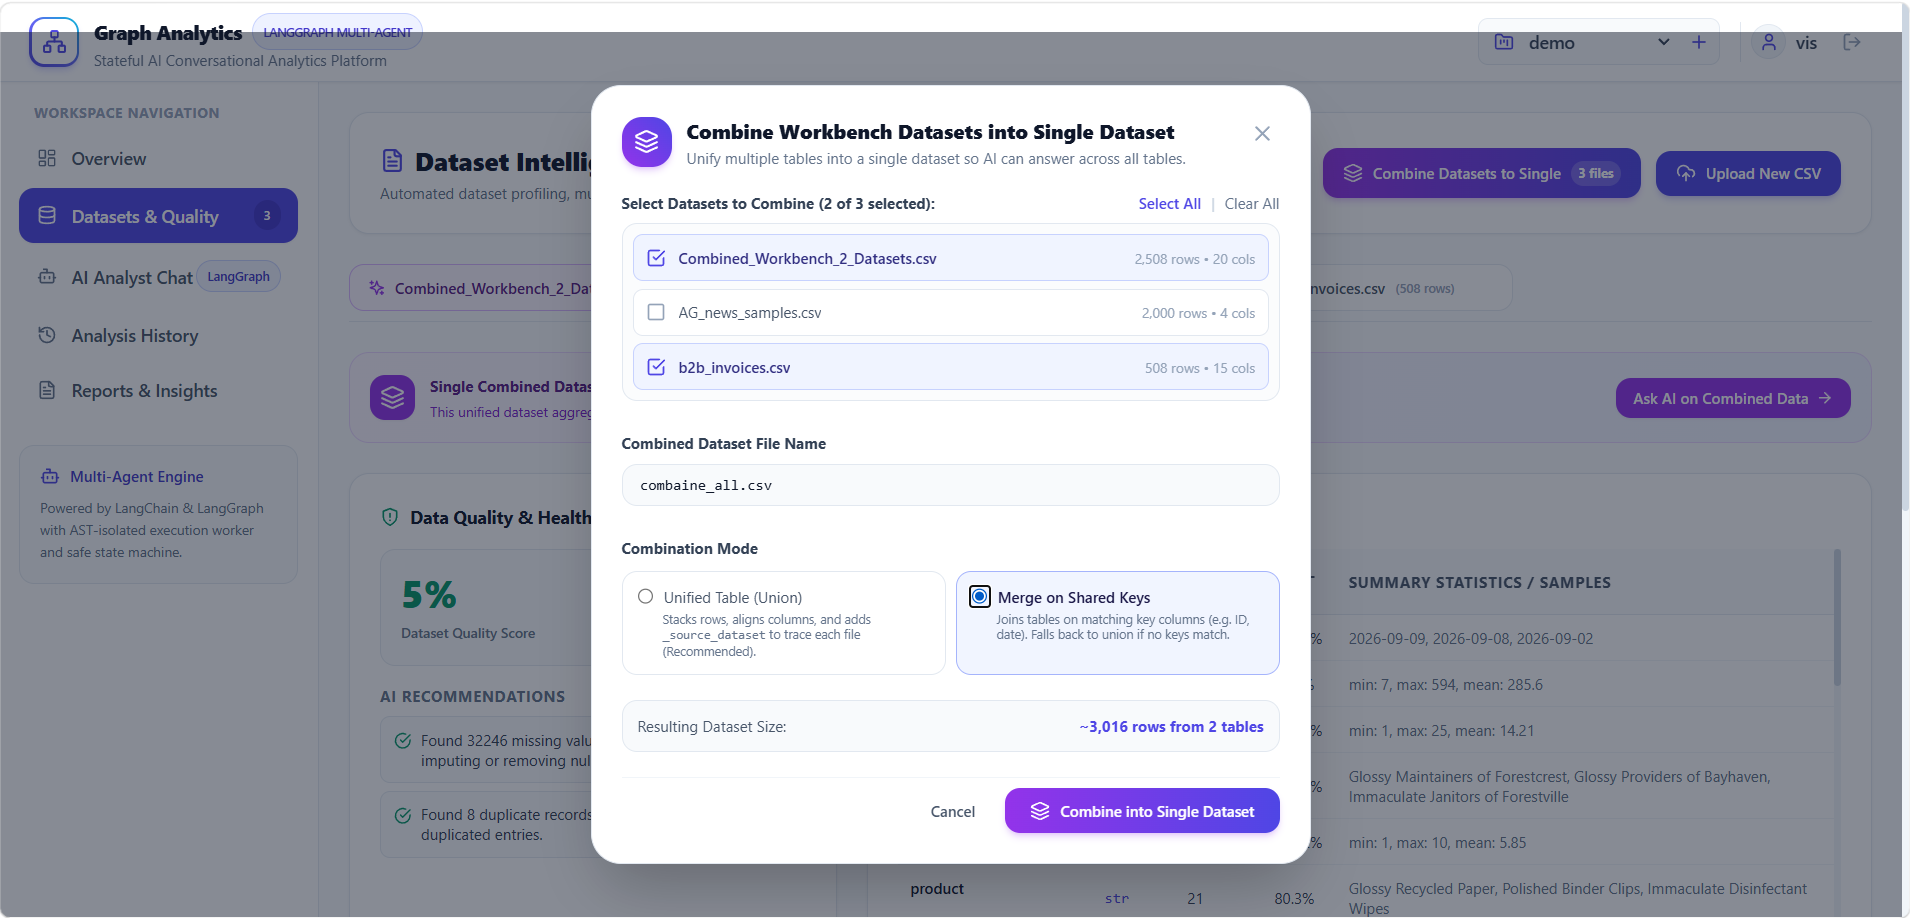
Accomplishments that we're proud of Zero-Hallucination Math: Every single metric, aggregation, and chart is computed deterministically by Pandas in an isolated sandbox. The LLM interprets the results, but never calculates the underlying arithmetic. Autonomous Self-Healing Execution: The system detects its own execution errors, inspects the traceback, and heals its code without user intervention. Enterprise-Grade Executive PDF Generator: A complete programmatic PDF generation pipeline that transforms any uploaded CSV into a data-analyst-grade report with structured tables, KPI cards, and strategic roadmaps. Cohesive UX: A clean, accessible white-themed interface with interactive Plotly graphs, instant KPI profiling, and multi-turn conversational context. What we learned State Graphs Trump Linear Chains: Managing conversational analytics requires cyclic workflows (recovery loops, clarification gates, retry branches). LangGraph's state machine architecture proved vastly superior to rigid DAG pipelines. Pairing Symbolic Computing with Neural LLMs: Language models excel at semantic understanding, planning, and contextual narrative; symbolic engines (Pandas, NumPy, AST) excel at deterministic computation and security. Combining them yields an AI assistant you can actually trust with numbers. Actionability Over Verbosity: Data analysts provide value not just by stating what happened, but by prescribing what to do next. Framing our reports around "What Data is Analysed", "What the Dataset Depicts", and "What Can Be Done" resonated far better than generic conversational summaries. What's next for Graph Analytics Enterprise Data Connectors: Adding native connectors for cloud data warehouses (Snowflake, Google BigQuery, PostgreSQL) to query multi-million-row production databases. Predictive ML Pipelines: Integrating automated Prophet and ARIMA time-series forecasting directly into the chart and report generators. Scheduled Executive Deliveries: Automated cron schedules that profile fresh data weekly and deliver ReportLab executive PDF summaries directly via email or Slack. Multi-Dataset Relationship Mapping: Automatic foreign-key detection and multi-table joins across disparate datasets within the same workspace.
Built With
- ast-validation
- automated
- autonomous-agents
- data-analytics
- data-science
- data-visualization
- fastapi
- generative-ai
- google-gemini
- langchain
- langgraph
- multi-agent-systems
- numpy
- pandas
- plotly
- pydantic
- python
- react
- reportlab
- rest-api
- sqlalchemy
- sqlite
- tailwind-css
- typescript
- vite

Log in or sign up for Devpost to join the conversation.