

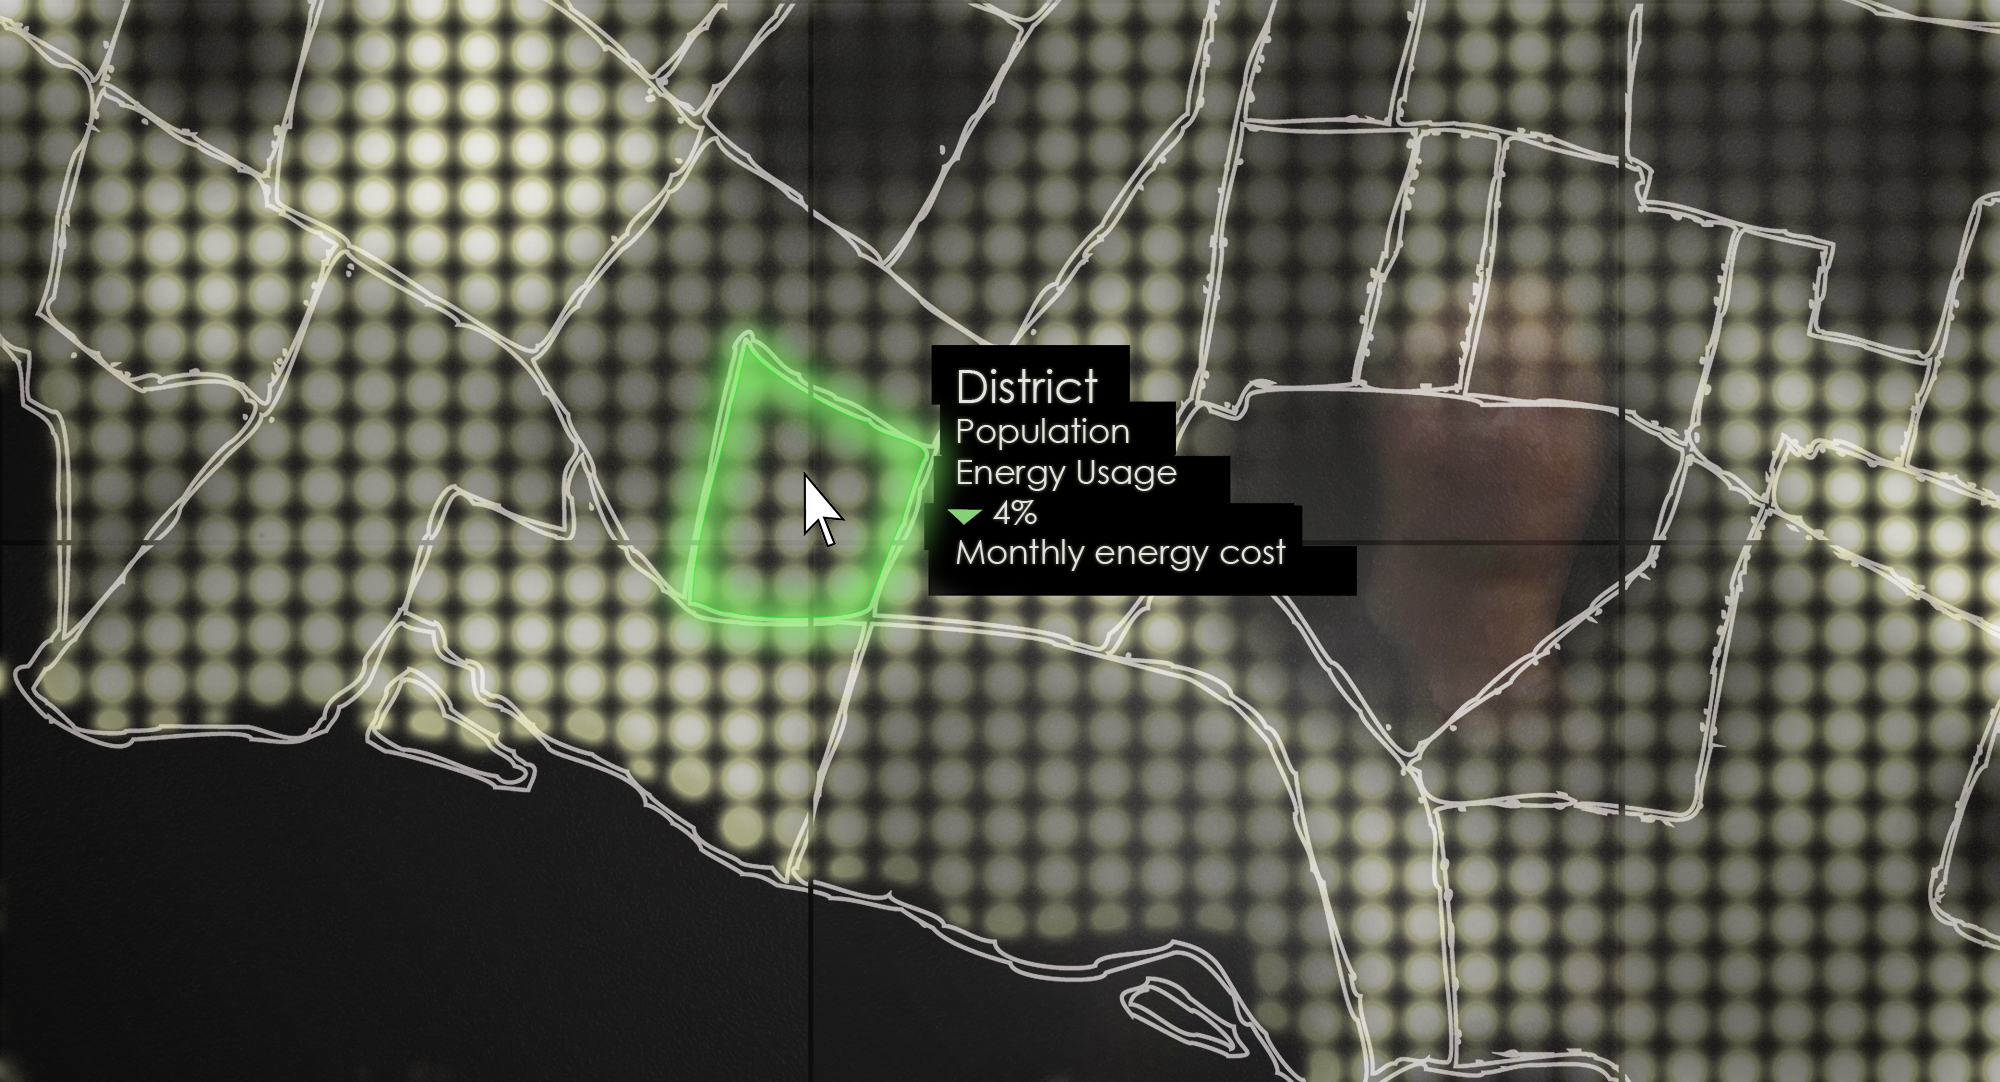
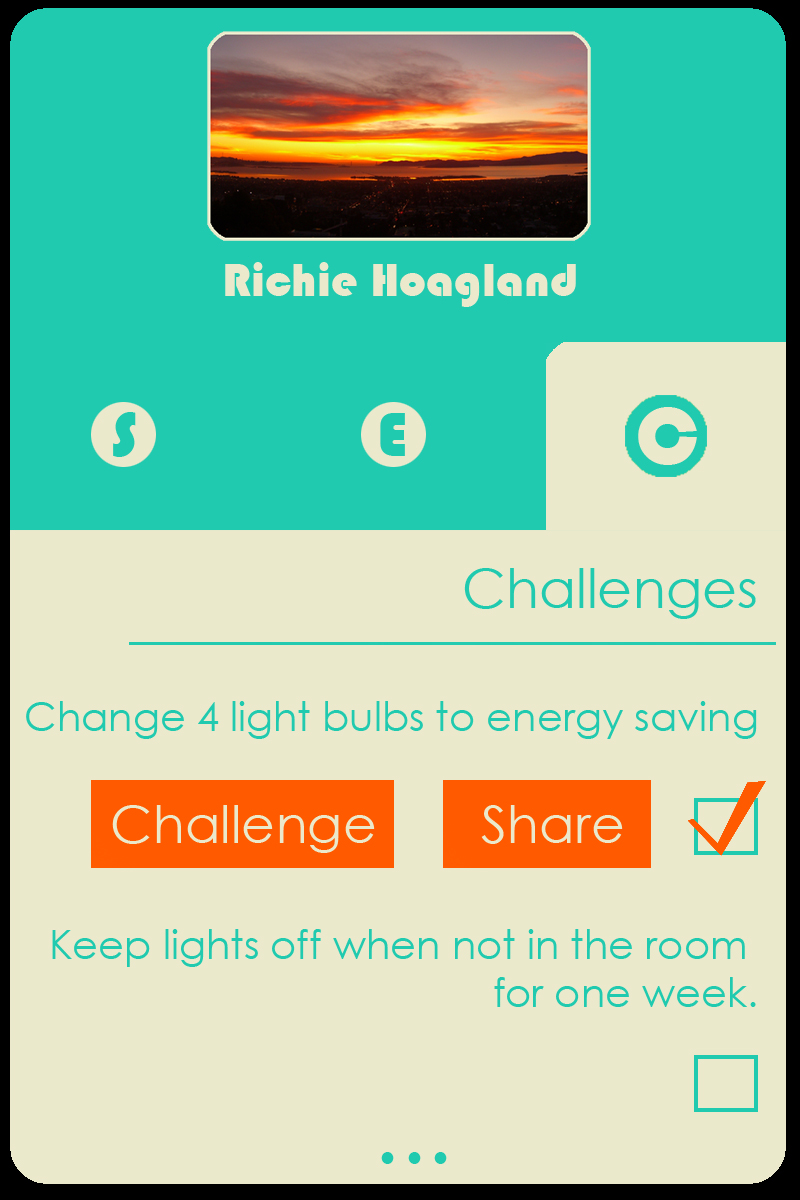
Every region is looking for new ways to be smarter with energy usage. Our web application combines with interactive art installations to show live energy consumption and savings. Online, users can interact with the map and get detailed statistics about average energy usage for their region. They can create personal profiles and track steps they're taking to individually contribute to smarter consumption.
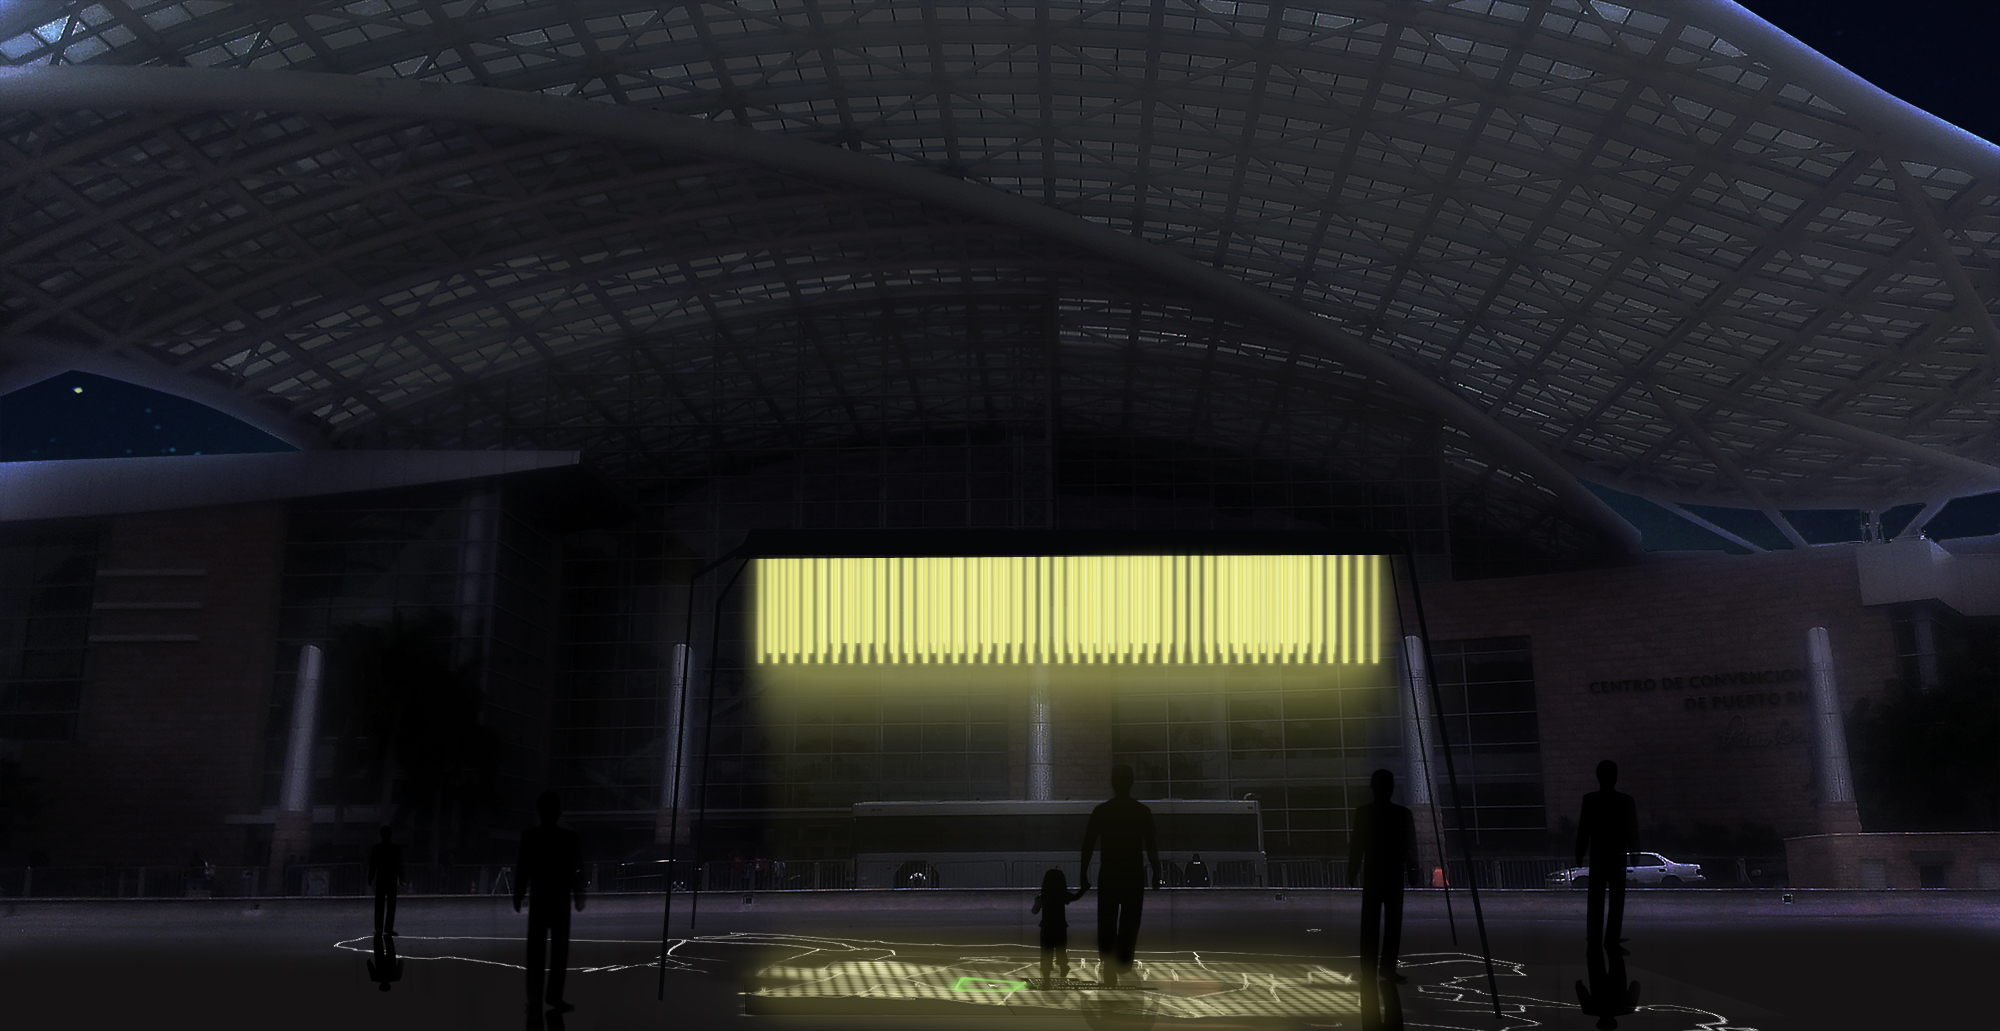
At the interactive art installation, lights from above shine down on the ground below to show a map of the area. The brighter the area, the more energy is being saved. People can visually engage with how their town is progressing.

Log in or sign up for Devpost to join the conversation.