-
-

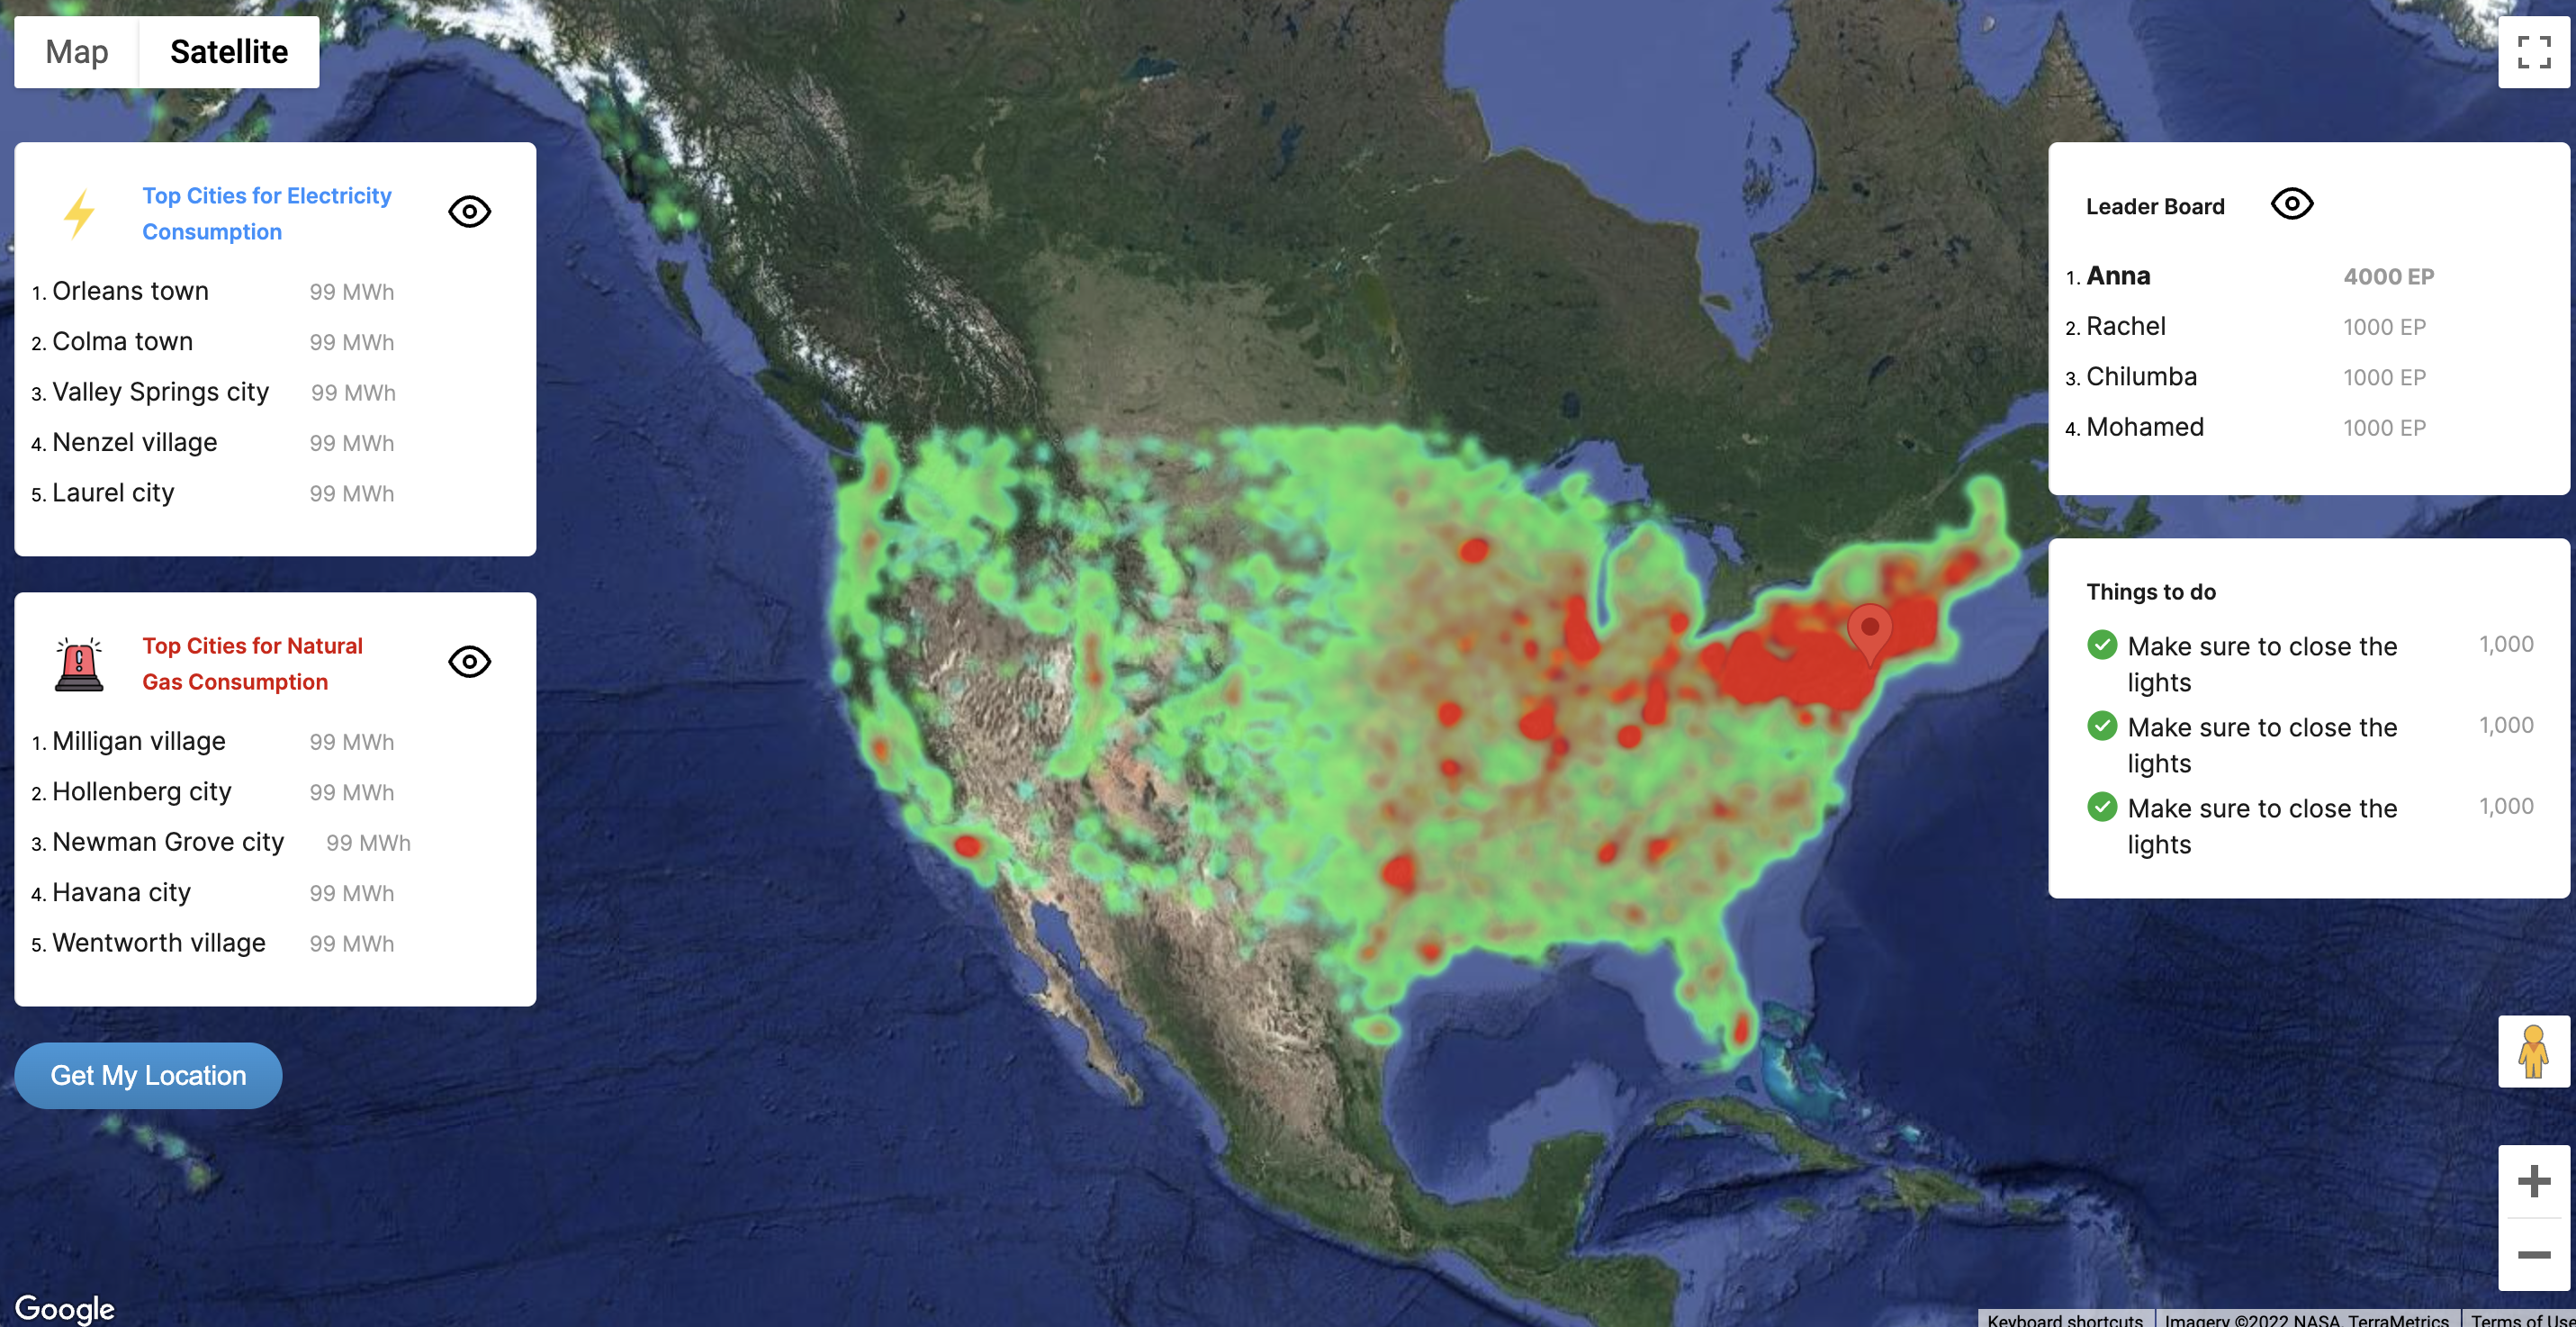
Nudj dashboard
Inspiration
Determined to tackle the climate crisis we were inspired by nudge theory. It operates by designing choices for people which encourage positive helpful decisions. Our goal for the project was to incite behaviour change around energy consumption, encouraging people to use less energy. We decided to lean on the power of Social influence nudges, leaning into people’s desire to conform and comply with what is believed to be expected from them. When designing the product we focused on the following motivational nudges: Raising the visibility of users’ actions: This approach leverages the spotlight effect, our tendency to overestimate the extent to which our actions and decisions are noticeable to others, thus promoting behaviors that elicit social approval and avoid social rejection. Enabling social comparisons: The herd instinct bias refers to our tendency to replicate others’ actions. We tend to pay attention to others’ conducts and search for social proof when we are unable to determine the appropriate conduct. Finally, we wanted to build in appropriate reinforcement nudges through just-in-time prompts and gamification.
What it does
Nudj is an interactive heat map of real-time, location-based energy usage (electricity & gas). The aim is to inspire people to use less energy through comparison with others in their area (social influence nudges), paired with positive, timely prompts (reinforcement nudges) and a gamified feedback loop. Push notifications alert users to high energy consumption in their area, providing 3 simple suggestions on how to can reduce their energy usage. Conversely, when local energy usage is low, users are rewarded with energy points. A localised leader board encourages users to collect energy points, earn badges and become an energy hero in their neighbourhood.
How we built it
Nudj was built using vanila javascript HTML, PHP and myql
Challenges we ran into
We had challenges layering the data onto the map. Our goal was to build a the data to a very granular level to allow users to view on a street level what the power consumption per household / street was. We quickly found that this was a challenge even if we used dummy data.
Accomplishments that we're proud of
We are very happy to have built something from nothing and to have used the Google maps api to visualise our data. We are 4 strangers that met in London and decided to work on a the same project, our passion to save the environment and build something new is very exciting.
What we learned
We learned a lot about energy and power consumption we also learned about the importance of Data structures.
What's next for Nudj
We hope one day Nudj can be available for households around the world, to encourage them to use energy wisely, we think having a visibility of consumption data is important
Built With
- api
- html
- javascript
- maps


Log in or sign up for Devpost to join the conversation.