-
-

-
-
-
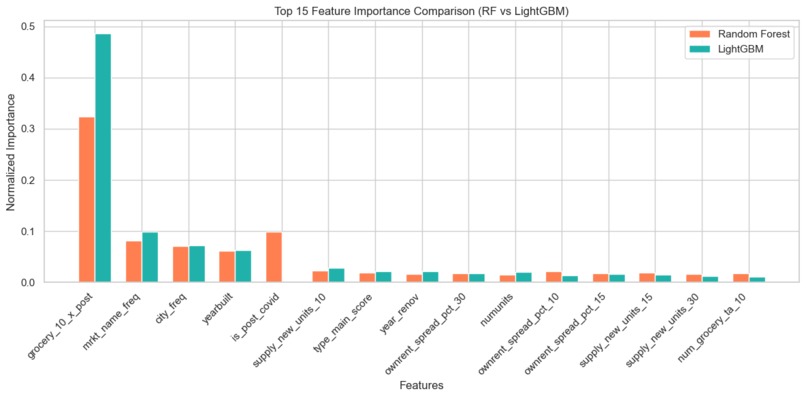
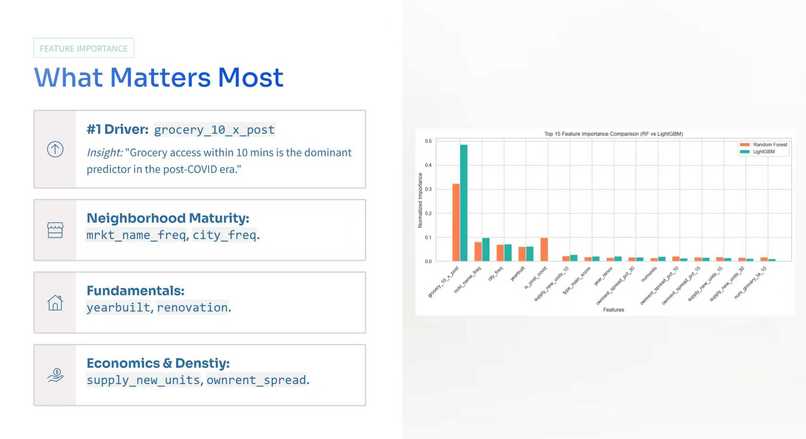
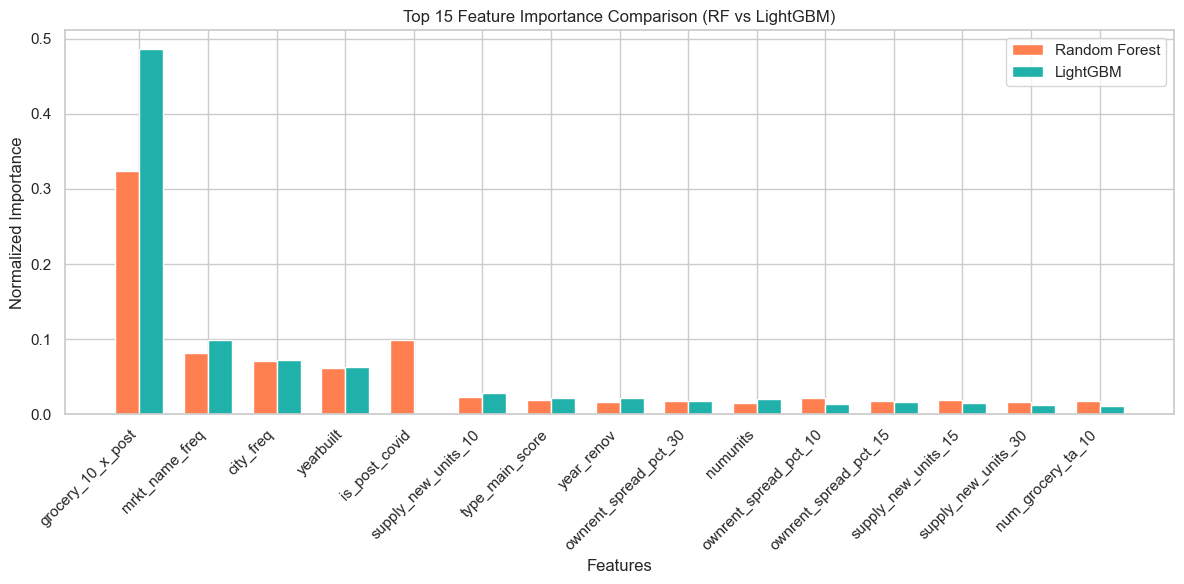
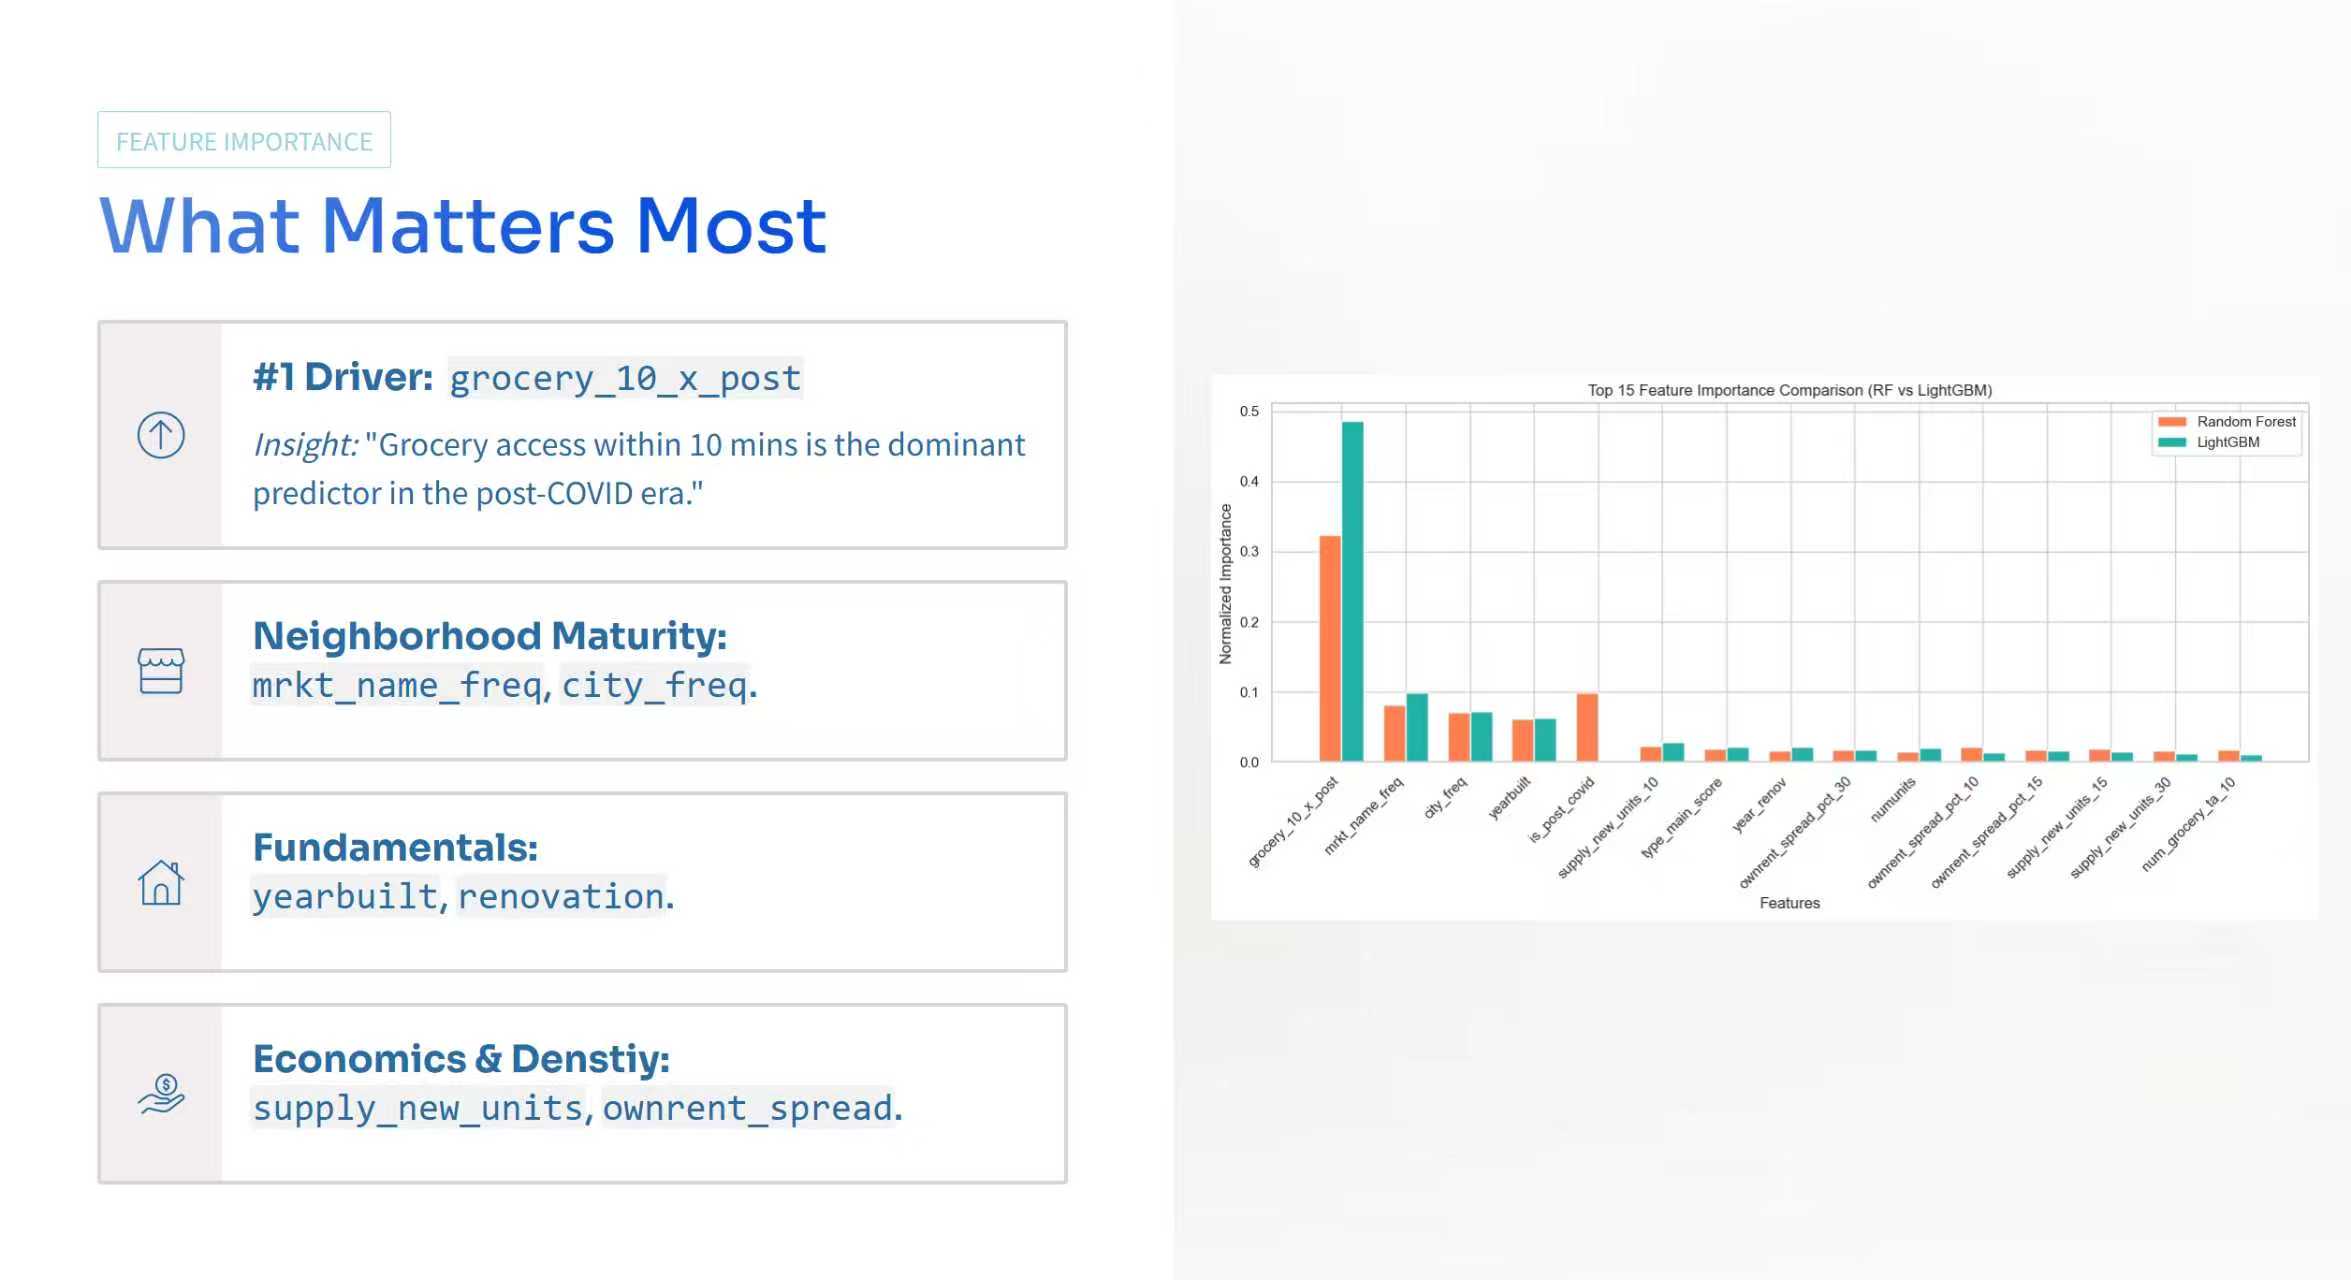
Top 15 Feature Importance Comparison (RF vs LightGBM)
-
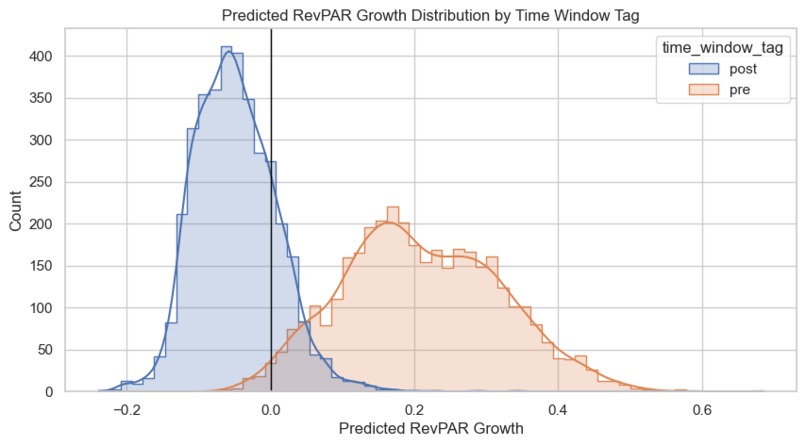
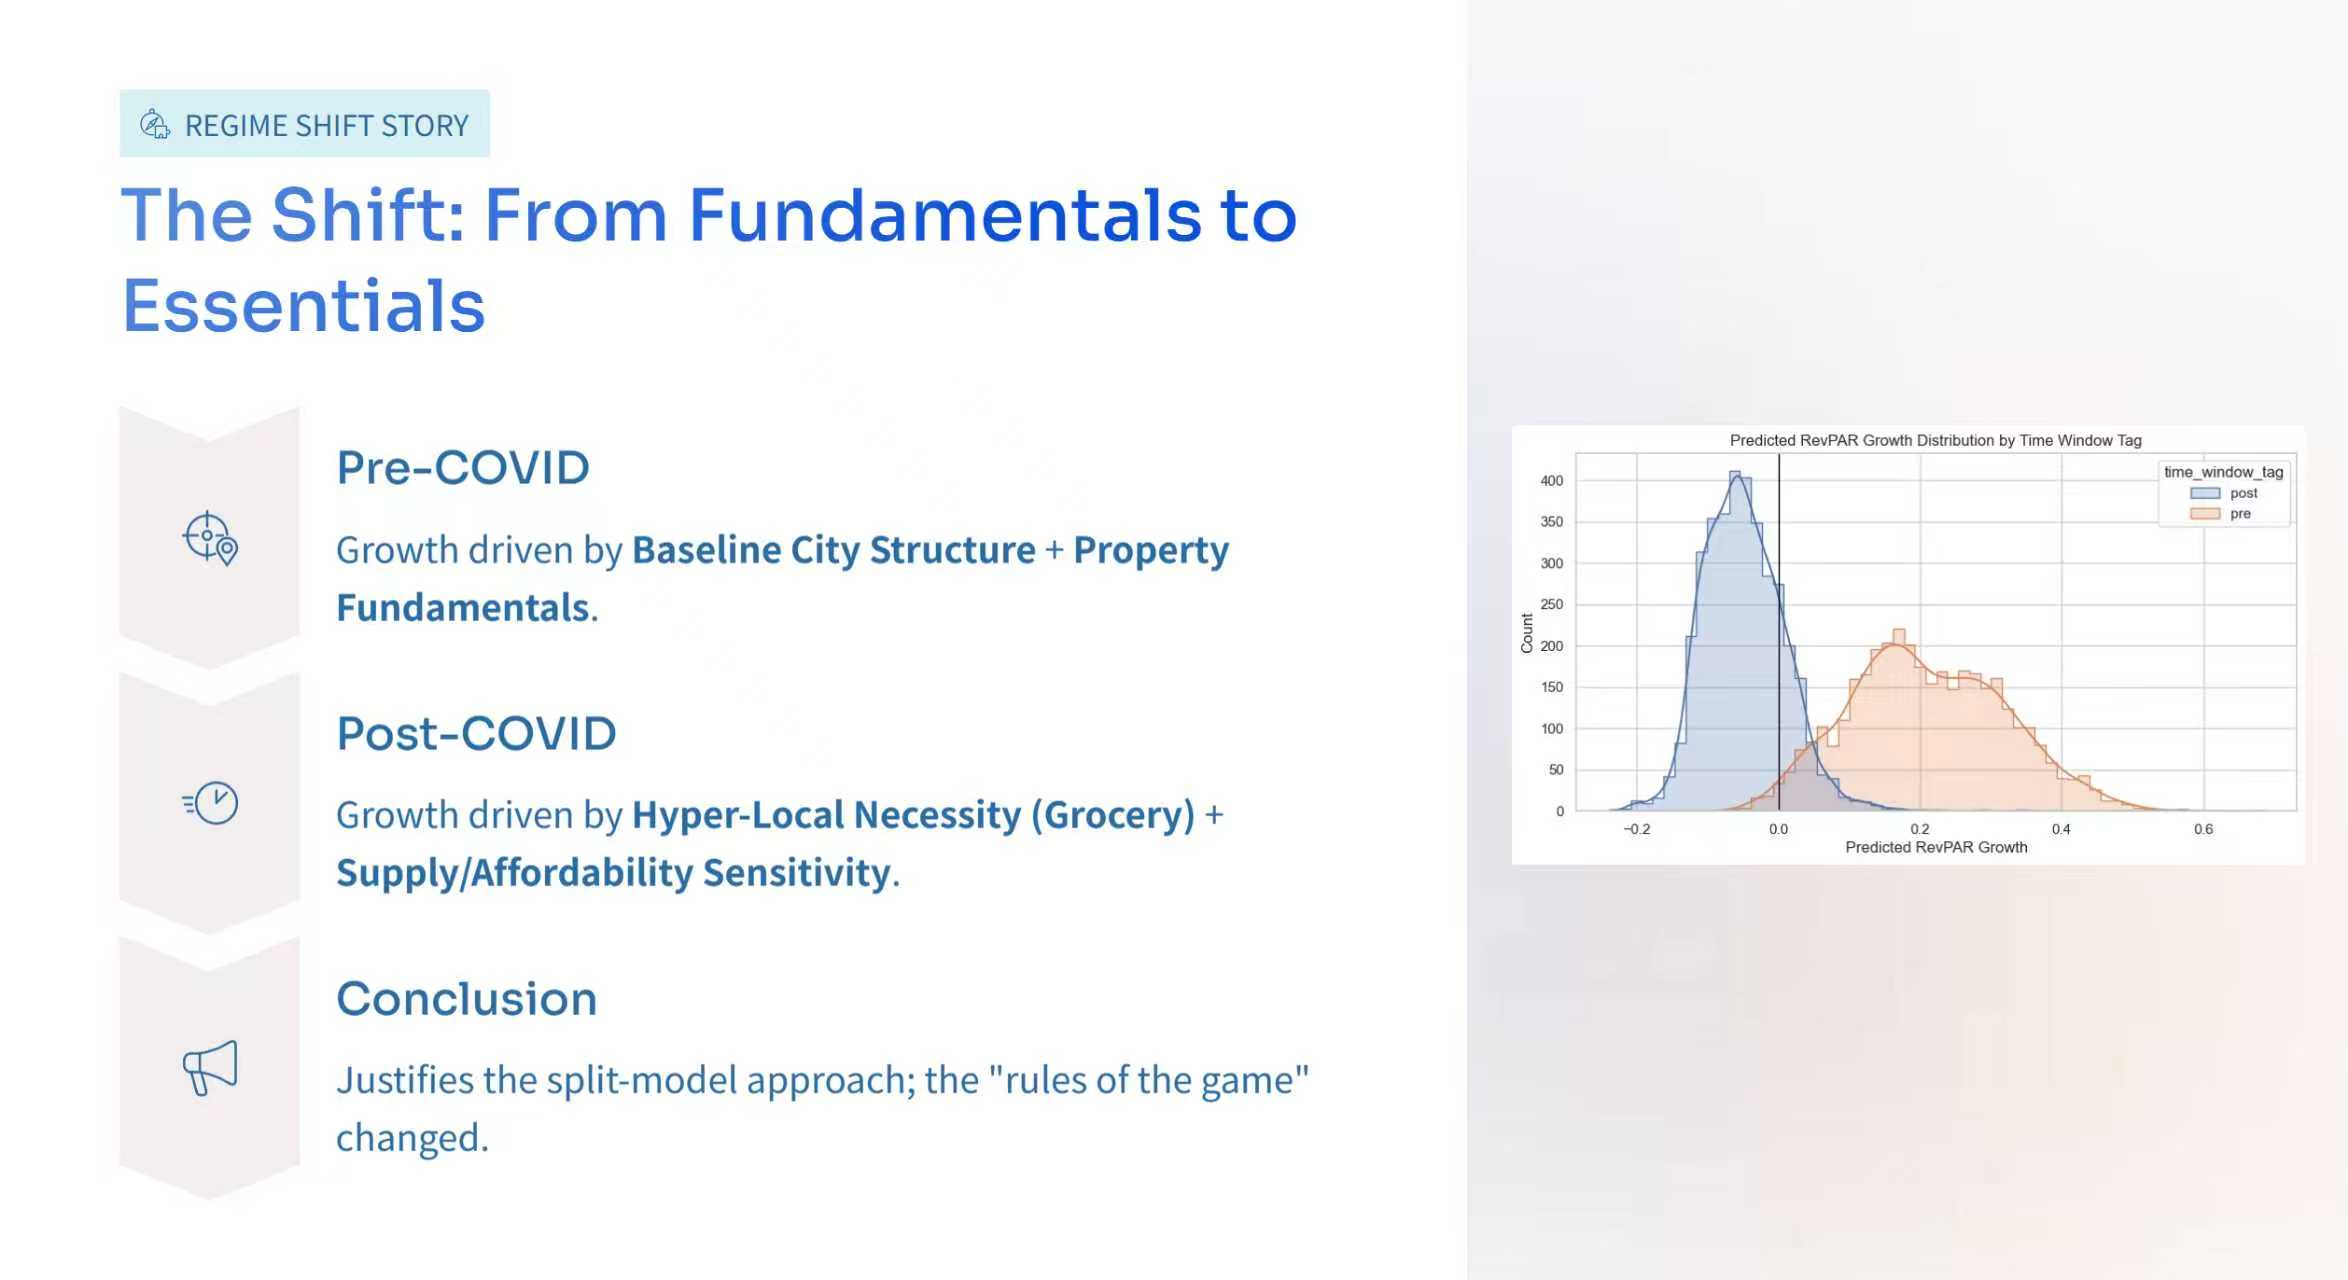
Predicted RevPAR Growth Distribution by Time Window Tag
-
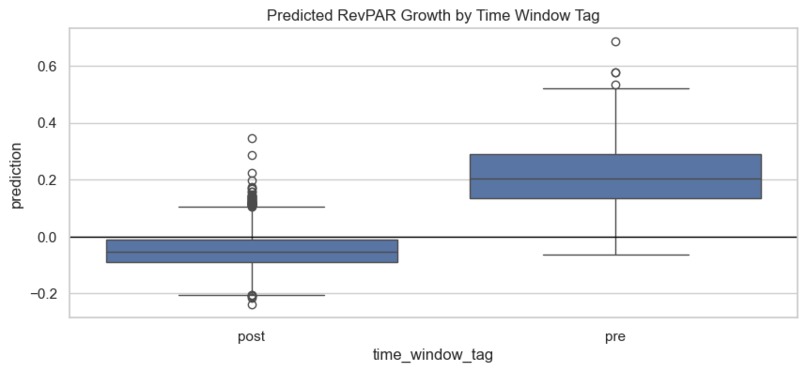
Predicted RevPAR by Time Window tag
-
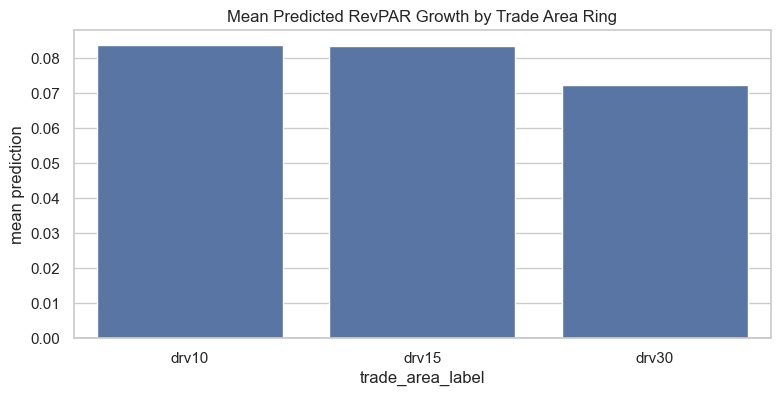
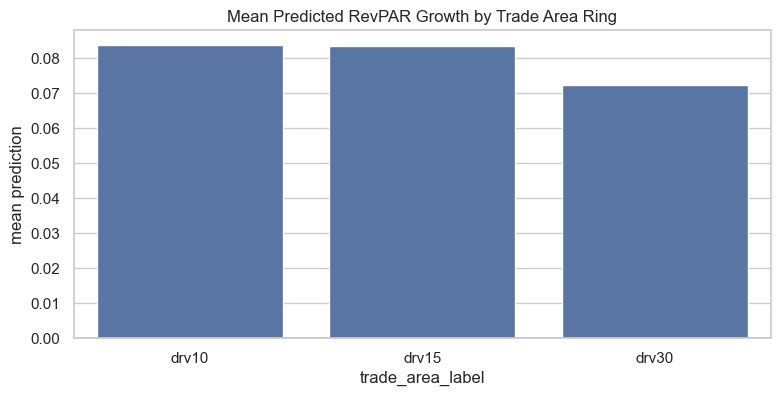
Mean Predicted RevGrowth Rate by Trade Area Ring
-
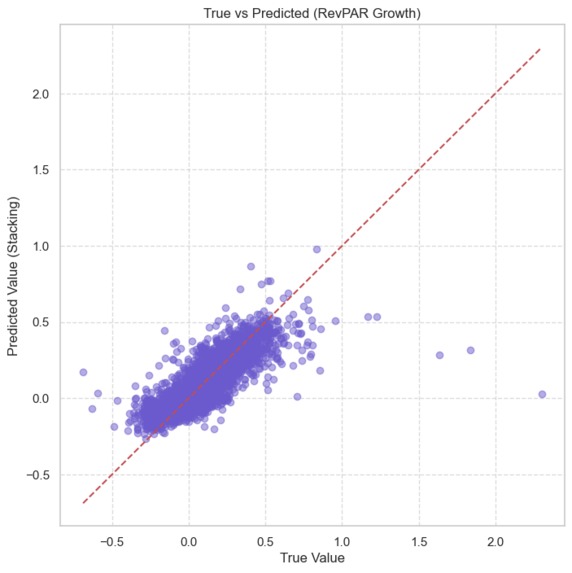
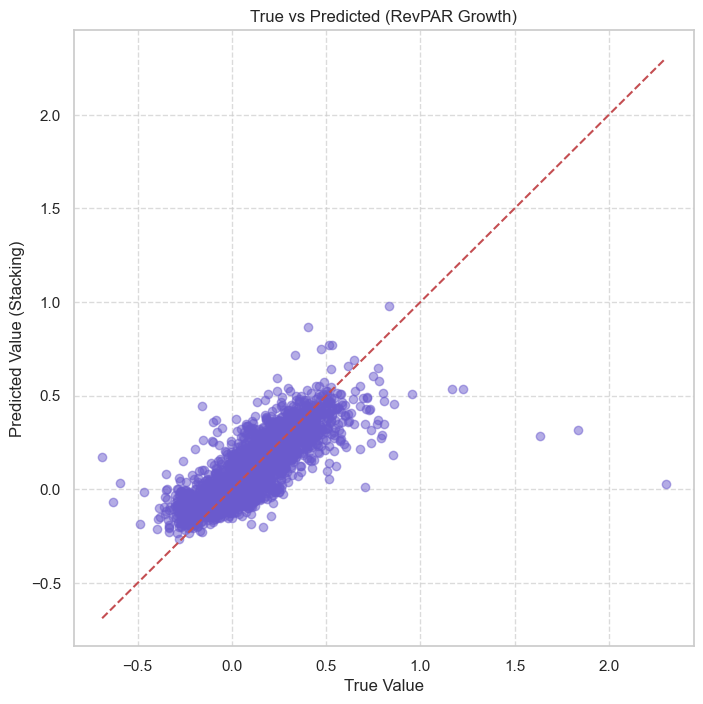
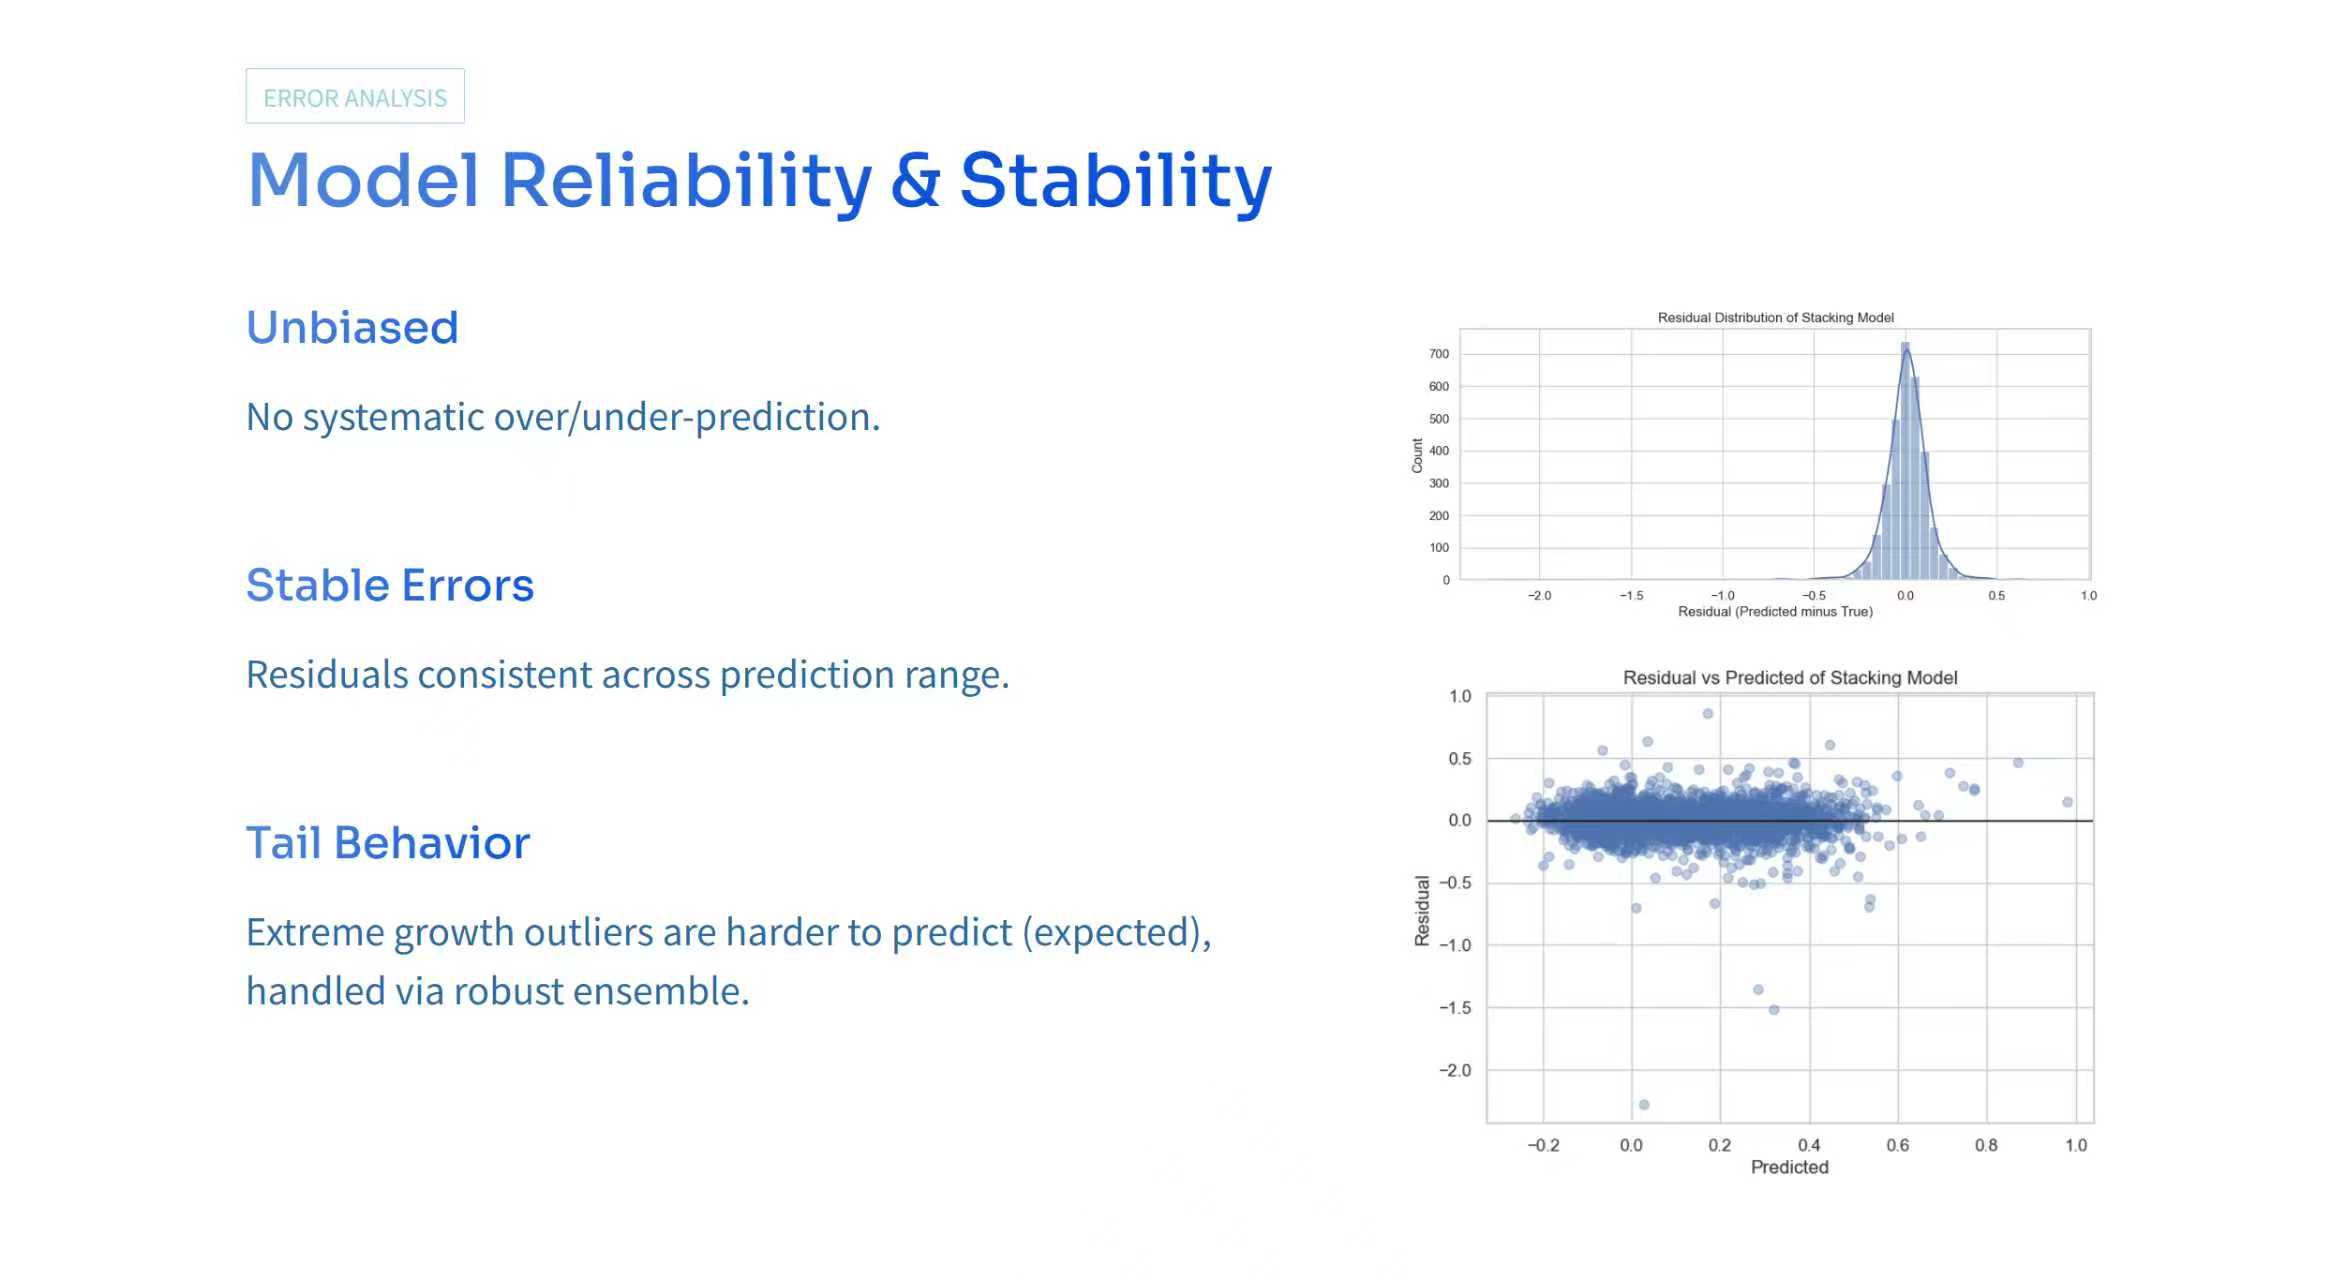
True vs Predicted
-
-
-


Inspiration
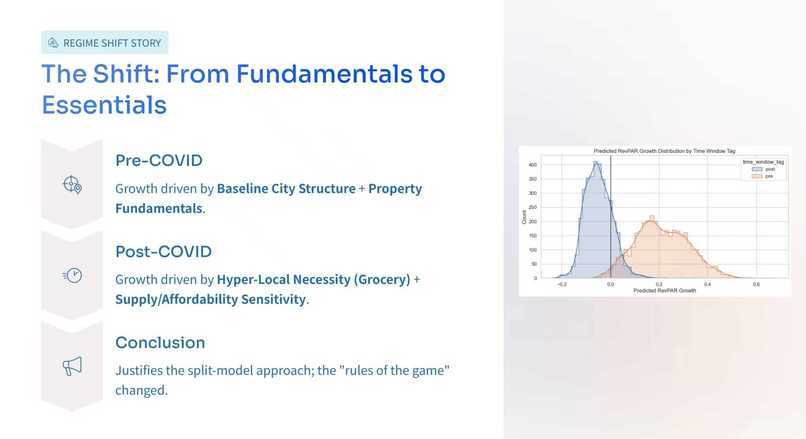
We were inspired by a simple observation from the BroadVail prompt: the same apartment community can look like a winner in one period and an average performer in another, especially across the pre- and post-hybrid work era. The competition framing around the “X minutes city” idea pushed us to think beyond basic property attributes and to treat accessibility, neighborhood context, and local amenities within realistic drive-time rings as first-class signals.
That led to our core motivation: build a model that is not only accurate, but also explainable enough to answer a finance-style question. Why did this property outperform, and which local factors were most associated with that outperformance in different time windows?
What it does
Our project predicts property-level RevPAR Growth for two time windows, then turns the predictions into interpretable insights about what correlates with growth.
We define RevPAR as:
$$ \mathrm{RevPAR}=\mathrm{EffectiveRent}\cdot \mathrm{OccupancyRate} $$
We treat RevPAR Growth as a relative change between two averaged RevPAR levels across a start period and an end period, using a compact math form:
$$ \mathrm{RevPARGrowth}=\frac{\Delta \overline{\mathrm{RevPAR}}}{\overline{\mathrm{RevPAR}}_{\mathrm{start}}} $$
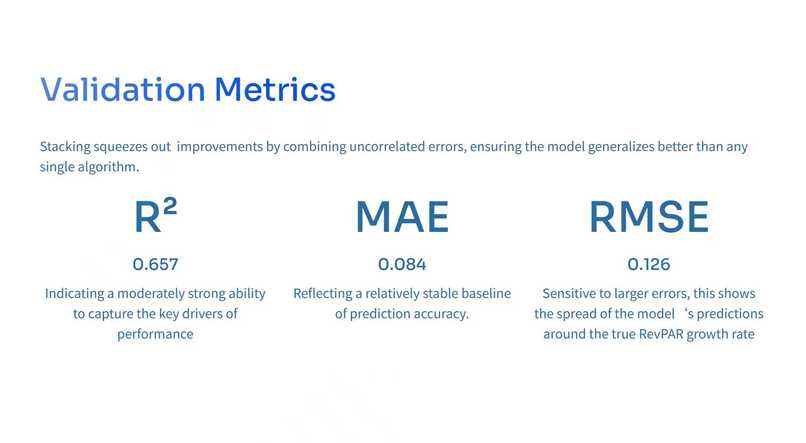
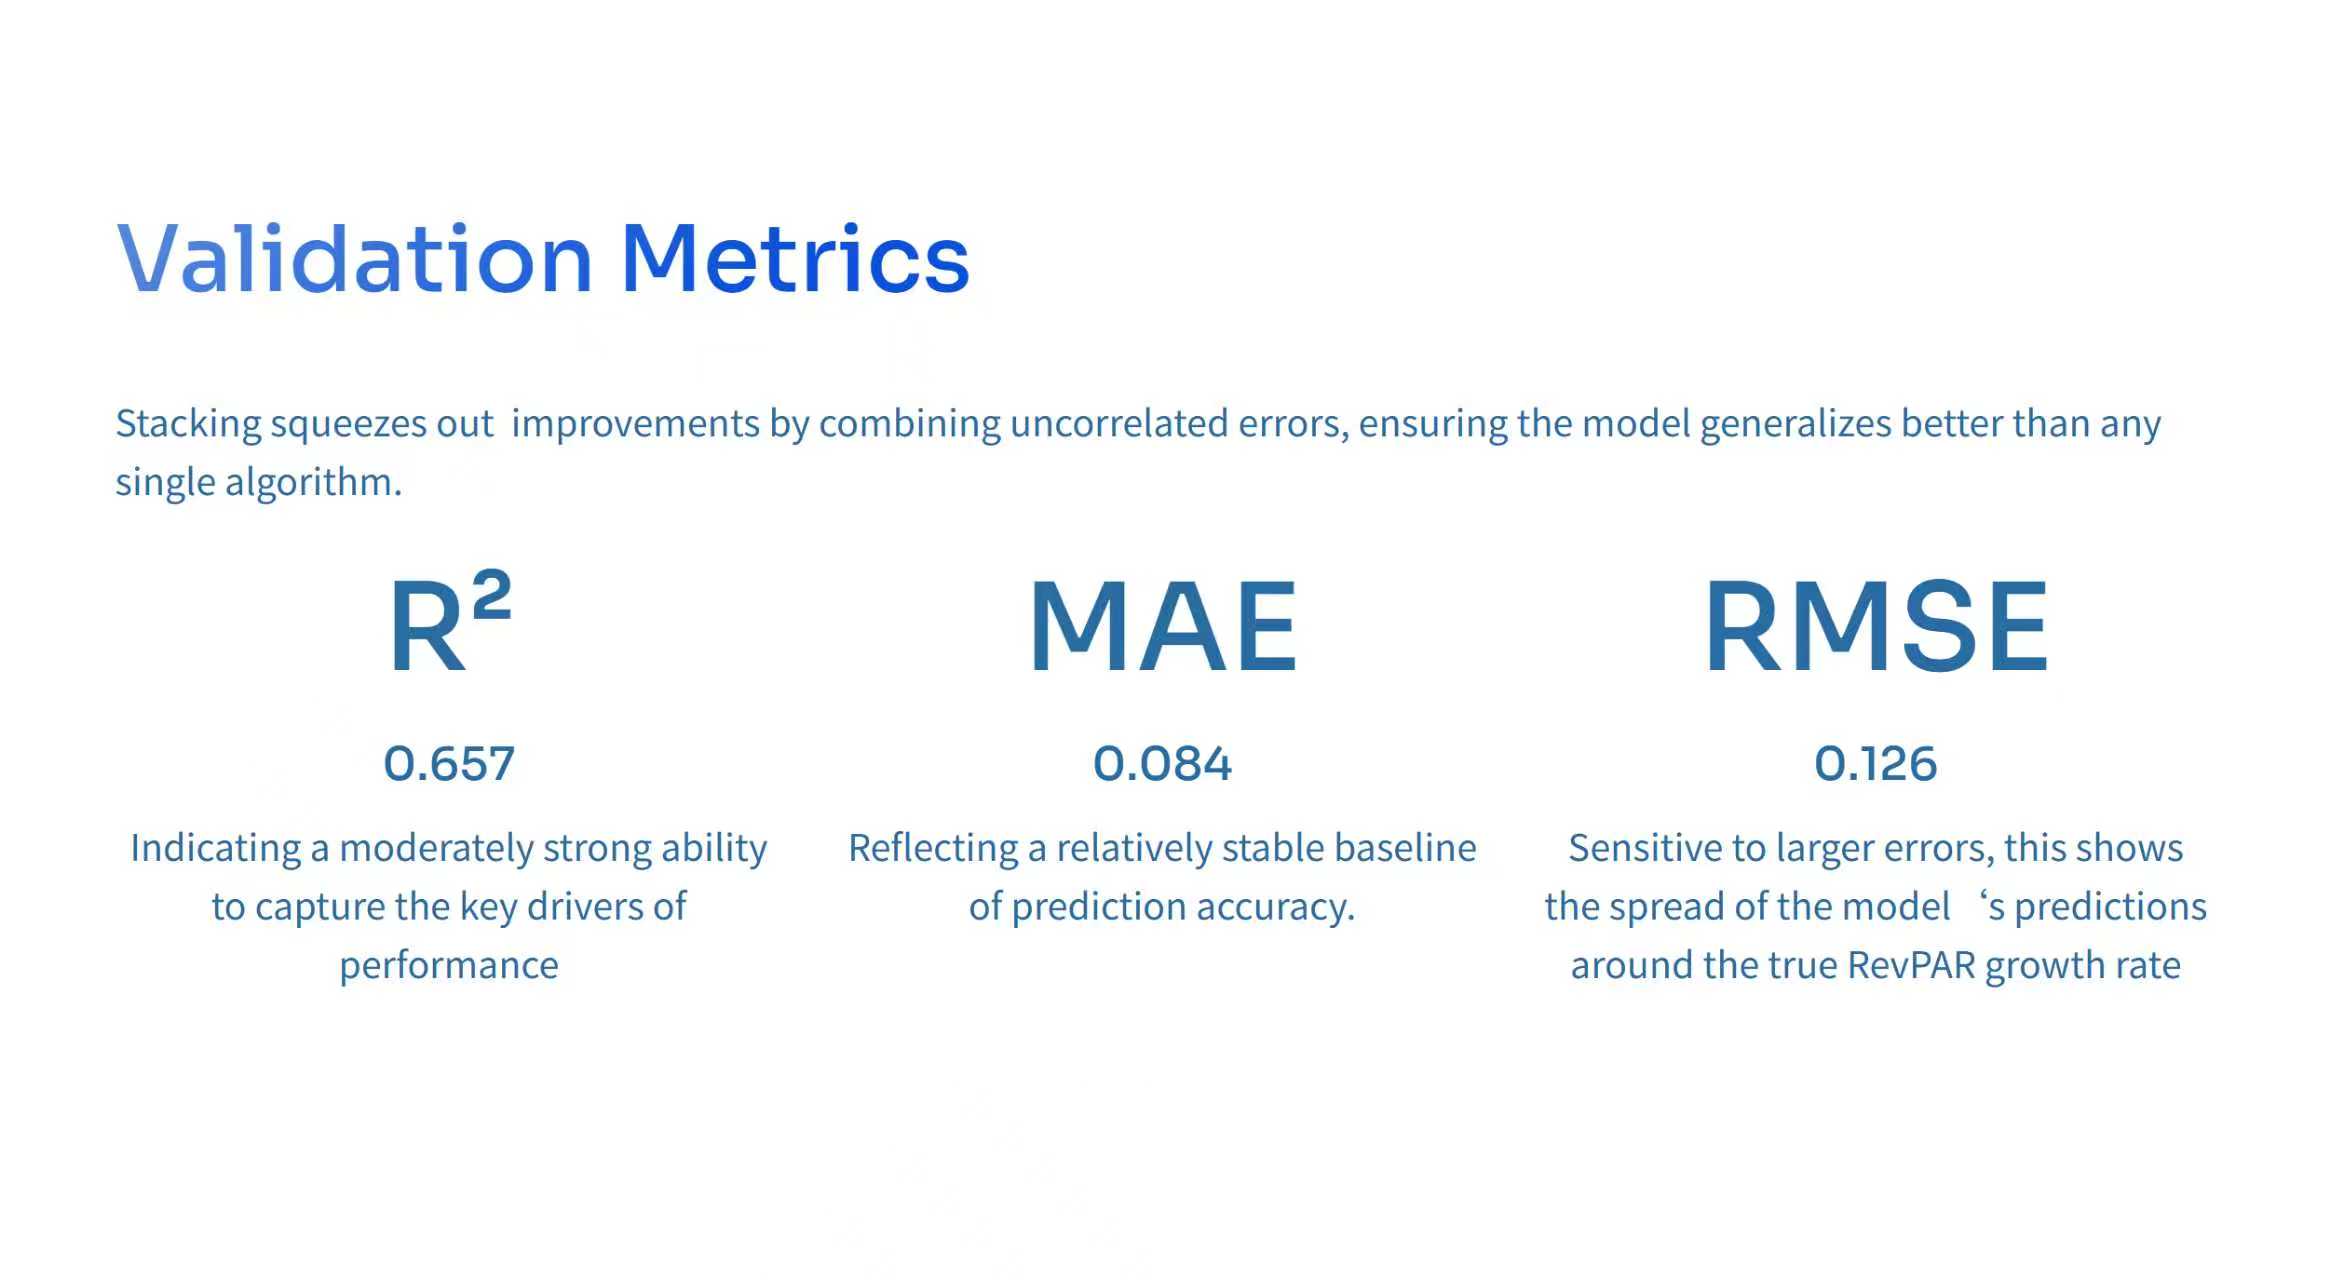
We evaluate models using RMSE:
$$ \mathrm{RMSE}=\sqrt{\frac{1}{n}\sum_{i=1}^{n} e_i^2} $$
where (e_i) is the prediction error for property (i).
How we built it
Data understanding and feature design
We started by mapping the dataset structure carefully because each property can appear multiple times across different drive time rings and time window tags. That means the target columns and valid feature columns depend on the window selection, and naive preprocessing can silently create leakage.
We grouped features into three broad categories:
- Property attributes and baseline market context
- Amenity and supply features aggregated within each drive time ring
- Neighborhood and livability style indicators that capture the local environment
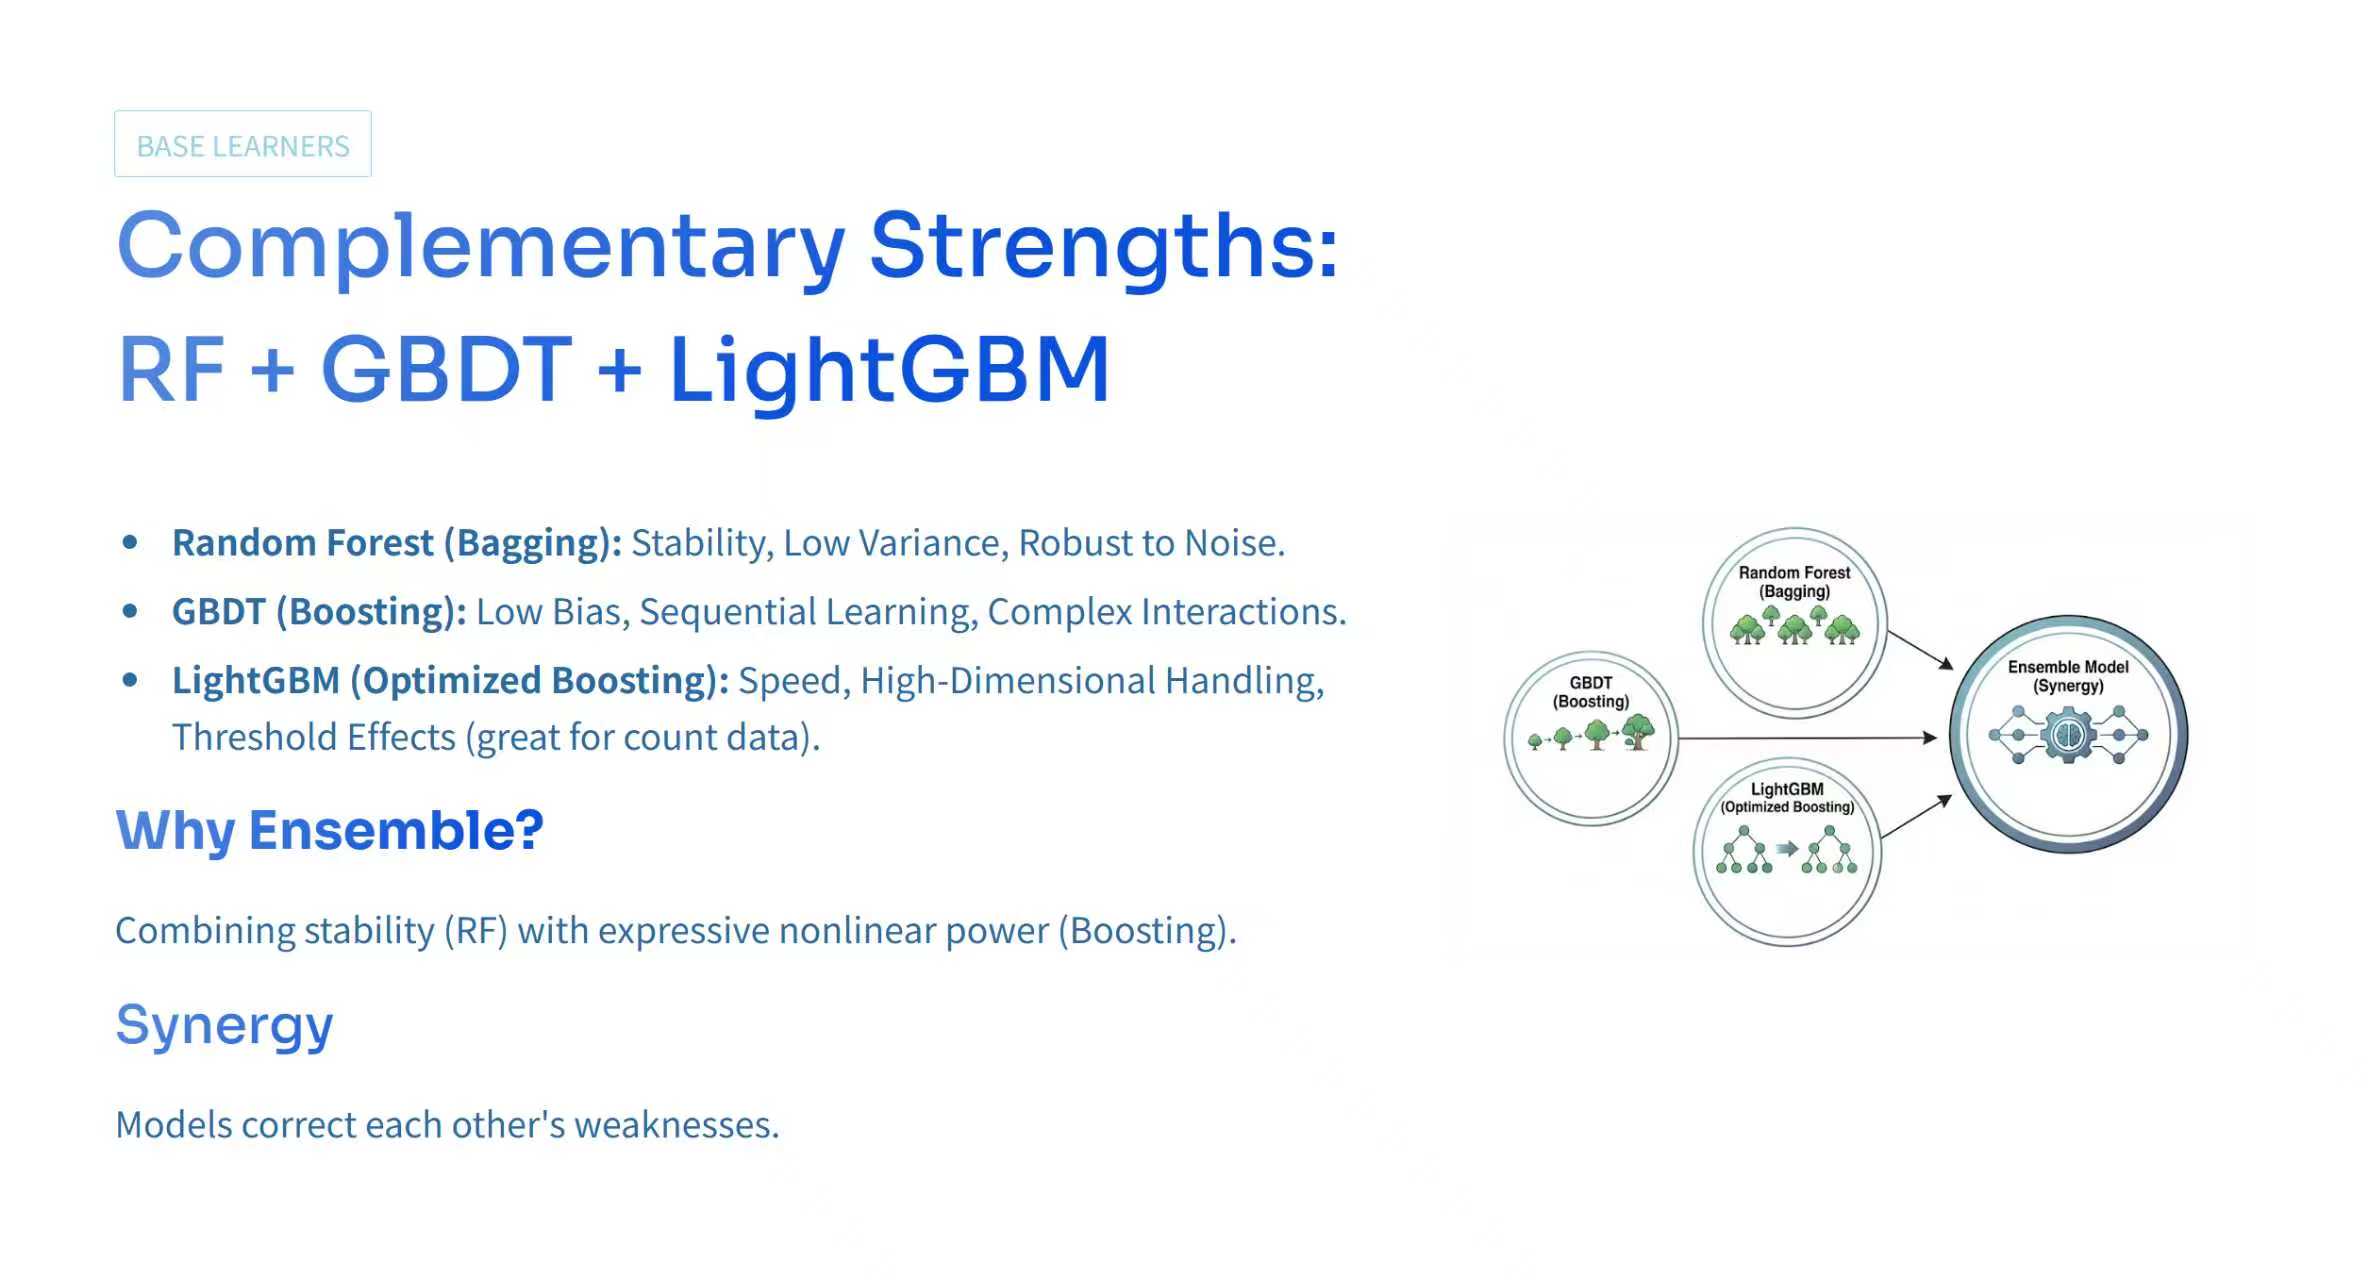
Modeling choice
We built a fusion model using three strong tree based learners:
- Random Forest for stability and variance reduction
- Gradient Boosting Decision Trees for strong nonlinear fitting
- LightGBM for efficient gradient boosting with strong performance on tabular data
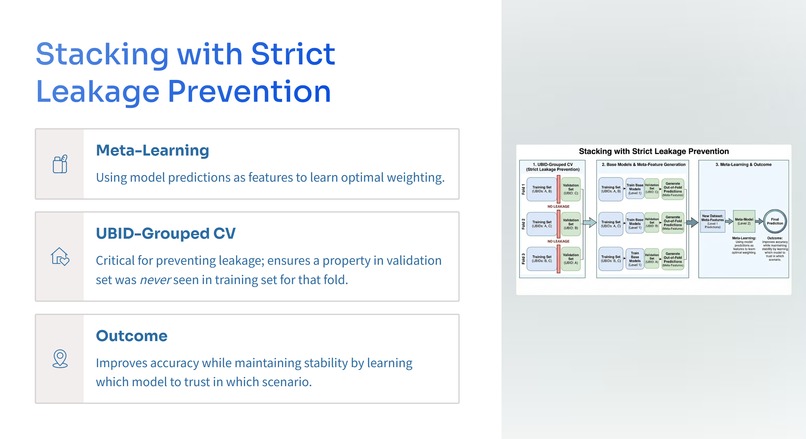
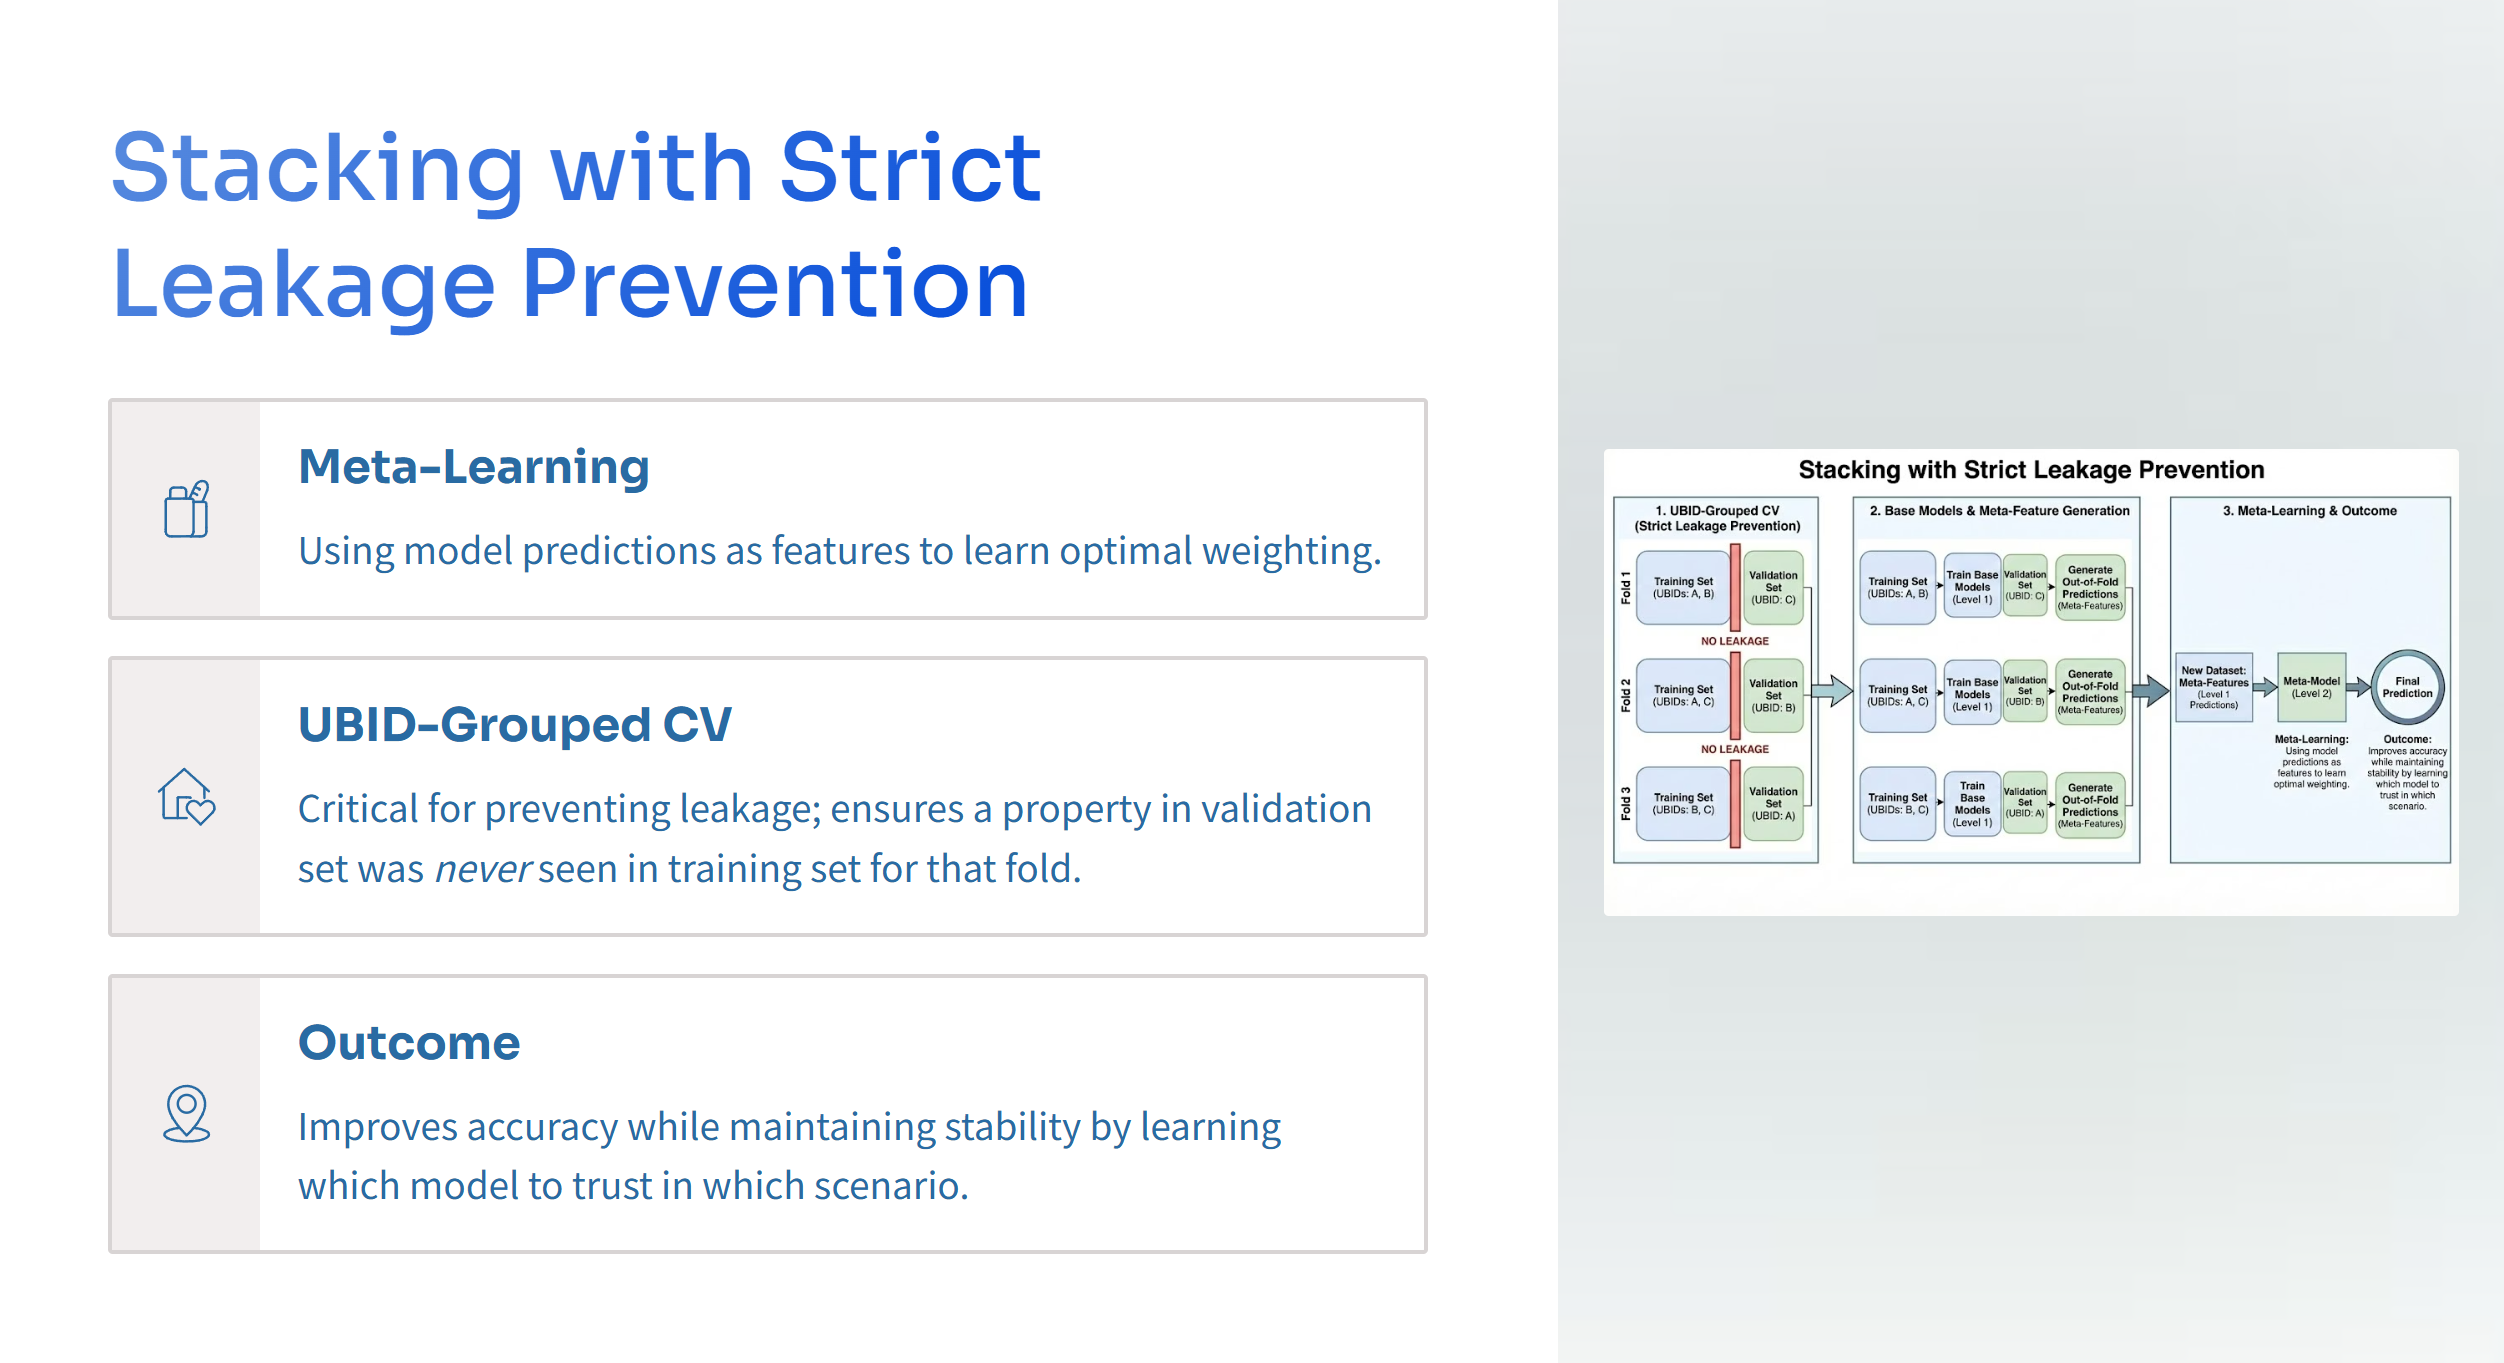
Stacking ensemble with out of fold training
Instead of averaging predictions, we used stacking so the final model learns how to combine base model signals. The key to making stacking honest is out of fold predictions.
Conceptually:
$$ \hat y = g!\left(f_1(x), f_2(x), f_3(x)\right) $$
where (f_1,f_2,f_3) are the three base models and (g) is a regularized meta learner trained on out of fold outputs. This structure reduced overfitting risk and improved generalization versus any single model.
Reproducibility
We treated the pipeline like a small research project:
- fixed random seeds
- consistent data splits
- clear separation of training features and scoring targets
- notebook sections that generate analysis outputs for each stage, not just final metrics
Challenges we ran into
Target leakage and overfitting traps
The hardest issue was leakage. In this dataset, some columns are dangerously close to the scoring target, and it is easy to accidentally include information that should be hidden at training time. When that happens, the model can look extremely strong in validation while failing to generalize.
We addressed this with a strict feature whitelist approach driven by the time window tags and target definitions, plus repeated leakage audits where we checked:
- whether any feature is constructed using future information
- whether any target derived column slipped into training features
- whether feature importance is dominated by suspicious proxy variables
Split strategy under repeated entities
Because the same property appears across multiple rings and windows, random row splits can overstate performance by letting the model see a near duplicate view of the same property in training. We handled this by treating property identity as a structural unit and using group aware thinking when validating, plus sanity checks to detect overly optimistic scores.
Interpretability under complex features
Amenity features can be high dimensional and correlated. We had to balance model capacity with interpretation clarity. We leaned on feature importance comparisons across base learners and window specific analysis so we could tell a coherent story about what changed between periods.
Accomplishments that we're proud of
- Built a complete end to end pipeline that trains, validates, and produces final predictions for both time windows in a reproducible way
- Implemented a stacking ensemble with out of fold training to reduce overfitting risk and strengthen generalization
- Diagnosed and corrected leakage risks, including cases where target adjacent information could sneak into training features
- Produced model interpretation outputs that connect predictions back to neighborhood and amenity signals so the result is actionable, not just a score
What we learned
- In tabular prediction, data structure understanding often matters more than the choice of algorithm
- Leakage is not a rare edge case; it is the default failure mode when targets are derived from related columns
- Stacking works best when the meta learner is trained on out of fold predictions; otherwise it can memorize noise
- Validation design must respect entity repetition, especially when the same real-world object appears multiple times in the dataset
- Interpretability is a product requirement, not a bonus, when the goal is to support finance decisions
What's next for RevPAR Growth Prediction Fusion Model: RF + GBDT + LightGBM
- Stronger group-based validation: enforce property-level grouping more strictly and compare multiple splitting strategies to quantify robustness
- Better uncertainty reporting: produce prediction intervals so the output can be used in risk aware decision making
- Window-specific explanation: automate side-by-side interpretation for pre- and post windows, focusing on how the drivers shift
- Feature refinement: compress correlated amenity features into more stable composites and test sensitivity to ring definitions
- Practical deployment thinking: add lightweight monitoring checks that detect drift in key features so the model remains reliable if the market regime changes
Built With
- colab
- gbdt
- jupyter
- lightgbm
- matplot
- numpy
- pandas
- python
- scikit-learn


Log in or sign up for Devpost to join the conversation.